WPR Candles
Download script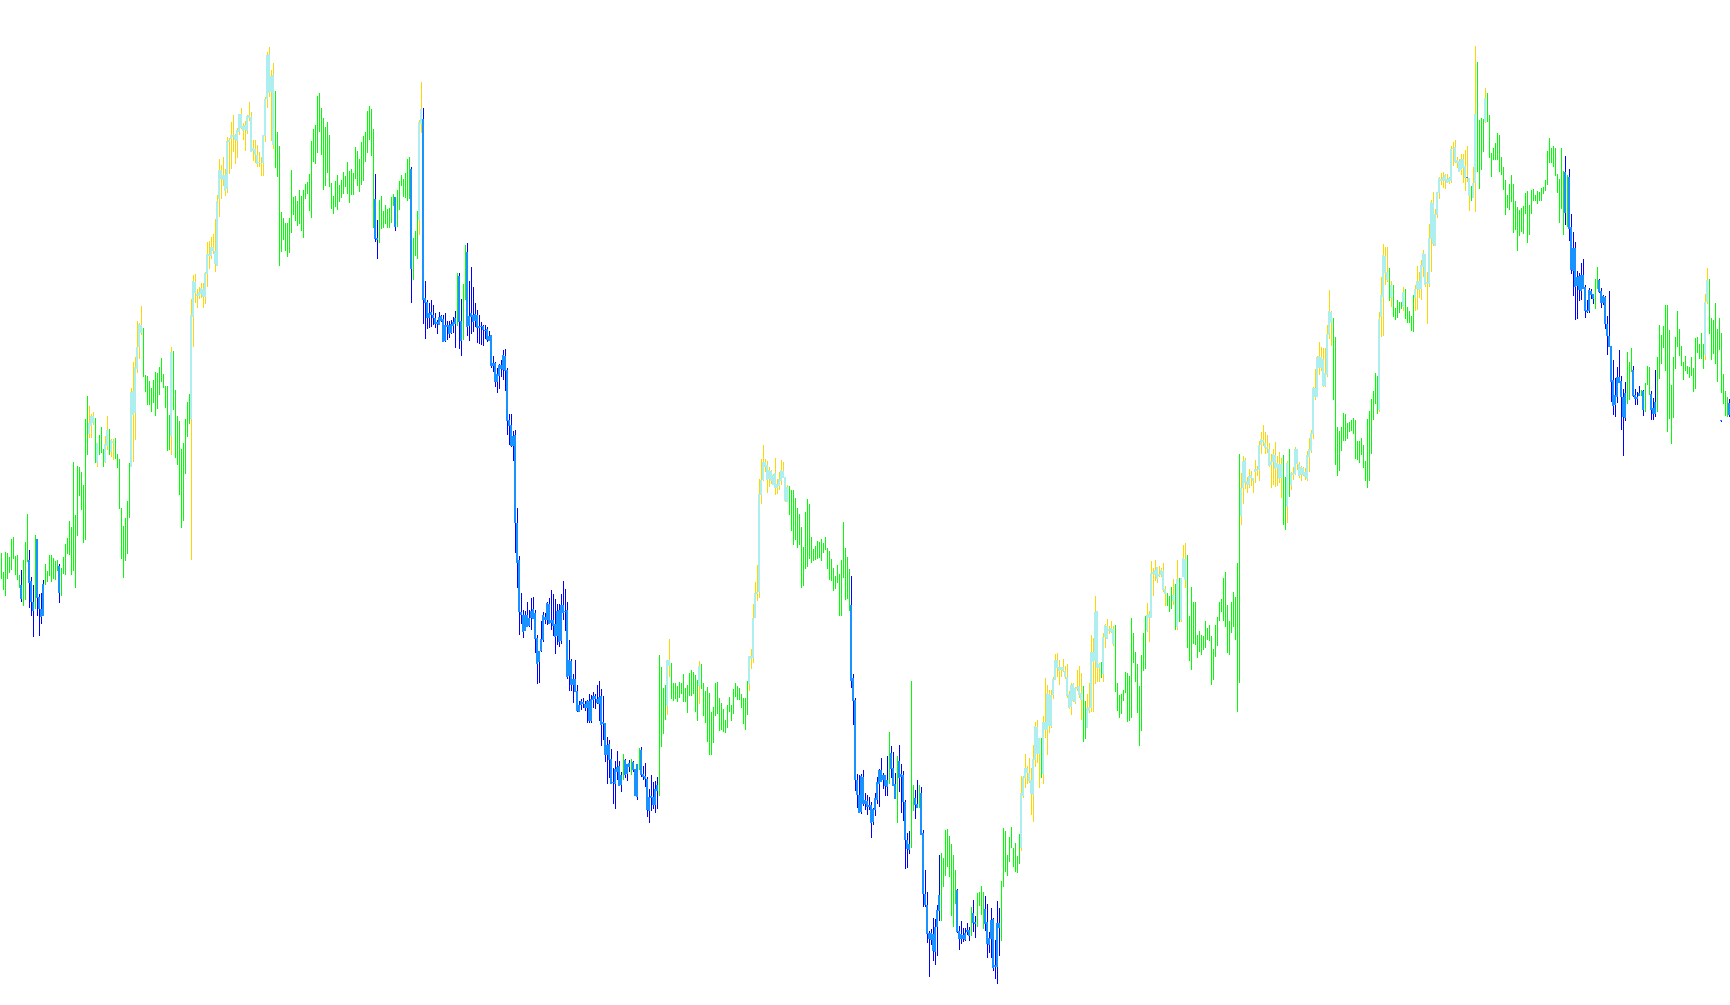
This script functions as a specialized visual tool for MetaTrader platforms, designed to provide traders with a clear, high-contrast overview of market momentum by overlaying a specific type of price action analysis onto the standard chart.
Core Concept
The primary purpose of this tool is to highlight "extreme" market conditions based on the Williams %R (WPR) indicator. Rather than simply showing you a separate line graph for the WPR, this script translates those mathematical values into visual cues directly on the price candles. It serves as an immediate alert system that identifies when the market is reaching overbought or oversold territory.
How the Logic Works
The script processes every candle on your chart and applies the following logic:
- Momentum Monitoring: The tool constantly calculates the Williams %R value based on a user-defined timeframe (the "Period"). This indicator measures whether the current price is at the top or bottom of its recent range.
- Threshold Detection: You can set specific boundaries for what constitutes an "overbought" and "oversold" state. The script looks for the price to push beyond these limits.
- Dynamic Visual Feedback: When the market hits these extreme zones, the script automatically changes the visual representation of the candles:
- Overbought Signals: If the momentum exceeds your upper limit, the script triggers a visual change (indicated by green highlights) to alert you that the market may be overextended to the upside.
- Oversold Signals: If the momentum falls below your lower limit, the script triggers a different visual change (indicated by red highlights) to signal that the market may be overextended to the downside.
User Experience
For the trader, this means you don't have to constantly toggle between different windows or squint at complex lines to find potential reversal points. The "WPR Candles" do the heavy lifting by scanning the data in the background and instantly "painting" the chart to show you exactly where the market is showing signs of exhaustion or extreme strength.
By integrating this logic, you get a streamlined trading environment where historical price action and momentum extremes are merged into a single, easy-to-read visual format.
//+------------------------------------------------------------------+
//|                                                  WPR Candles.mq4 |
//|                                                 Modified by cja. |
//+------------------------------------------------------------------+

#property copyright "Copyright © 2007, Christof Risch (iya)"
#property link      "http://www.forexfactory.com/showthread.php?t=13321"
#property indicator_chart_window
#property indicator_buffers 4
#property indicator_color1 Green//wick
#property indicator_color2 Red//wick
#property indicator_color3 Green//candle
#property indicator_color4 Red//candle
#property indicator_width1 1
#property indicator_width2 1
#property indicator_width3 3
#property indicator_width4 3


//---- stoch settings
extern int	WPR_Period		= 50;

extern int	Overbought		= -20;
extern int	Oversold			= -80;

//---- input parameters
extern int	BarWidth			= 1,
				CandleWidth		= 3;

//---- buffers
double Bar1[],
		 Bar2[],
		 Candle1[],
		 Candle2[];


//+------------------------------------------------------------------+
//| Custom indicator initialization function                         |
//+------------------------------------------------------------------+
int init()
{
//---- indicators
	IndicatorShortName("WPR Candles:("+	WPR_Period+")");
	IndicatorBuffers(4);
	SetIndexBuffer(0,Bar1);
	SetIndexBuffer(1,Bar2);
	SetIndexBuffer(2,Candle1);
	SetIndexBuffer(3,Candle2);
	SetIndexStyle(0,DRAW_HISTOGRAM,0,BarWidth);
	SetIndexStyle(1,DRAW_HISTOGRAM,0,BarWidth);
	SetIndexStyle(2,DRAW_HISTOGRAM,0,CandleWidth);
	SetIndexStyle(3,DRAW_HISTOGRAM,0,CandleWidth);

	return(0);
}

//+------------------------------------------------------------------+
double WPR  	(int i = 0)	{return(iWPR(NULL,0,WPR_Period,i));}


//+------------------------------------------------------------------+
void SetCandleColor(int col, int i)
{
	double high,low,bodyHigh,bodyLow;


	{
		bodyHigh = MathMax(Open[i],Close[i]);
		bodyLow  = MathMin(Open[i],Close[i]);
		high		= High[i];
		low		= Low[i];
	}

	Bar1[i] = low;	Candle1[i] = bodyLow;
	Bar2[i] = low;	Candle2[i] = bodyLow;


	switch(col)
	{
		case 1: 	Bar1[i] = high;	Candle1[i] = bodyHigh;	break;
		case 2: 	Bar2[i] = high;	Candle2[i] = bodyHigh;	break;

	}
}

//+------------------------------------------------------------------+
//| Custom indicator iteration function                              |
//+------------------------------------------------------------------+
int start()
{
	for(int i = MathMax(Bars-1-IndicatorCounted(),1); i>=0; i--)
	{
		double	wpr	= WPR(i);


				if(wpr > Overbought)		SetCandleColor(1,i);
		else	if(wpr < Oversold)		SetCandleColor(2,i);

	}


	return(0);
}
//+------------------------------------------------------------------+
Comments