Woodies Pivots Modified Into Fib Pivots
Download script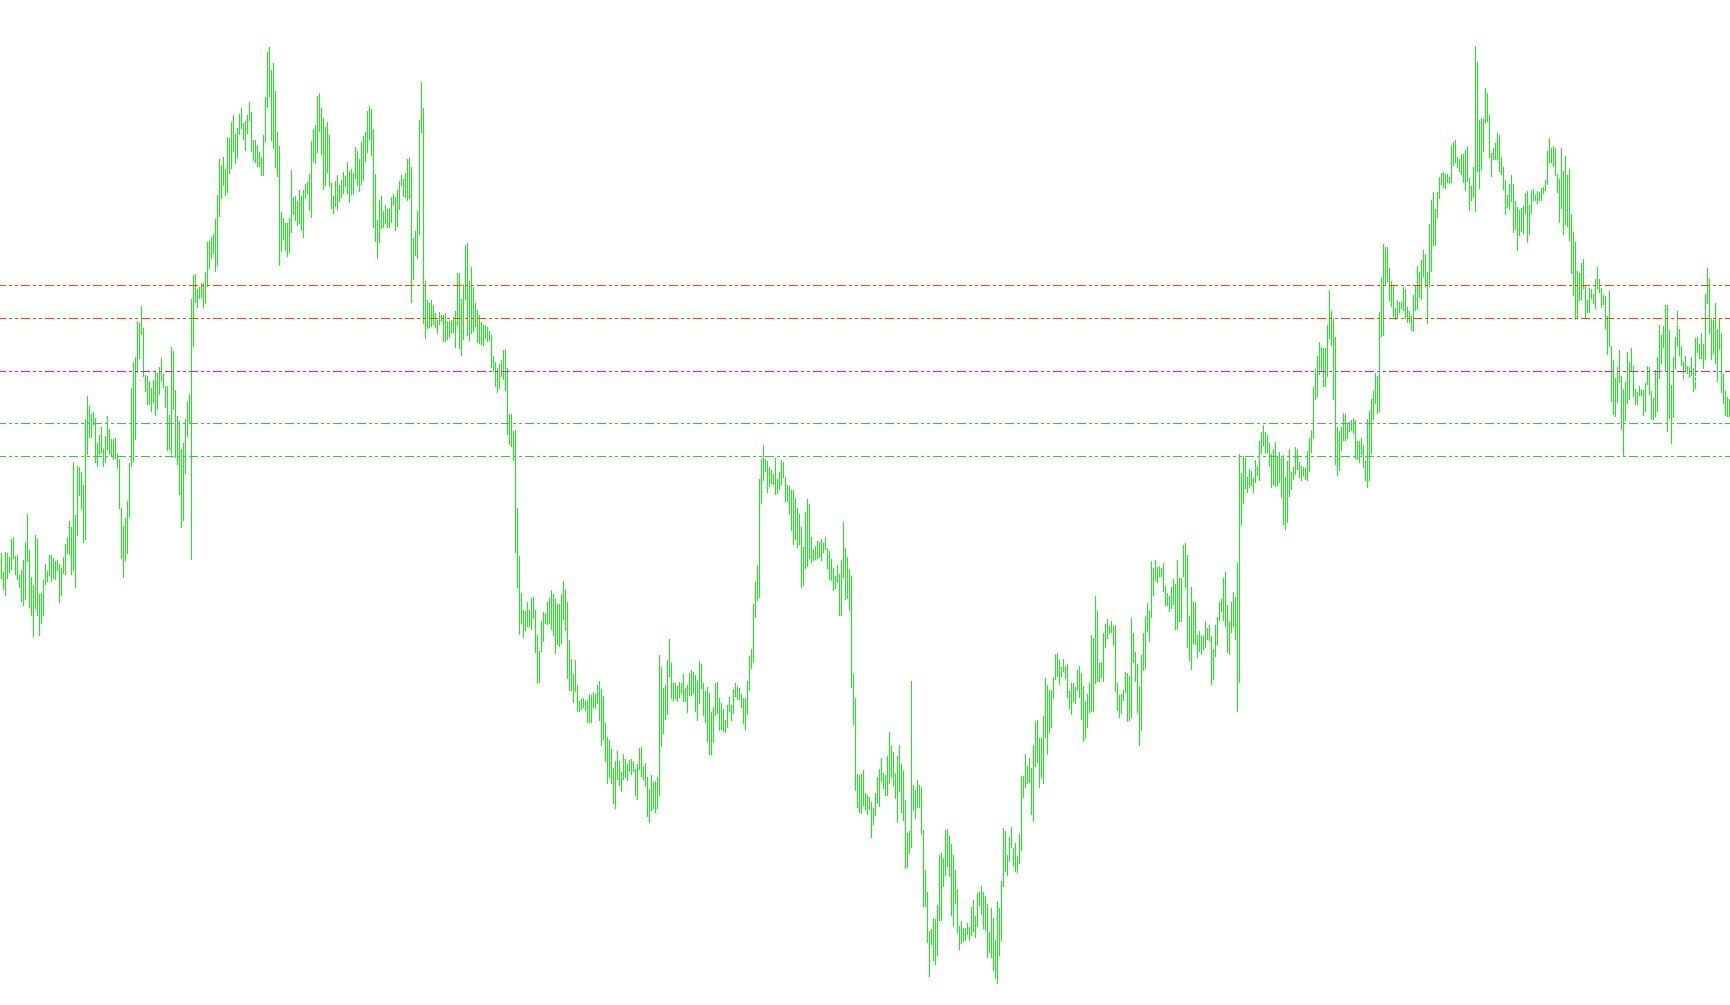
This script is designed to automatically calculate and plot specific price levels on your trading chart, helping traders identify key areas of support and resistance based on previous market activity. By blending traditional "Pivot Point" logic with Fibonacci-style ratios, it provides a structured roadmap for where the price might react during the current trading session.
How the Logic Works
1. Data Collection The script begins by scanning the previous day's market data. It specifically looks for four key pieces of information from the completed daily candle:
- The highest price reached (High)
- The lowest price reached (Low)
- The closing price (Close)
- The opening price (Open)
2. Core Calculations Once it has this data, the script performs a series of mathematical steps to determine five specific levels:
- The Pivot Point (P): This is the central balance point. It is calculated by taking the average of yesterday's high, low, and closing prices. This acts as the "anchor" for the day’s price action.
- The Range: The script calculates the total distance between yesterday’s high and low to determine the market's volatility for that period.
- Support and Resistance (Fibonacci Style): Instead of using standard increments, the script applies specific percentages (38% and 62%) of yesterday's range to the central Pivot Point.
- Resistance Levels (R1 & R2): These are projected above the Pivot Point. They represent areas where upward momentum might exhaust, potentially leading to a price pullback or reversal.
- Support Levels (S1 & S2): These are projected below the Pivot Point. They represent "floors" where the price might find buying interest and bounce back up.
3. Visual Representation After calculating these values, the script automatically draws them onto your chart so you don't have to do any manual math:
- Horizontal Lines: It draws dashed lines across the chart for each level. To make it easy to read at a glance, the script color-codes these lines (e.g., different colors for Support vs. Resistance).
- Labels: The script places text labels next to these lines (such as "Fib R1" or "Pivot") so you can instantly identify which level is which without clicking on them.
Key Usage Requirements
To ensure the logic functions correctly, the script requires a timeframe of one day or less (e.g., 1-hour, 15-minute, etc.). If a larger timeframe is used, the script will provide an error message because it relies on daily price fluctuations to generate its calculations.
/*-----------------------------+
|			       |
| Shared by www.Aptrafx.com    |
|			       |
+------------------------------*/

//+------------------------------------------------------------------+
//| Woodies Pivots Modified Into Fib Pivots|
//+------------------------------------------------------------------+
// Modified by Lee for http://www.forexrate.co.uk
// Drag script to chart to install
// Don't forget redo this each new day

// Modify to your hearts content
// All improvements and new variations will be appreciated
//

int start()
{
//---- initialize local variables

double R=0;
double day_high=0;
double day_low=0;
double yesterday_high=0;
double yesterday_open=0;
double yesterday_low=0;
double yesterday_close=0;
double today_open=0;
double r2=0;
double r1=0;
double p=0;
double s1=0;
double s2=0;
double rates_d1[2][6];

//---- exit if period is greater than daily charts
if(Period() > 1440)
{
Print("Error - Chart period is greater than 1 day.");
return(-1); // then exit
}

//---- Get new daily prices

ArrayCopyRates(rates_d1, Symbol(), PERIOD_D1);

yesterday_close = rates_d1[1][4];
yesterday_open = rates_d1[1][1];
today_open = rates_d1[0][1];
yesterday_high = rates_d1[1][3];
yesterday_low = rates_d1[1][2];


//---- Calculate Pivots
R = yesterday_high - yesterday_low;//range
p = (yesterday_high + yesterday_low + yesterday_close)/3;// Standard Pivot
r1 = p + (R * 0.38);
r2 = p + (R * 0.62);
s1 = p - (R * 0.38);
s2 = p - (R * 0.62);


//---- Set line labels on chart window

if(ObjectFind("R1 label") != 0)
{
ObjectCreate("R1 label", OBJ_TEXT, 0, Time[20], r1);
ObjectSetText("R1 label", "Fib R1", 8, "Arial", White);
}
else
{
ObjectMove("R1 label", 0, Time[20], r1);
}

if(ObjectFind("R2 label") != 0)
{
ObjectCreate("R2 label", OBJ_TEXT, 0, Time[20], r2);
ObjectSetText("R2 label", "Fib R2", 8, "Arial", White);
}
else
{
ObjectMove("R2 label", 0, Time[20], r2);
}

if(ObjectFind("P label") != 0)
{
ObjectCreate("P label", OBJ_TEXT, 0, Time[20], p);
ObjectSetText("P label", "Pivot", 8, "Arial", White);
}
else
{
ObjectMove("P label", 0, Time[20], p);
}

if(ObjectFind("S1 label") != 0)
{
ObjectCreate("S1 label", OBJ_TEXT, 0, Time[20], s1);
ObjectSetText("S1 label", "Fib S1", 8, "Arial", White);
}
else
{
ObjectMove("S1 label", 0, Time[20], s1);
}

if(ObjectFind("S2 label") != 0)
{
ObjectCreate("S2 label", OBJ_TEXT, 0, Time[20], s2);
ObjectSetText("S2 label", "Fib S2", 8, "Arial", White);
}
else
{
ObjectMove("S2 label", 0, Time[20], s2);
}

//---- Set lines on chart window

if(ObjectFind("S1 line") != 0)
{
ObjectCreate("S1 line", OBJ_HLINE, 0, Time[40], s1);
ObjectSet("S1 line", OBJPROP_STYLE, STYLE_DASHDOTDOT);
ObjectSet("S1 line", OBJPROP_COLOR, LimeGreen);
}
else
{
ObjectMove("S1 line", 0, Time[40], s1);
}

if(ObjectFind("S2 line") != 0)
{
ObjectCreate("S2 line", OBJ_HLINE, 0, Time[40], s2);
ObjectSet("S2 line", OBJPROP_STYLE, STYLE_DASHDOTDOT);
ObjectSet("S2 line", OBJPROP_COLOR, LimeGreen);
}
else
{
ObjectMove("S2 line", 0, Time[40], s2);
}

if(ObjectFind("P line") != 0)
{
ObjectCreate("P line", OBJ_HLINE, 0, Time[40], p);
ObjectSet("P line", OBJPROP_STYLE, STYLE_DASHDOTDOT);
ObjectSet("P line", OBJPROP_COLOR, Magenta);
}
else
{
ObjectMove("P line", 0, Time[40], p);
}

if(ObjectFind("R1 line") != 0)
{
ObjectCreate("R1 line", OBJ_HLINE, 0, Time[40], r1);
ObjectSet("R1 line", OBJPROP_STYLE, STYLE_DASHDOTDOT);
ObjectSet("R1 line", OBJPROP_COLOR, OrangeRed);
}
else
{
ObjectMove("R1 line", 0, Time[40], r1);
}

if(ObjectFind("R2 line") != 0)
{
ObjectCreate("R2 line", OBJ_HLINE, 0, Time[40], r2);
ObjectSet("R2 line", OBJPROP_STYLE, STYLE_DASHDOTDOT);
ObjectSet("R2 line", OBJPROP_COLOR, OrangeRed);
}
else
{
ObjectMove("R2 line", 0, Time[40], r2);
}


//---- done
return(0);
}

//+------------------------------------------------------------------+
Comments