xMeterMTF1
Indicator

xMeterMTF1

This indicator quantifies the relative purchasing power of major currencies by aggregating price action ratios and high-low ranges across multiple currency pairs to visualize aggregate market sentiment.
xMeterMTF_Ind
Indicator

xMeterMTF_Ind

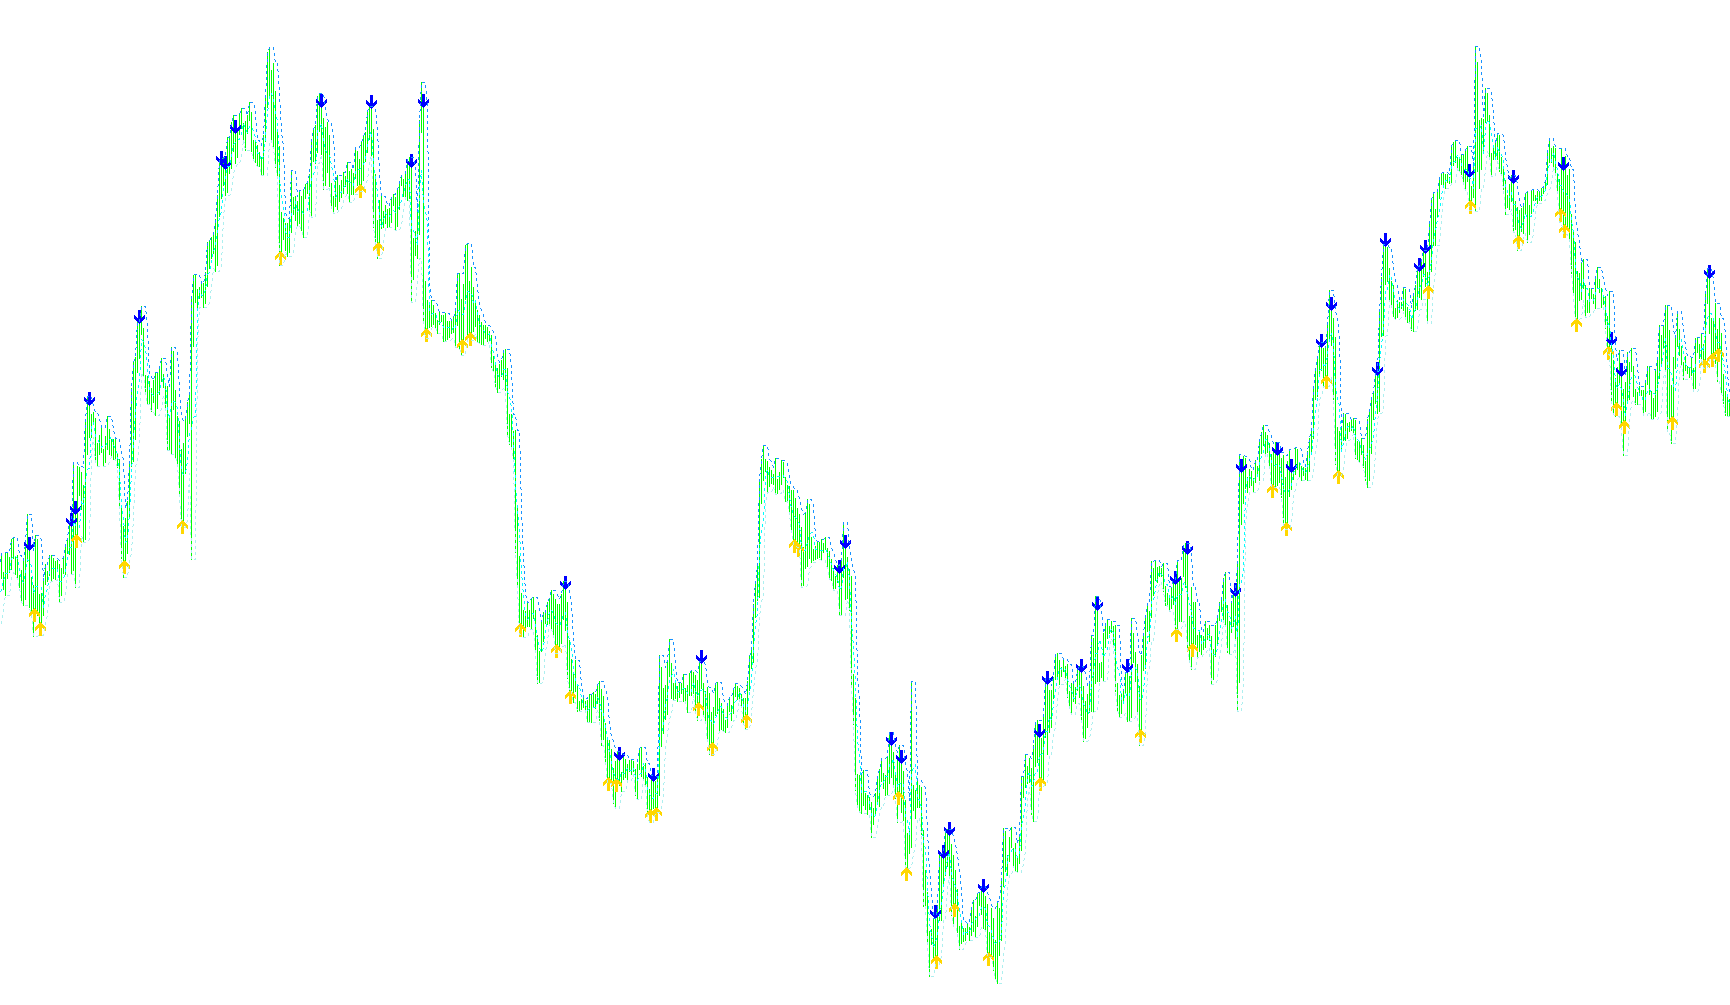
This indicator calculates the relative momentum and dominance of major currencies by aggregating the percentage-based range positions of multiple currency pairs into a unified strength metric.

Indicator

xMeter_Indicator2

xMeter_mini_v1_2
Indicator

xMeter_mini_v1_2

This system quantifies real-time currency strength by calculating the weighted relative position of multiple major pairs against their daily price ranges to provide a visual heat map of market dominance.

Indicator

XO 4TF score

XO with Alert
Indicator

XO with Alert

This indicator identifies dynamic trend reversals by monitoring sequential price breaches beyond a variable volatility-based threshold to capture momentum shifts.

XO
Indicator

XO

This indicator identifies sustained price momentum by tracking successive breaches of expanding volatility boundaries to signal trend strength.

XOAtr
Indicator

XOAtr

iATR

This indicator tracks momentum by measuring price breaches beyond ATR-adjusted thresholds, accumulating directional intensity as a histogram.

XO_003
Indicator

XO_003

The indicator tracks sequential price breakouts beyond a variable point threshold to quantify the momentum of continuous trend extensions.

Indicator

XO_5

Indicator

XO_5_v1

XO_Alert
Indicator

XO_Alert

The algorithm triggers alerts by identifying synchronized bullish or bearish signals across the 5-minute, 15-minute, 30-minute, and 60-minute timeframes simultaneously.

XO_ALERT_cci_cross
Indicator

XO_ALERT_cci_cross

iCCI

This algorithm identifies high-probability entries by synchronizing bullish and bearish signal states across four distinct timeframes before confirming the trade via a Commodity Channel Index zero-line crossover.

XO_ALERT_cci_cross_v1
Indicator

XO_ALERT_cci_cross_v1

iCCI

This logic identifies high-probability trade entries by detecting simultaneous bullish or bearish signal synchronization across the 5, 15, 30, and 60-minute timeframes while filtering for specific CCI momentum crossovers.

XO_ALERT_cci_cross_v2
Indicator

XO_ALERT_cci_cross_v2

iCCI

This logic identifies bullish or bearish entries by detecting synchronized multi-timeframe signal activations across 5, 15, 30, and 60-minute intervals, validated by a CCI zero-level crossover.

XO_A_H
Indicator

XO_A_H

This indicator quantifies market volatility by counting sequential price breaches of predefined fixed-point threshold zones to visualize aggressive trend persistence.

XO_v1
Indicator

XO_v1

This indicator quantifies sequential price momentum by tracking consecutive breaches of expanding dynamic price boundaries to identify sustained trend exhaustion or acceleration.

XO_v3
Indicator

XO_v3

This indicator identifies sequential price movements by tracking consecutive breaches of expanding point-based thresholds to highlight momentum shifts.

XPeriod
Indicator

XPeriod

This indicator synchronizes and visualizes candle structures from diverse timeframes onto a single chart window using geometric rectangle plotting.

xPivotMultiday-with-middle
Indicator

xPivotMultiday-with-middle

A comprehensive technical overlay that synchronizes historical daily pivot points, Fibonacci retracements, and Camarilla levels with real-time session tracking.

xPivotMultiday
Indicator

xPivotMultiday

This indicator projects synchronized daily pivot levels, Fibonacci retracements, and Camarilla breaks alongside historical high-low boundaries to identify key liquidity zones.

xpMA
Indicator

xpMA

iMAiMAOnArray

This indicator synthesizes diverse moving average methodologies, including TEMA and Jurik, to identify trend reversals via price displacement relative to a dynamic step-period mean.

xpMA_001
Indicator

xpMA_001

iMAiMAOnArray

This indicator identifies momentum shifts by comparing dynamic moving average values against a localized mean to generate visual directional signals and alerts.

xpMA_002
Indicator

xpMA_002

iMAiMAOnArray

This indicator synthesizes diverse moving average methodologies, including T3 and Jurik, to generate directional trend reversals via dynamic price comparison and automated visual signaling.

xpMA_004
Indicator

xpMA_004

iMAiMAOnArray

This indicator identifies trend reversals by comparing a user-selectable moving average (including TEMA, DEMA, and Jurik) against a secondary short-term mean to generate visual entry signals.

xpMA_mod
Indicator

xpMA_mod

iMAiMAOnArray

This indicator identifies trend reversals by comparing price action against a customizable array of advanced moving averages, triggering visual signals when the current value crosses a localized mean threshold.

xpMA_tail
Indicator

xpMA_tail

This indicator detects momentum shifts by comparing price action against a dynamic average of external source data, triggering visual signals and alerts when price breaches a calculated step-period threshold.

xpMA_v1
Indicator

xpMA_v1

iMAiMAOnArray

This indicator calculates advanced moving averages including DEMA, TEMA, and T3 models to visualize directional price momentum via dynamic color-coded trend shifts.

xpMA_v2
Indicator

xpMA_v2

iMAiMAOnArray

This indicator synthesizes multiple moving average methodologies, including DEMA, TEMA, and T3, to visualize directional velocity through dynamic trend-following buffers.

xpMA_v2FATL
Indicator

xpMA_v2FATL

iMAiMAOnArray

This indicator calculates diverse moving average methodologies including DEMA, TEMA, T3, Jurik, and FATL to visualize price momentum shifts and directional trend reversals through dynamic buffer plotting.

xpMA_v2JMA
Indicator

xpMA_v2JMA

iMAiMAOnArray

This indicator dynamically computes diverse moving average types, including Jurik and T3, to visualize directional momentum shifts through comparative price trajectory analysis.

xpMA_v2SATL
Indicator

xpMA_v2SATL

iMAiMAOnArray

This indicator computes various advanced moving average types, including DEMA, T3MA, and JMA, to visualize directional trend shifts via price velocity analysis.

xpMA_v2SATLm
Indicator

xpMA_v2SATLm

iMAiMAOnArray

This indicator synthesizes various complex moving average models, including T3, Jurik, and SATL, to visualize momentum shifts through directional trend coloring.

xpMA_v2_SATL_FATL
Indicator

xpMA_v2_SATL_FATL

iMAiMAOnArray

This indicator calculates a versatile array of moving averages, including complex variations like T3 and Jurik, to visualize price momentum shifts and directional trajectory.

xpMA_v2_SATL_FATL_T3
Indicator

xpMA_v2_SATL_FATL_T3

iMAiMAOnArray

A versatile technical indicator that synthesizes multiple moving average algorithms, including Jurik and T3, to visualize trend direction through directional shift detection.

xpMA_v3_modified
Indicator

xpMA_v3_modified

iMAiMAOnArray

This indicator synthesizes diverse moving average models including DEMA, TEMA, and T3 to identify trend shifts by comparing current values against a localized step-period mean.

xpMA_v4
Indicator

xpMA_v4

iMAiMAOnArray

This indicator identifies directional trend shifts by comparing multi-variant moving average values against a localized step-period mean to trigger momentum-based signals.

xpMA_v5
Indicator

xpMA_v5

iMAiMAOnArray

This indicator evaluates price action against various specialized moving average algorithms to generate visual reversal signals and trend shifts based on localized momentum deviations.

xpMA_With_Email_Alert
Indicator

xpMA_With_Email_Alert

iMAiMAOnArray

This indicator evaluates price action against various advanced moving average types and utilizes a local mean comparison to trigger directional trend shifts via visual markers and alerts.

XPoints
Indicator

XPoints

Identifies potential trend reversals by detecting specific price action patterns where candle bodies align with historical volatility ranges and geometric centers.

XprofuterDD
Indicator

XprofuterDD

iMAOnArray

This indicator quantifies price velocity by accumulating the sum of candle body deviations over a specific period to identify directional momentum.

XprofuterOverlay
Indicator

XprofuterOverlay

This indicator calculates and overlays a dynamic price projection by synthesizing current market closing prices with external momentum-based differential data.

xpVolume
Indicator

xpVolume

iMAOnArray

This indicator detects significant bullish expansion by identifying instances where the short-term volume moving average exceeds the long-term baseline by a specific numerical threshold.

xxx
Indicator

xxx

A foundational structural skeleton providing the core environment for custom multi-window indicator development in MetaTrader 4.

xxxxxxx
Indicator

xxxxxxx

iACiAO

This indicator visualizes price action dynamics by categorizing candles into bull/bear zones based on the synchronized directional momentum of the Accumulation and Oscillation components.

X_O_serg153xo
Indicator

X_O_serg153xo

This indicator dynamically projects price boundaries by identifying sequential high and low breaches to visualize structural expansion zones on the chart.
X_O_serg153_Test
Indicator

X_O_serg153_Test

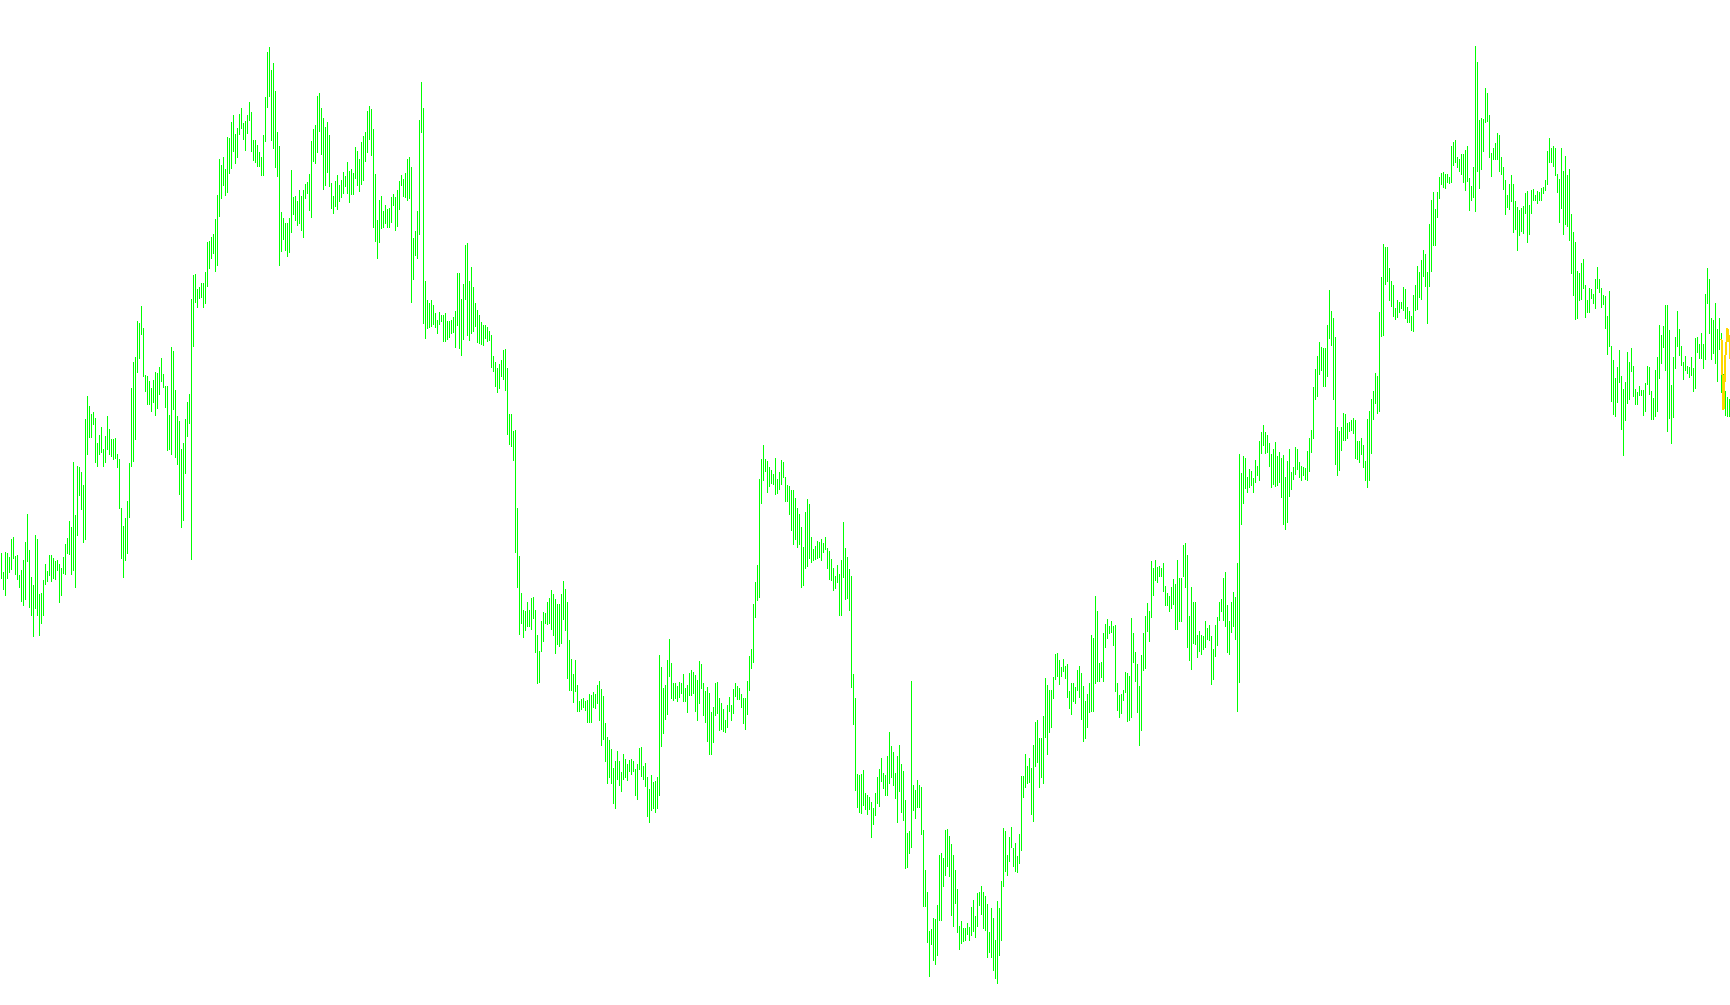
This indicator dynamically projects structural price rectangles by iterating through historical price extremes to identify recurring supply and demand equilibrium zones.

X_profile
Indicator

X_profile

iStdDev

The indicator calculates a running arithmetic mean of closing prices relative to a starting point and projects multi-level volatility bands based on standard deviation.

X_profile_v1
Indicator

X_profile_v1

iStdDev

The indicator calculates a running cumulative average of closing prices to generate dynamic price channels bounded by multiple standard deviation offsets.

x_v1
Indicator

x_v1

A foundational boilerplate structure providing the essential initialization and iteration hooks for developing custom MetaTrader4 visual indicators.