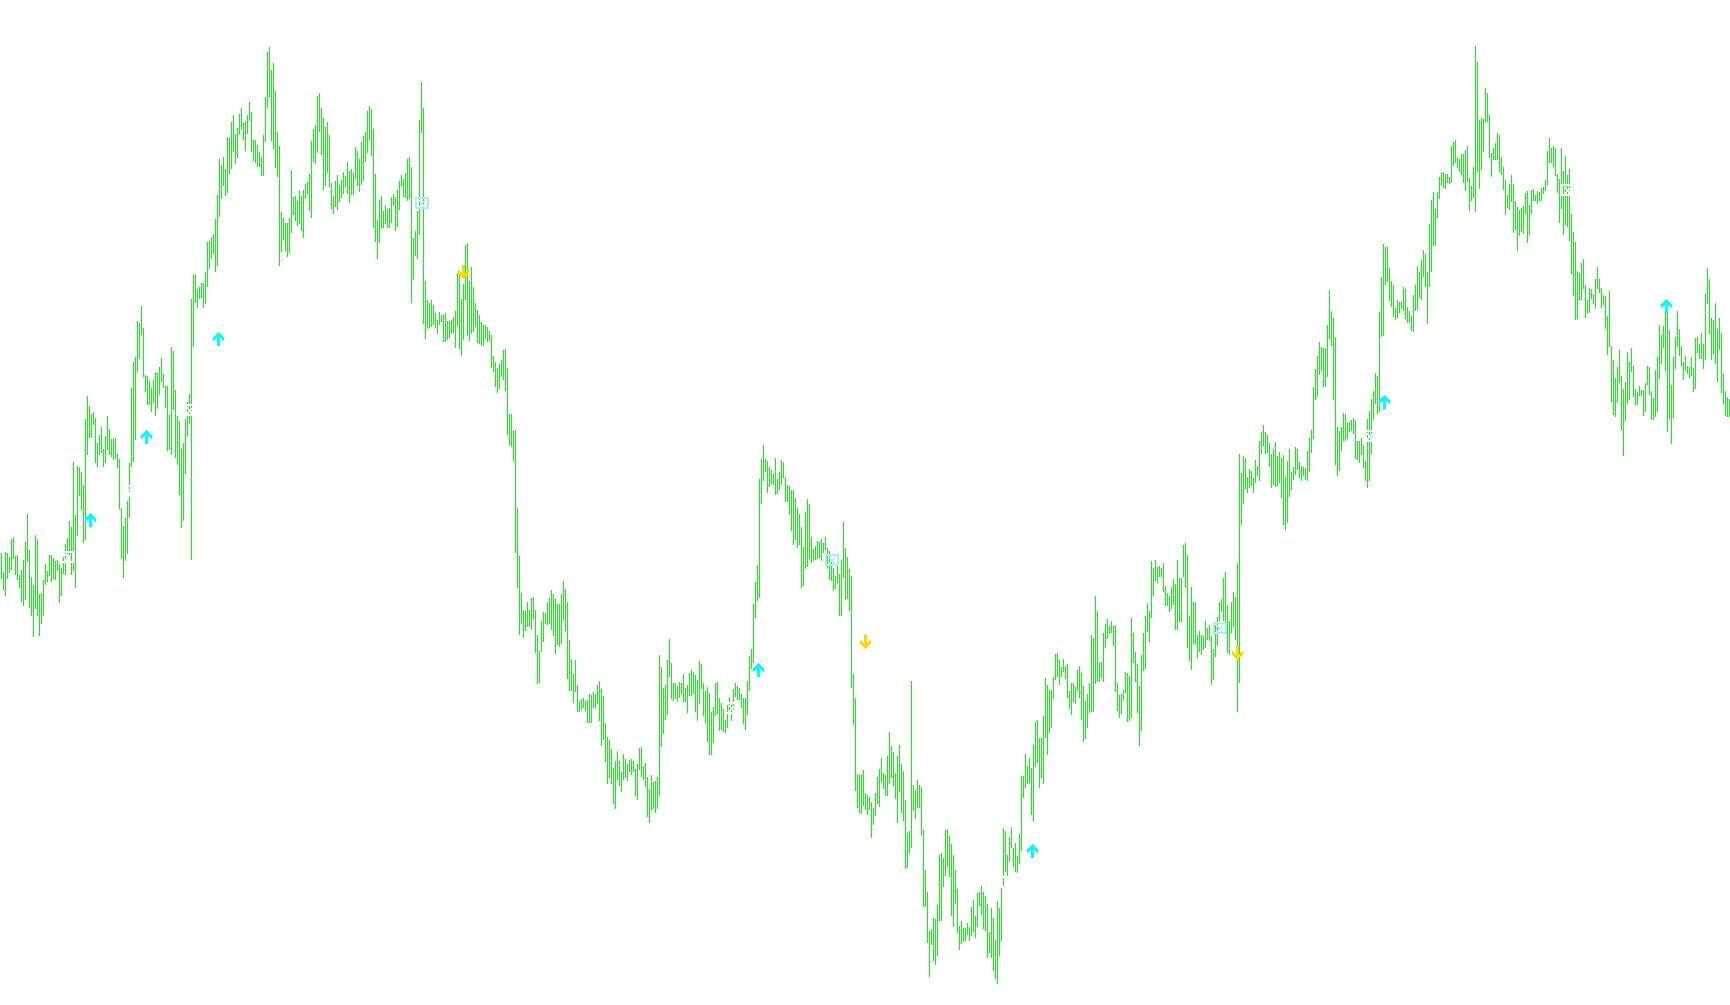
x_v2
Indicator

x_v2

iRSI

This indicator visualizes the Relative Strength Index (RSI) to evaluate price velocity and identify potential overextended market conditions.

Yaanna
Indicator

Yaanna

iBandsiMA

This indicator quantifies the relative percentage proximity of the current closing price within the spatial bounds defined by a dual Bollinger Band structure.

YaannaSignal
Indicator

YaannaSignal

iBandsiMA

This indicator identifies potential reversal points by calculating the percentage of price position relative to the Bollinger Bands range and monitoring for significant overextended movements.

YANSTEST 6wait
Indicator

YANSTEST 6wait

iMAiSAR

This indicator identifies high-probability trend reversals by synchronizing EMA crossover events with Parabolic SAR positional shifts and momentum filters.

YANSTEST 6wait_v1
Indicator

YANSTEST 6wait_v1

iMAiSAR

This indicator identifies high-probability momentum shifts by validating EMA crossovers and Parabolic SAR flips against specific trend duration thresholds.

YANS_IND2_01
Indicator

YANS_IND2_01

iMAiSAR

This indicator identifies trend reversal signals by detecting precise crossovers between the Parabolic SAR and 40-period EMA, validated by a trailing 10-period EMA momentum shift.

YANS_IND2_01_v1
Indicator

YANS_IND2_01_v1

iMAiSAR

This indicator identifies trend shifts by detecting Parabolic SAR crossovers relative to the EMA40, filtered by the proximity of the previous EMA10 intersection.

YANS_IND_04
Indicator

YANS_IND_04

iMAiSAR

This indicator identifies momentum shifts by synchronizing moving average crossovers with Parabolic SAR trend flips and proximity thresholds.

YANS_IND_04_v1
Indicator

YANS_IND_04_v1

iMAiSAR

This indicator identifies trend reversals and momentum shifts by synchronizing 10/40 Exponential Moving Average crossovers with Parabolic SAR flip dynamics and threshold proximity.

YearlyPivot-mids
Indicator

YearlyPivot-mids

Calculates yearly pivot levels and multi-stage support/resistance zones based on the preceding year's high, low, and closing price combined with the current year's opening data.

YearlyPivot
Indicator

YearlyPivot

This indicator calculates dynamic support and resistance levels by synthesizing the previous year's price extremes with the current year's opening liquidity.

YearlyPivot_001
Indicator

YearlyPivot_001

This indicator calculates and plots annual pivot points, support levels, and resistance zones by aggregating historical high, low, and closing price data from the previous calendar year.

Yearly_Pivots
Indicator

Yearly_Pivots

This indicator dynamically calculates and plots multi-layered annual pivot levels and mid-point resistance/support zones based on historical yearly high, low, and closing price data.

yefekt
Indicator

yefekt

This indicator quantifies price action intensity by calculating a relative ratio of current bar price ranges against a five-period cumulative volatility sum to visualize momentum shifts.

Yoni Yum
Indicator

Yoni Yum

iMAiMAOnArray

This indicator synthesizes a MACD trend filter with Ehlers' Fisher Transformation and stochastic modulation to eliminate signal noise and identify momentum shifts.

yourspace_ElliottWaveModel
Indicator

yourspace_ElliottWaveModel

A geometric charting tool that maps multi-degree Fibonacci retracements and sub-wave structures to visualize complex price cycles through user-defined anchor points.

Indicator

ytg_ Info

Indicator

ytg_ Information

ytg_1
Indicator

ytg_1

Automatically cycles through a sequence of decorative system fonts to display and refresh text labels on the chart canvas.

ytg_2
Indicator

ytg_2

This script dynamically updates a chart label by cycling through a ten-stage color palette based on the iterative count of processed bars.

ytg_Change_Price_Percent
Indicator

ytg_Change_Price_Percent

This indicator calculates and displays the real-time percentage variance between current bid prices and previous day's closing prices across four predefined assets.

Indicator

ytg_Day_candle

iIchimoku
ytg_Def_RSI
Indicator

ytg_Def_RSI

iMAOnArrayiRSI

This indicator calculates the spread between two Relative Strength Index values of differing periods and applies a moving average filter to the resulting delta.

ytg_Def_RSI_3_Symbol
Indicator

ytg_Def_RSI_3_Symbol

iMAOnArrayiRSI

This indicator calculates the smoothed difference between two distinct Relative Strength Index periods across three separate currency pairs to identify multi-symbol momentum correlations.

ytg_DveMashki_ind
Indicator

ytg_DveMashki_ind

iMA

This indicator visualizes the distance between two distinct moving averages using high-thickness histograms to identify trend strength and price momentum.

ytg_MA_Open_V0
Indicator

ytg_MA_Open_V0

iMA

This indicator detects potential reversal or trend entries by identifying specific price action patterns where the candle open breaks a dynamic threshold of the Moving Average while the low and high remain constrained within a defined proximity zone.

ytg_ObjectsDeleteAll
Indicator

ytg_ObjectsDeleteAll

Instantly clears all visual graphical elements and indicators from the active trading terminal window.

ytg_SS
Indicator

ytg_SS

This indicator identifies significant price breakouts by detecting when current highs or lows exceed the preceding twenty-four candle extremes, providing real-time auditory and visual notifications.

ytg_TF_RSI
Indicator

ytg_TF_RSI

iRSI

This indicator visualizes the relative strength index value and its directional delta across a customizable higher timeframe to identify overarching trend shifts.

ytg_Zodiac_V0
Indicator

ytg_Zodiac_V0

This indicator dynamically visualizes the current astrological period by highlighting specific zodiacal signatures based on the real-time calendar month and day.

YZCHMC_V1
Indicator

YZCHMC_V1

This indicator monitors real-time percentage fluctuations and group movements across multiple currency pairs simultaneously using an external configuration file.

Y_effect_m
Indicator

Y_effect_m

The algorithm calculates price expansion ratios by comparing current range dynamics against a five-period cumulative volatility sum to identify trend strength.

Z-Z1  LA  Best  Alert Next Bar  2
Indicator

Z-Z1 LA Best Alert Next Bar 2

This indicator identifies significant market structural pivot points by filtering historical price oscillations and triggering audible alerts on validated directional shifts.

Z-Z1  LA  Best  Alert Next Bar-m15
Indicator

Z-Z1 LA Best Alert Next Bar-m15

This indicator identifies significant structural price extremes by recursively filtering out minor fluctuations and marking primary directional pivots to signal trend exhaustion.

Z-Z1  NO ALERT
Indicator

Z-Z1 NO ALERT

The algorithm identifies structural market swings by filtering local extrema through a recursive backtracking mechanism to eliminate noise and isolate significant price pivots.

Z-Z1
Indicator

Z-Z1

This indicator identifies significant market structural reversals by iteratively filtering price extremes and detecting directional shifts between consecutive local peaks and troughs.

Z-Z1_001
Indicator

Z-Z1_001

The algorithm identifies local extrema by filtering price fluctuations through a depth-based deviation threshold and recursively pruning overlapping peaks to establish structural swing points.

Z-Z1_email
Indicator

Z-Z1_email

Identifies significant structural price swings by filtering local highs and lows through a recursive backtracking algorithm to isolate distinct trend reversals.

Z1
Indicator

Z1

This algorithm identifies significant market swing points by filtering local price extrema through a recursive depth-based volatility threshold and pruning redundant peaks.

ZAGI
Indicator

ZAGI

This indicator identifies significant price extremes by filtering local highs and lows through depth, deviation, and backstep parameters to map structural trend reversals.

Zee Zee i
Indicator

Zee Zee i

iMA

This indicator calculates price variance relative to a simple moving average by dividing the current typical price deviation by its historical standard deviation, highlighting extreme momentum extremes.

ZeroLAG MA
Indicator

ZeroLAG MA

iMAiMAOnArray

This indicator calculates a responsive moving average by offsetting the primary average against its own smoothed trajectory to minimize phase shift.

ZeroLag MACD Colored
Indicator

ZeroLag MACD Colored

iMAiMAOnArray

This indicator calculates a high-responsiveness MACD by applying a zero-lag compensation formula to exponential moving averages and visualizes trend reversals through color-coded histogram shifts.

ZeroLag MACD
Indicator

ZeroLag MACD

iMAiMAOnArray

This indicator calculates a momentum difference by applying an additive smoothing correction to both fast and slow exponential moving averages to eliminate standard lagging effects.

ZeroLag MACD_002
Indicator

ZeroLag MACD_002

iMAiMAOnArray

This indicator identifies trend shifts by calculating the difference between dual zero-lag exponential moving averages, which eliminate standard smoothing delays through recursive price feedback.

ZeroLag MACD_005
Indicator

ZeroLag MACD_005

iMAiMAOnArray

This indicator calculates price momentum by applying a recursive zero-lag formula to both the primary MACD histogram and its underlying signal line to eliminate smoothing delays.

ZeroLag MACD_v1
Indicator

ZeroLag MACD_v1

iMAiMAOnArray

This indicator eliminates signal latency by calculating the variance between double-weighted exponential averages to isolate immediate price velocity.

ZeroLag OsMA
Indicator

ZeroLag OsMA

This indicator quantifies market momentum by calculating the arithmetic difference between a ZeroLag MACD main line and its associated signal line to identify rapid price shifts.

ZeroLag Stochs_true
Indicator

ZeroLag Stochs_true

iMAOnArray

This indicator applies a dual-layer subtraction logic to standard stochastic calculations to eliminate price lag and provide instantaneous momentum sensitivity.

ZeroLag Tema 2
Indicator

ZeroLag Tema 2

iMA

This indicator synthesizes high-frequency trend identification by applying a zero-lag triple exponential moving average to both typical and Heiken-ashi price derivatives.