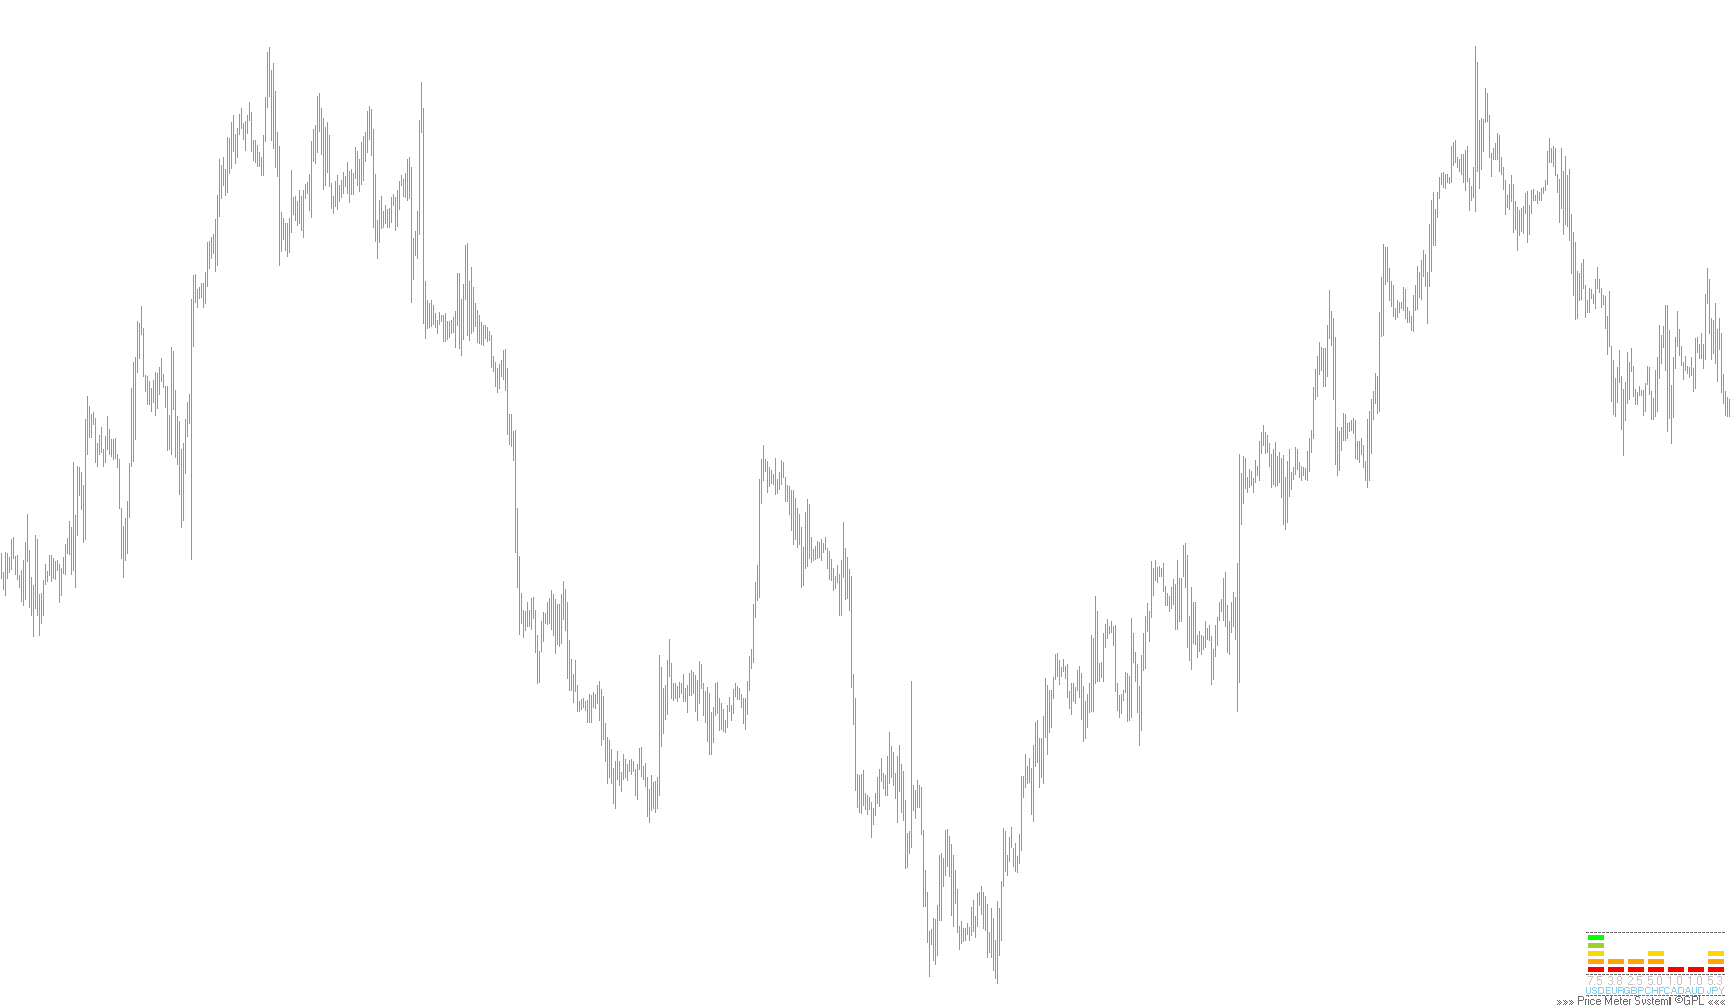
WPRSI_signal(SoundAlarm)
Indicator

WPRSI_signal(SoundAlarm)

iWPRiRSI

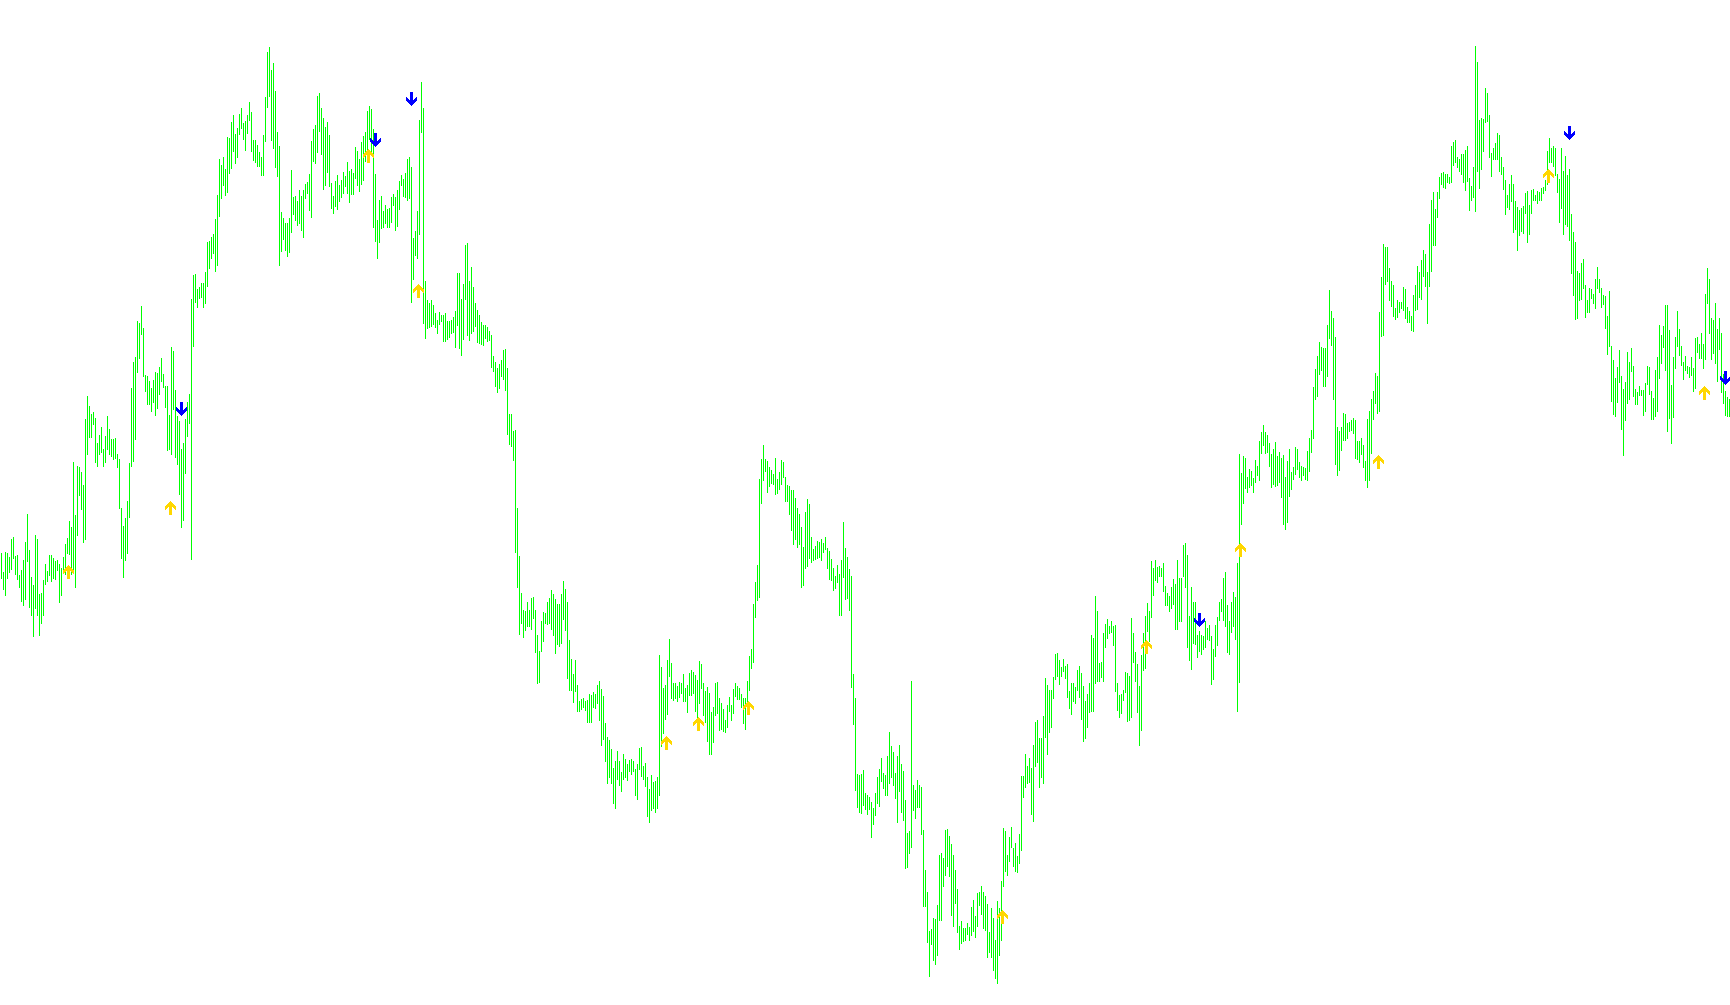
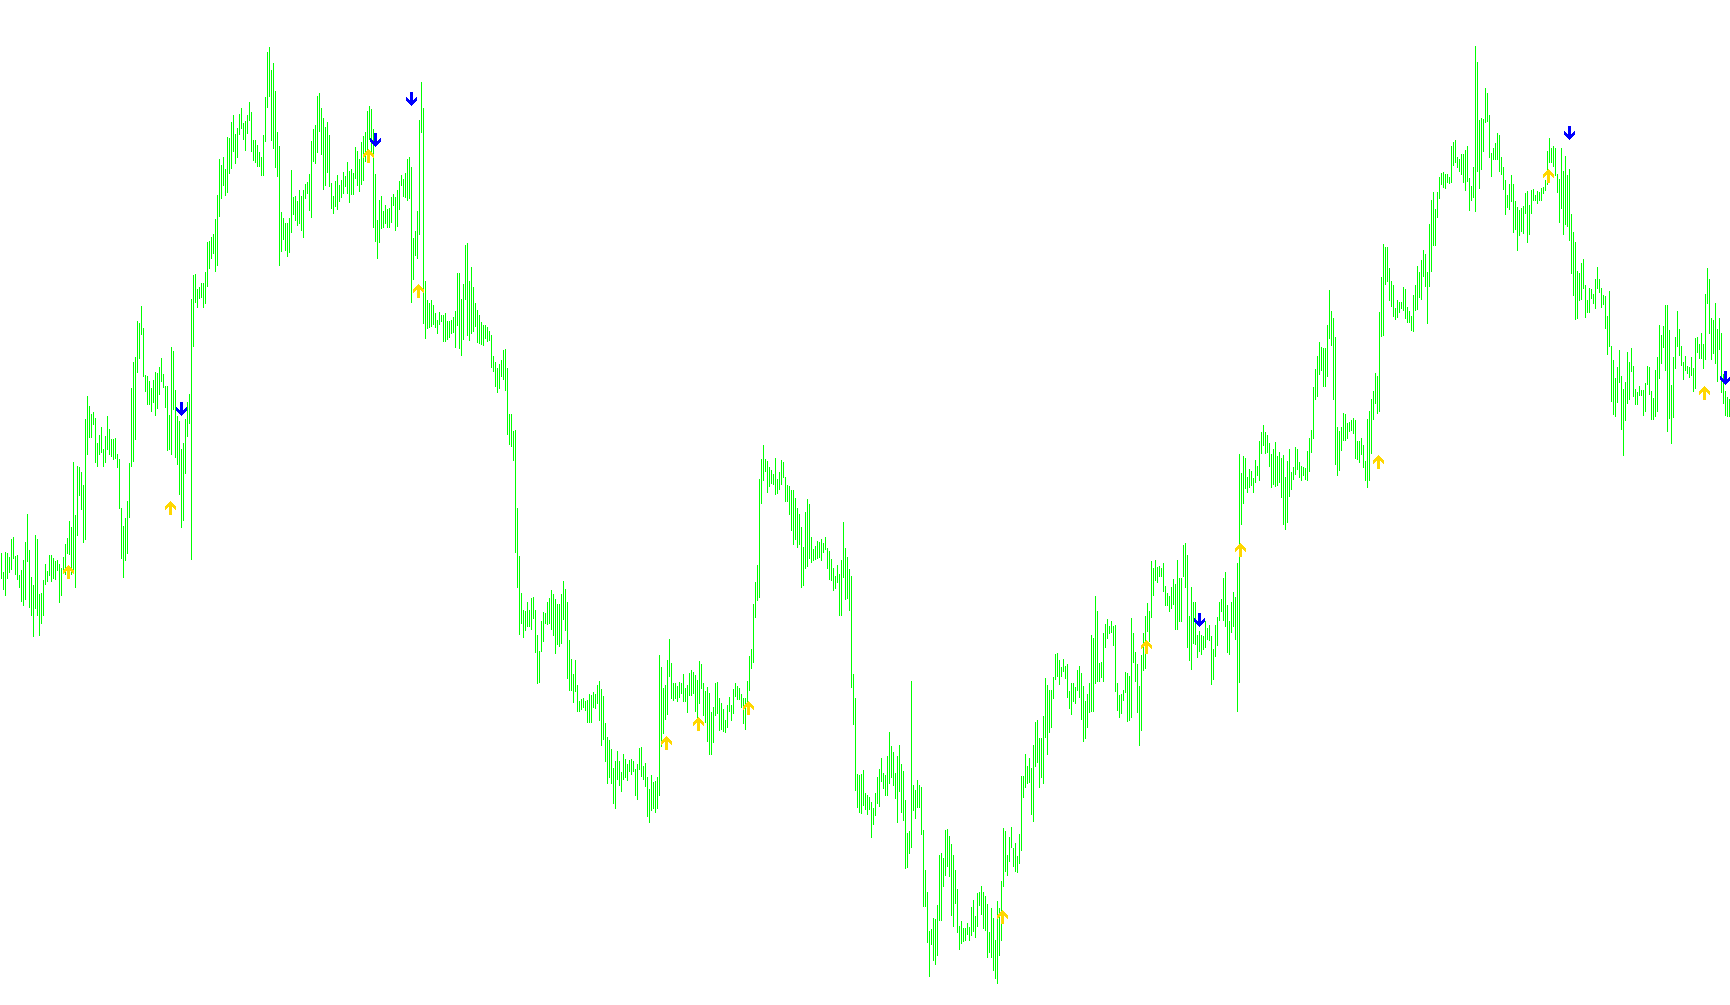
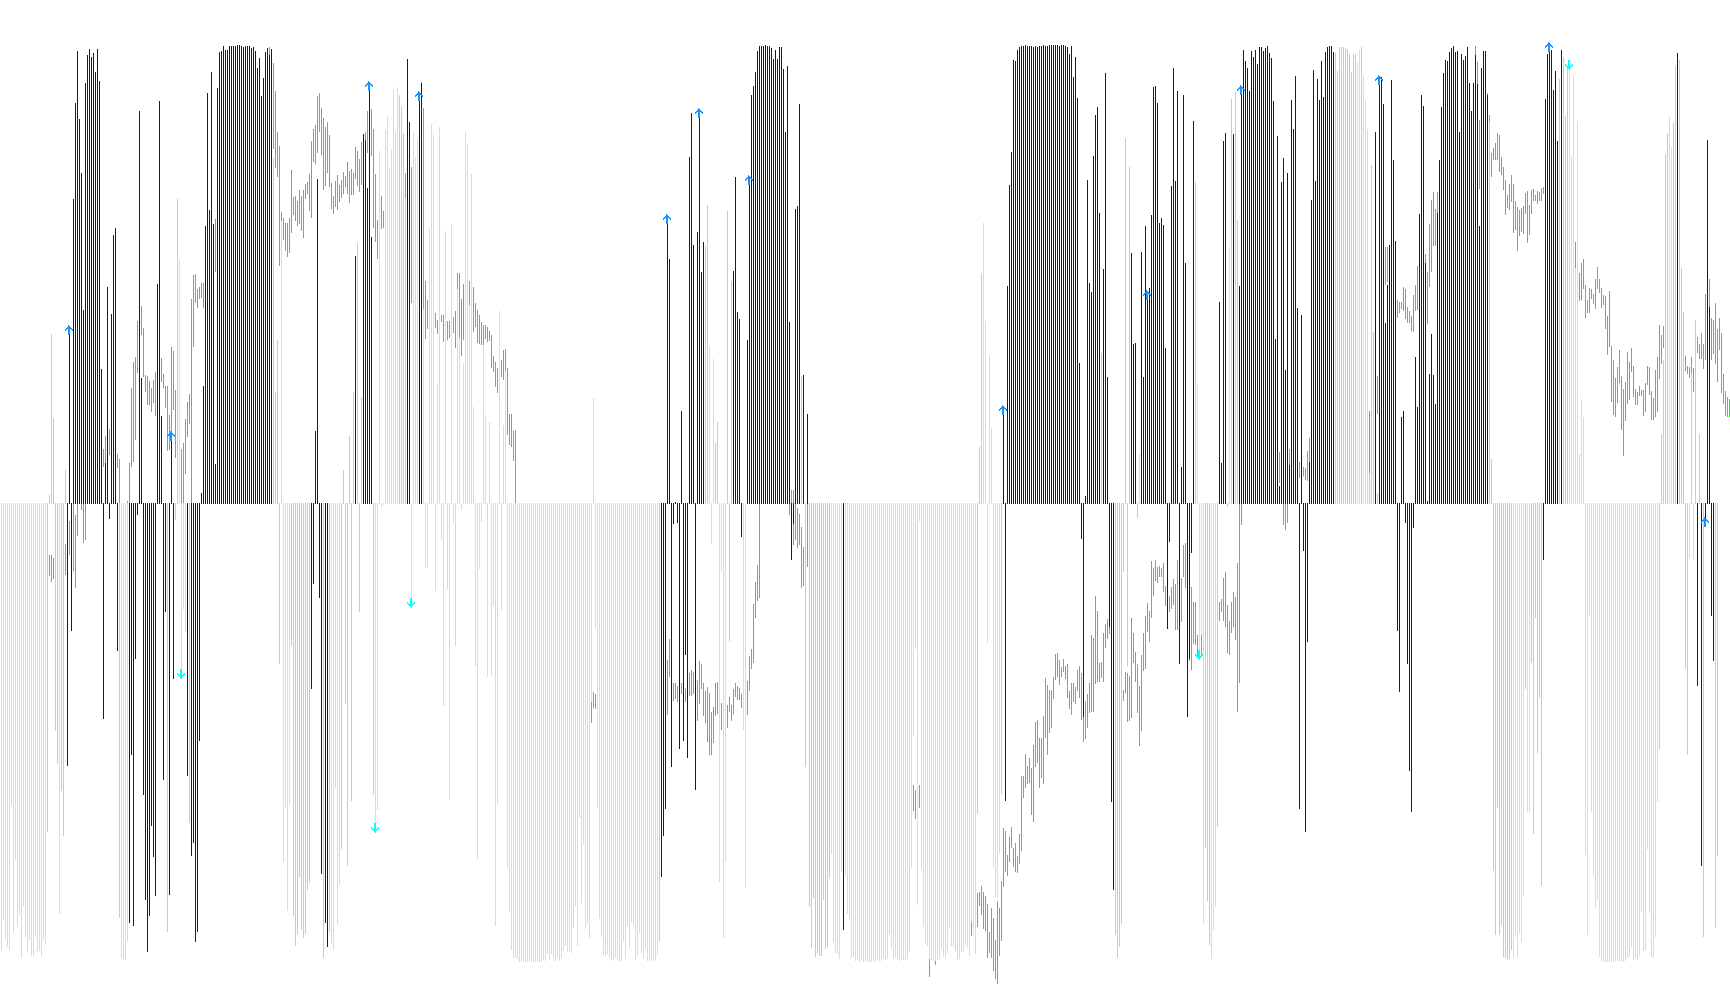
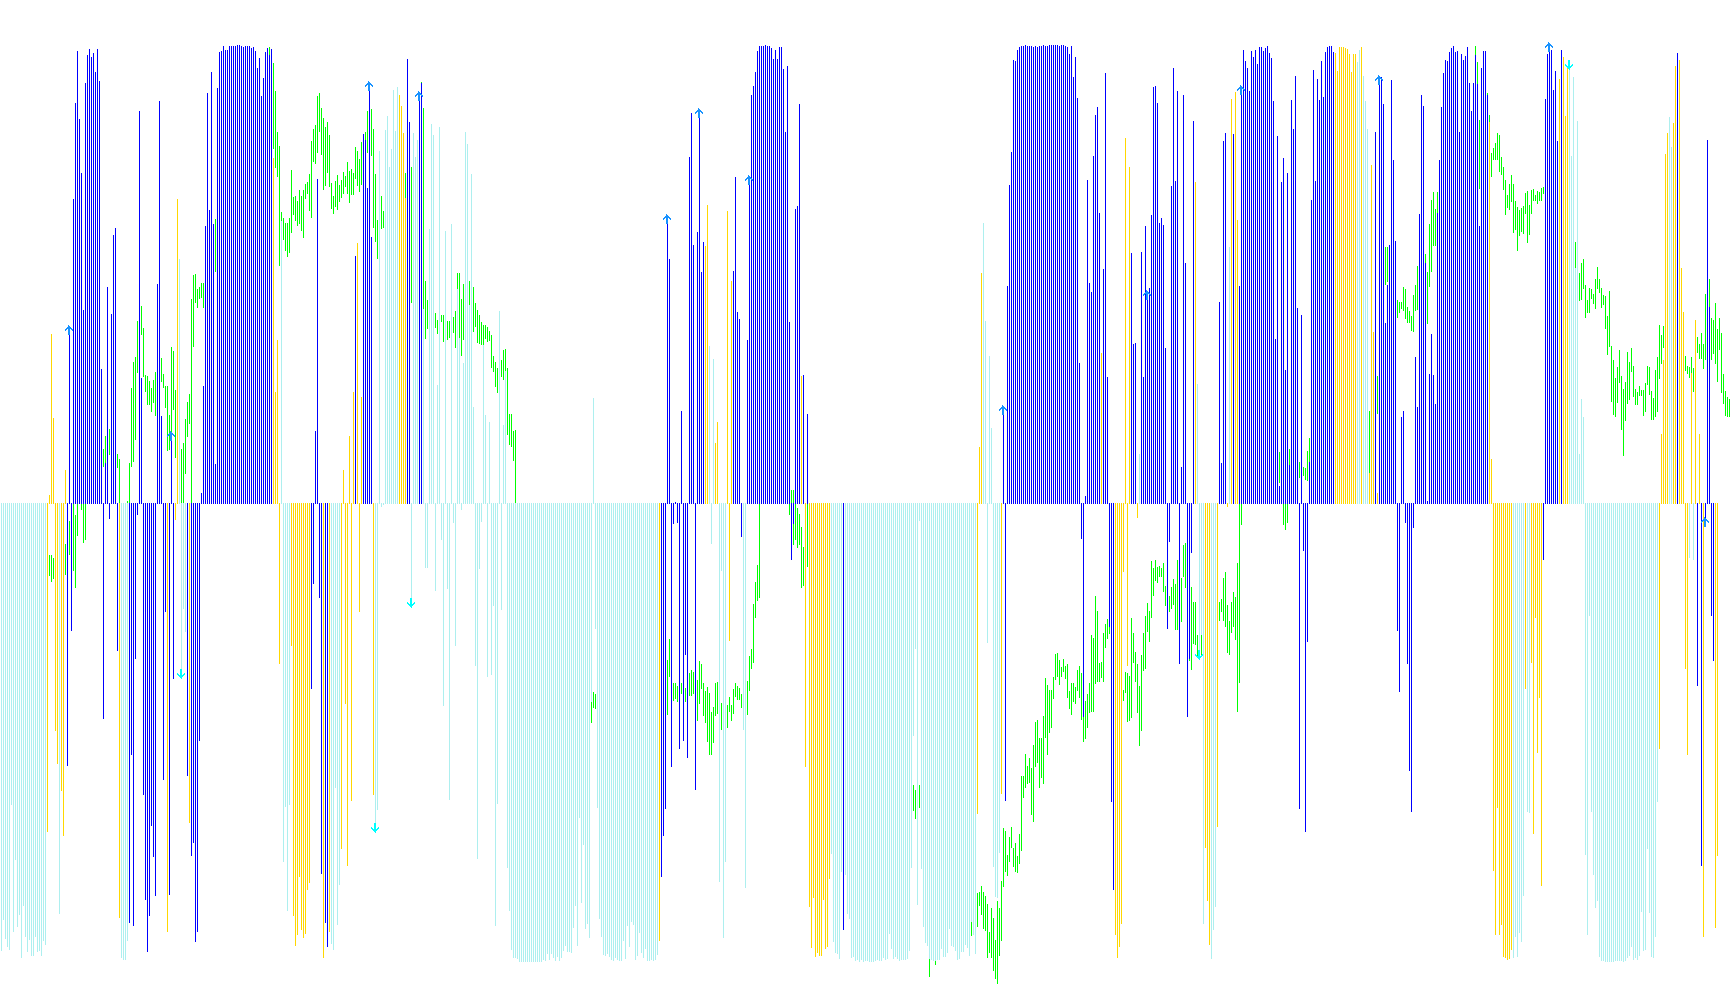
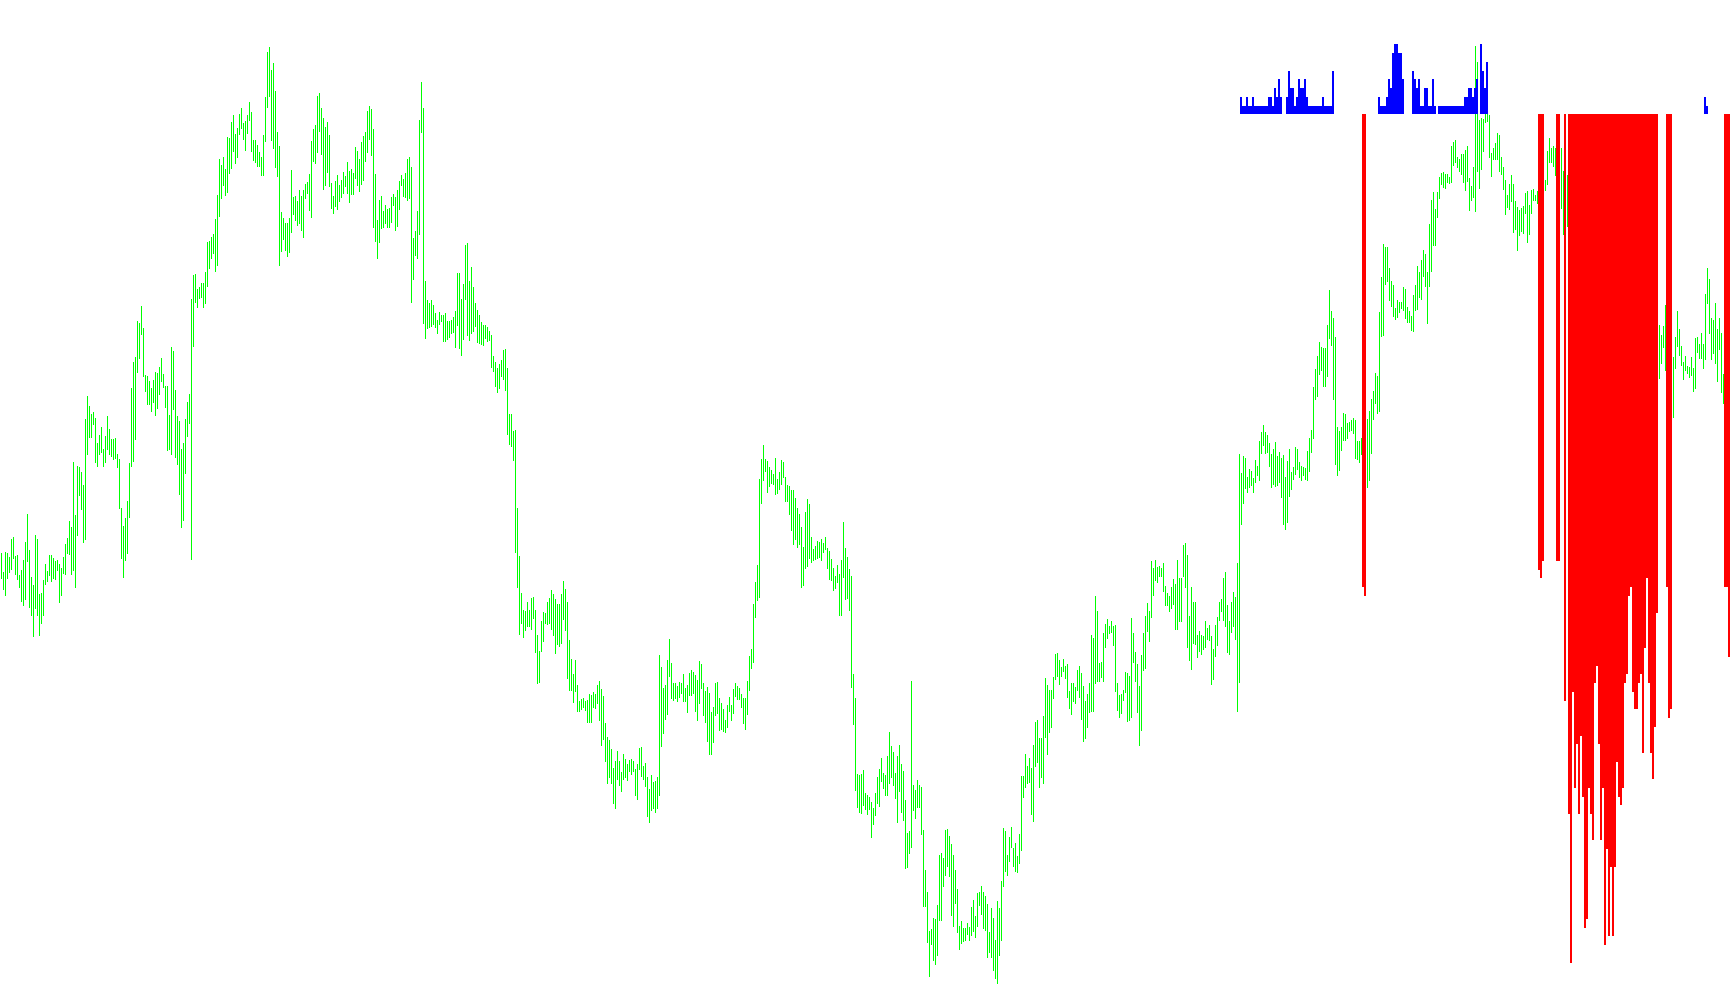
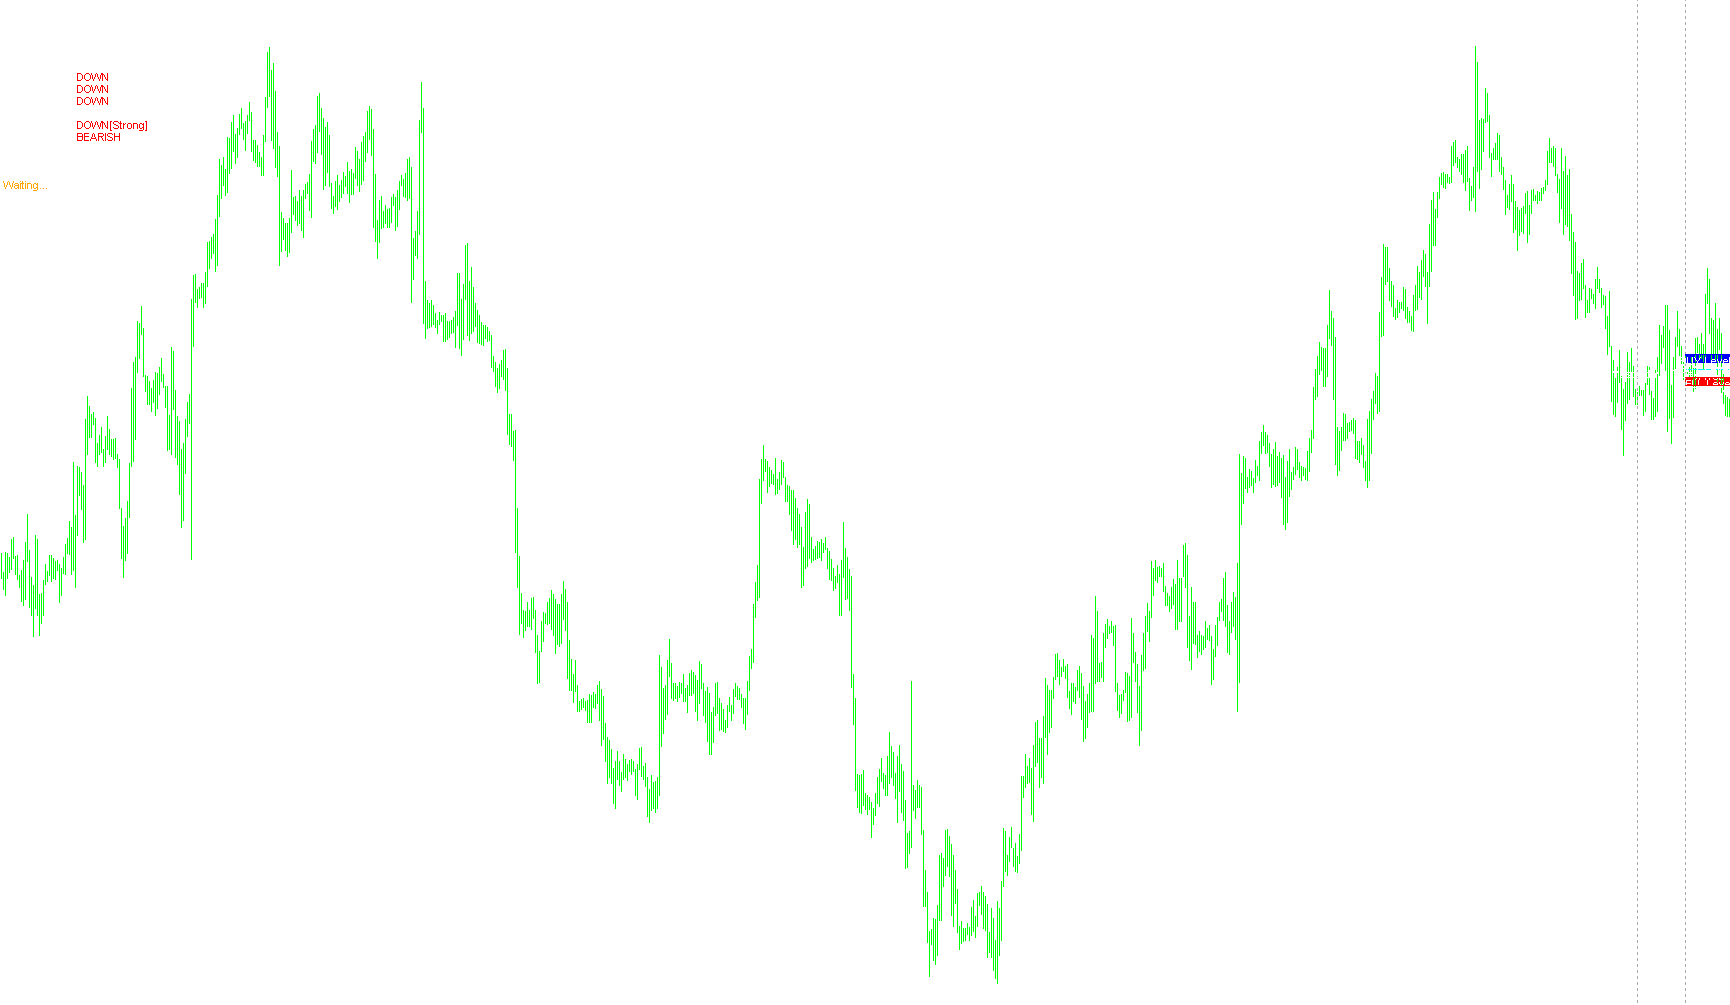
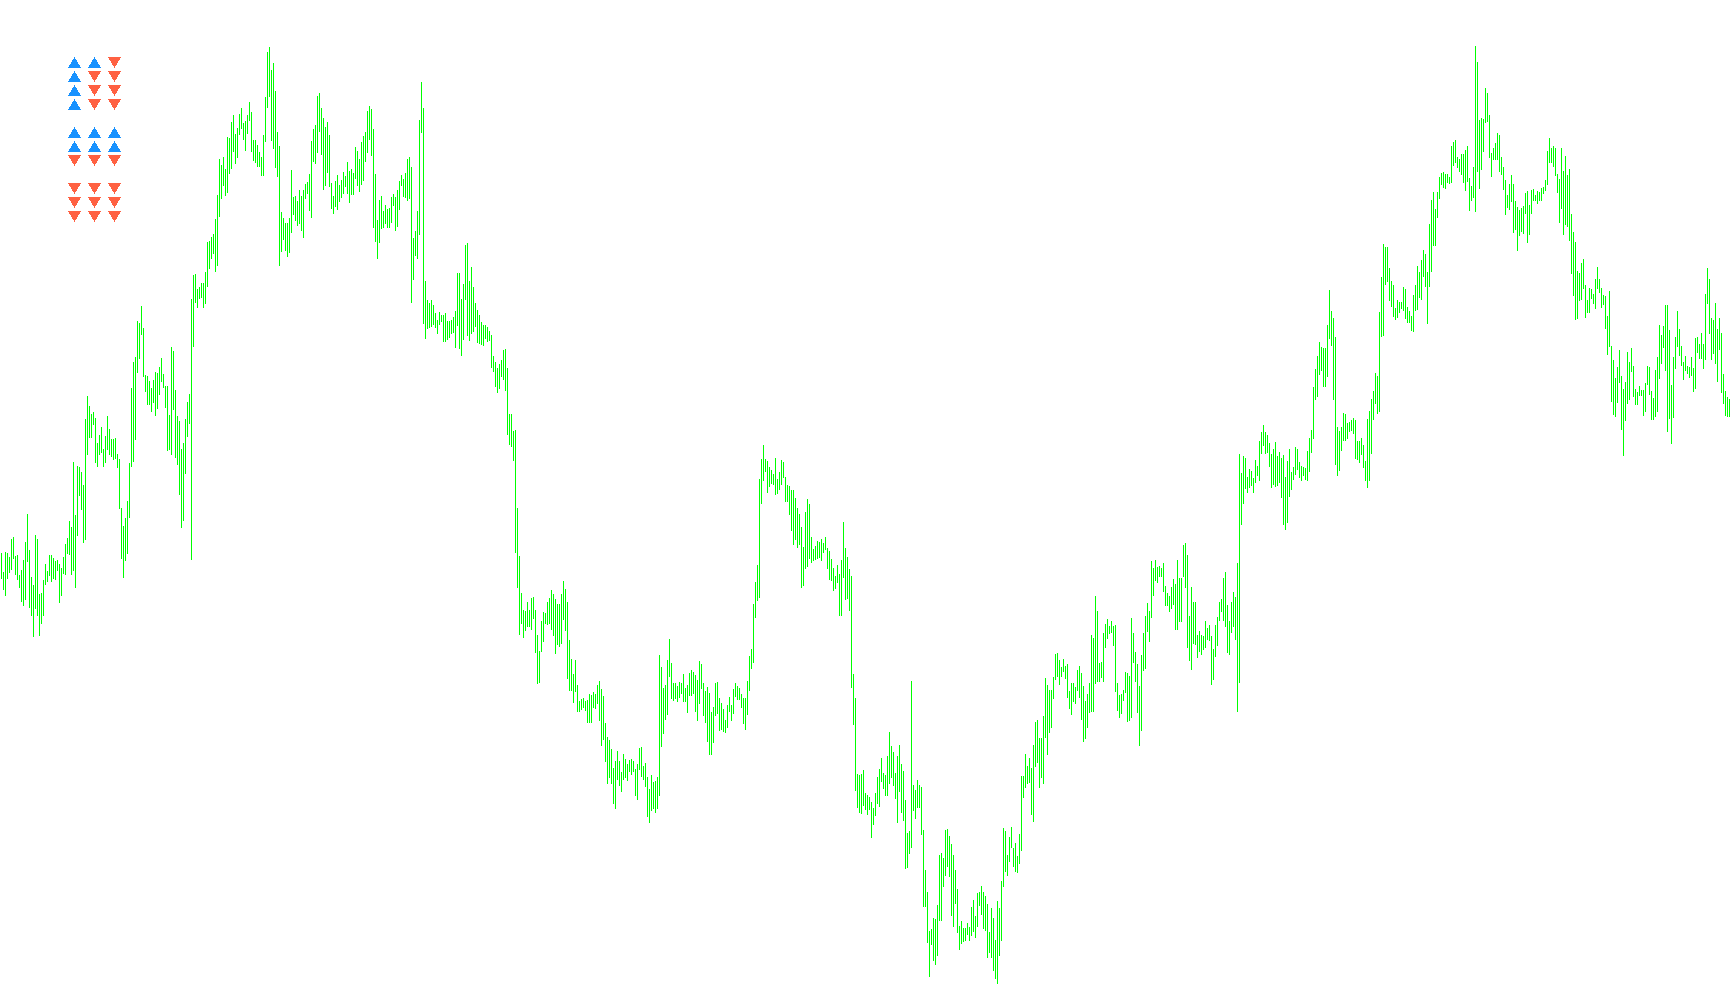
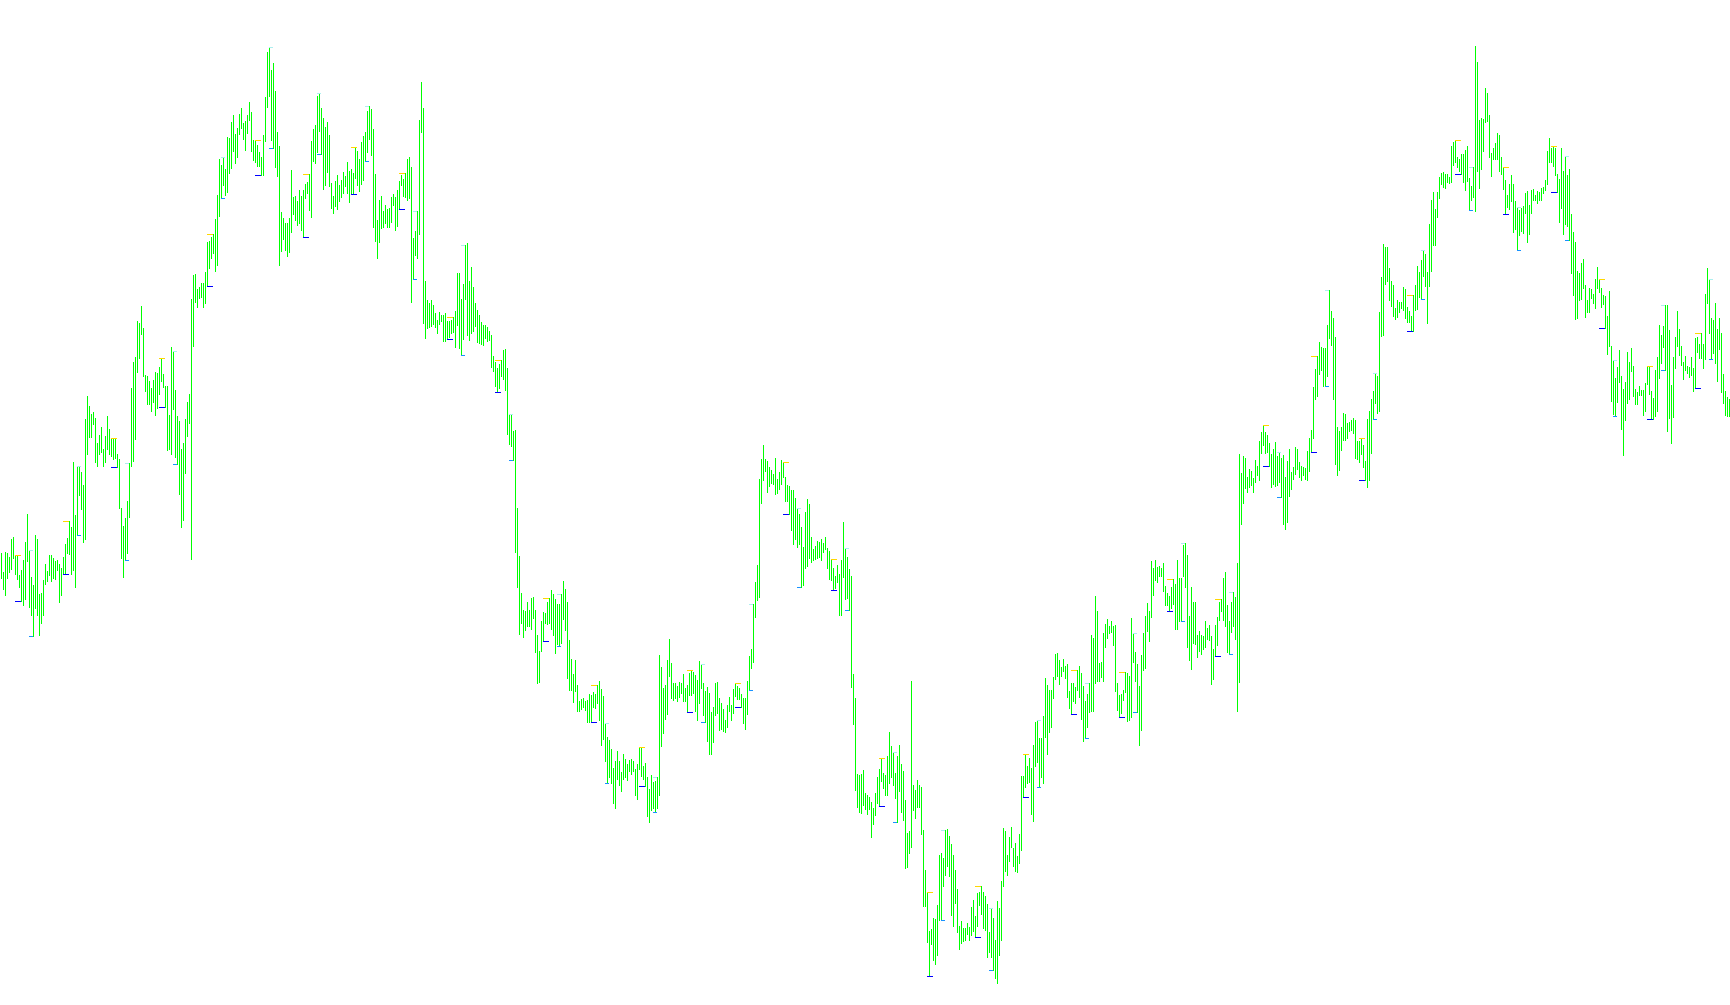
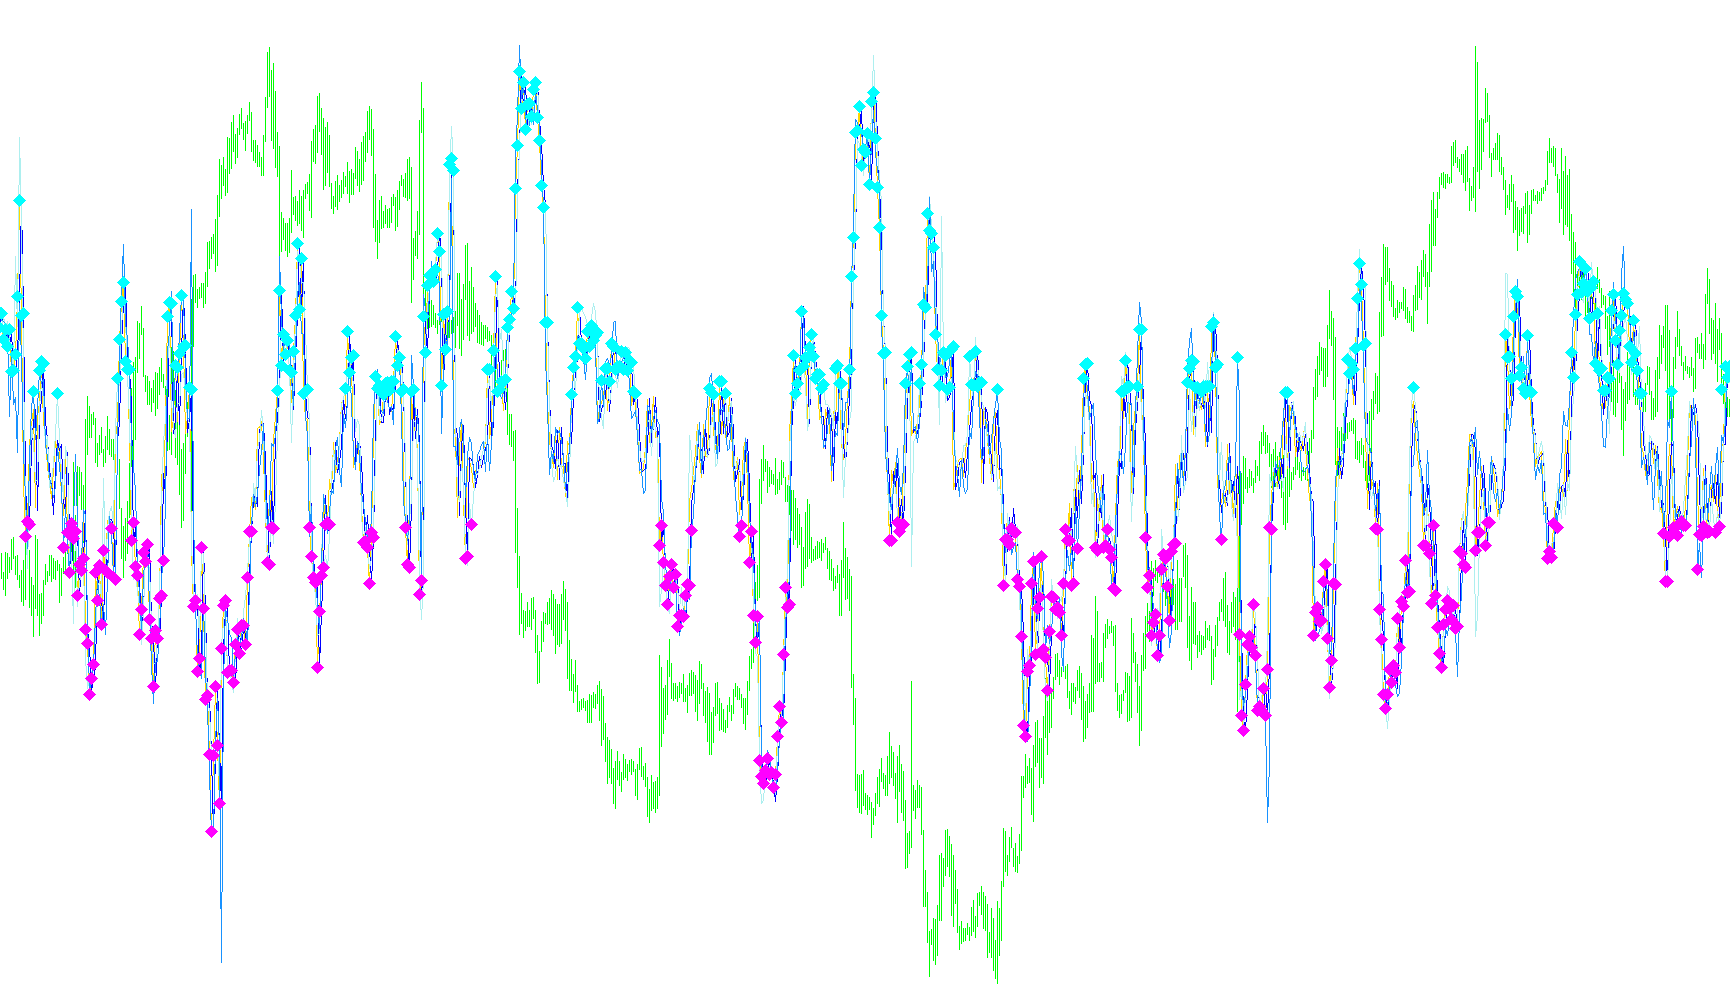
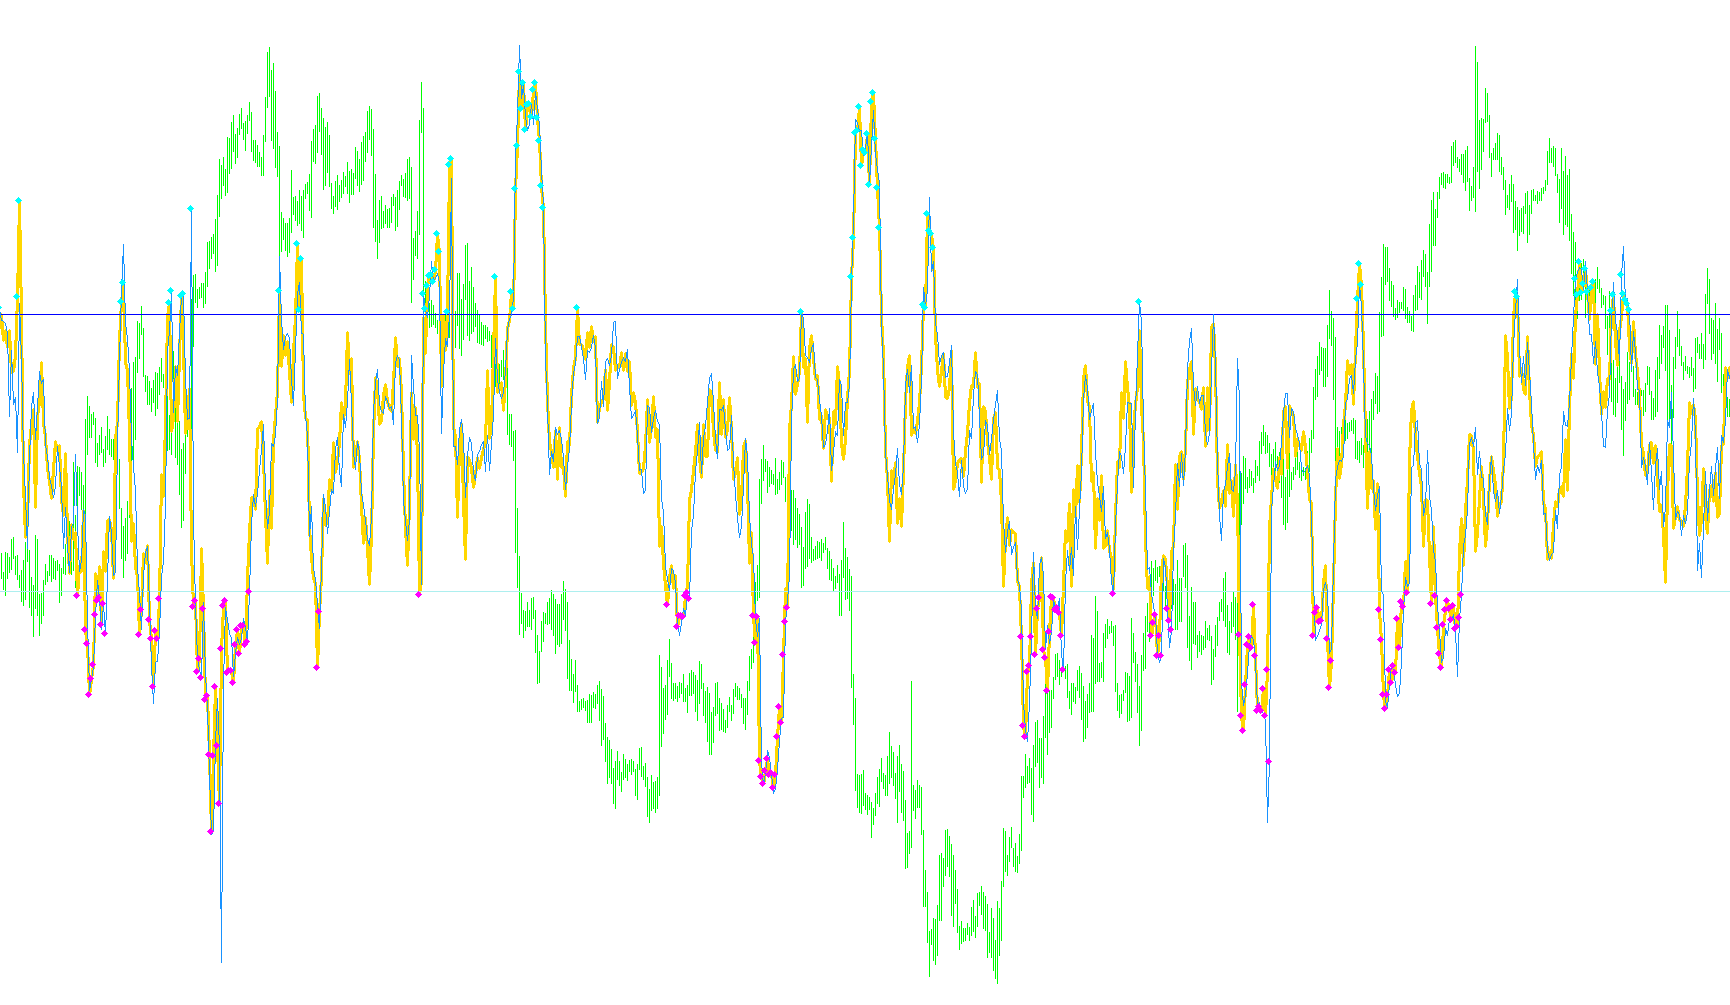
The script identifies bullish and bearish reversals by detecting specific crossovers of the Williams Percent Range relative to extreme levels, validated by RSI median position and a multi-bar lookback confirmation filter.

WPRSI_signal
Indicator

WPRSI_signal

iWPRiRSI

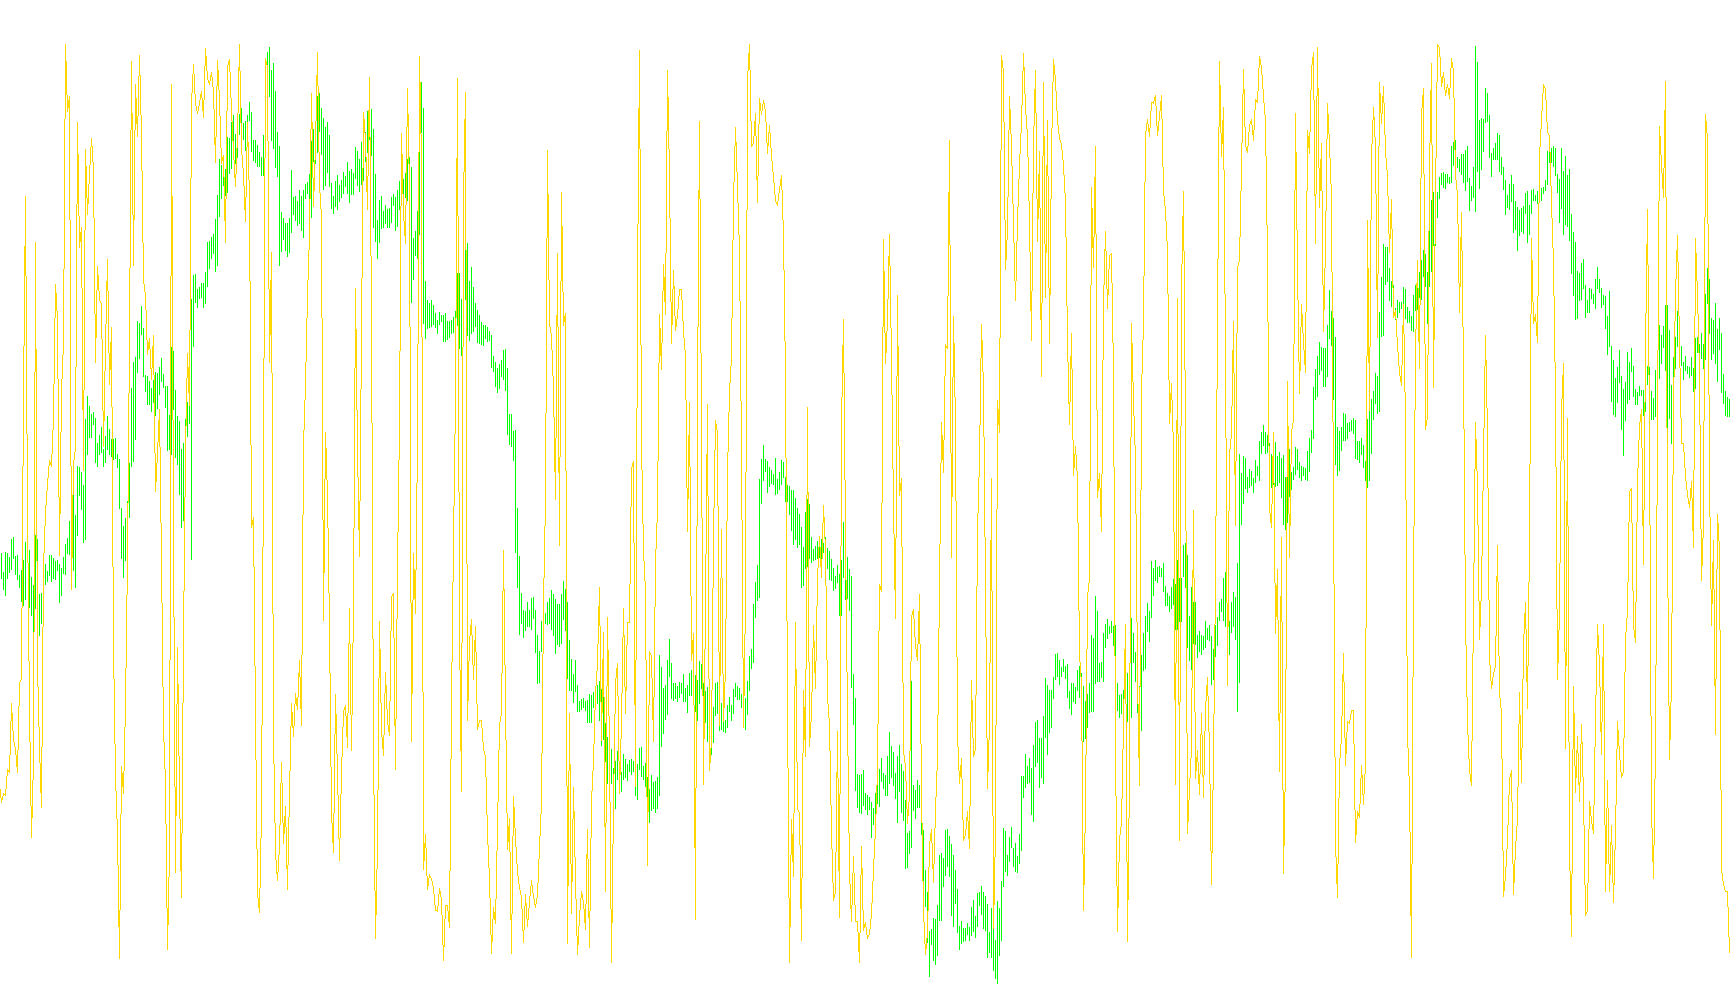
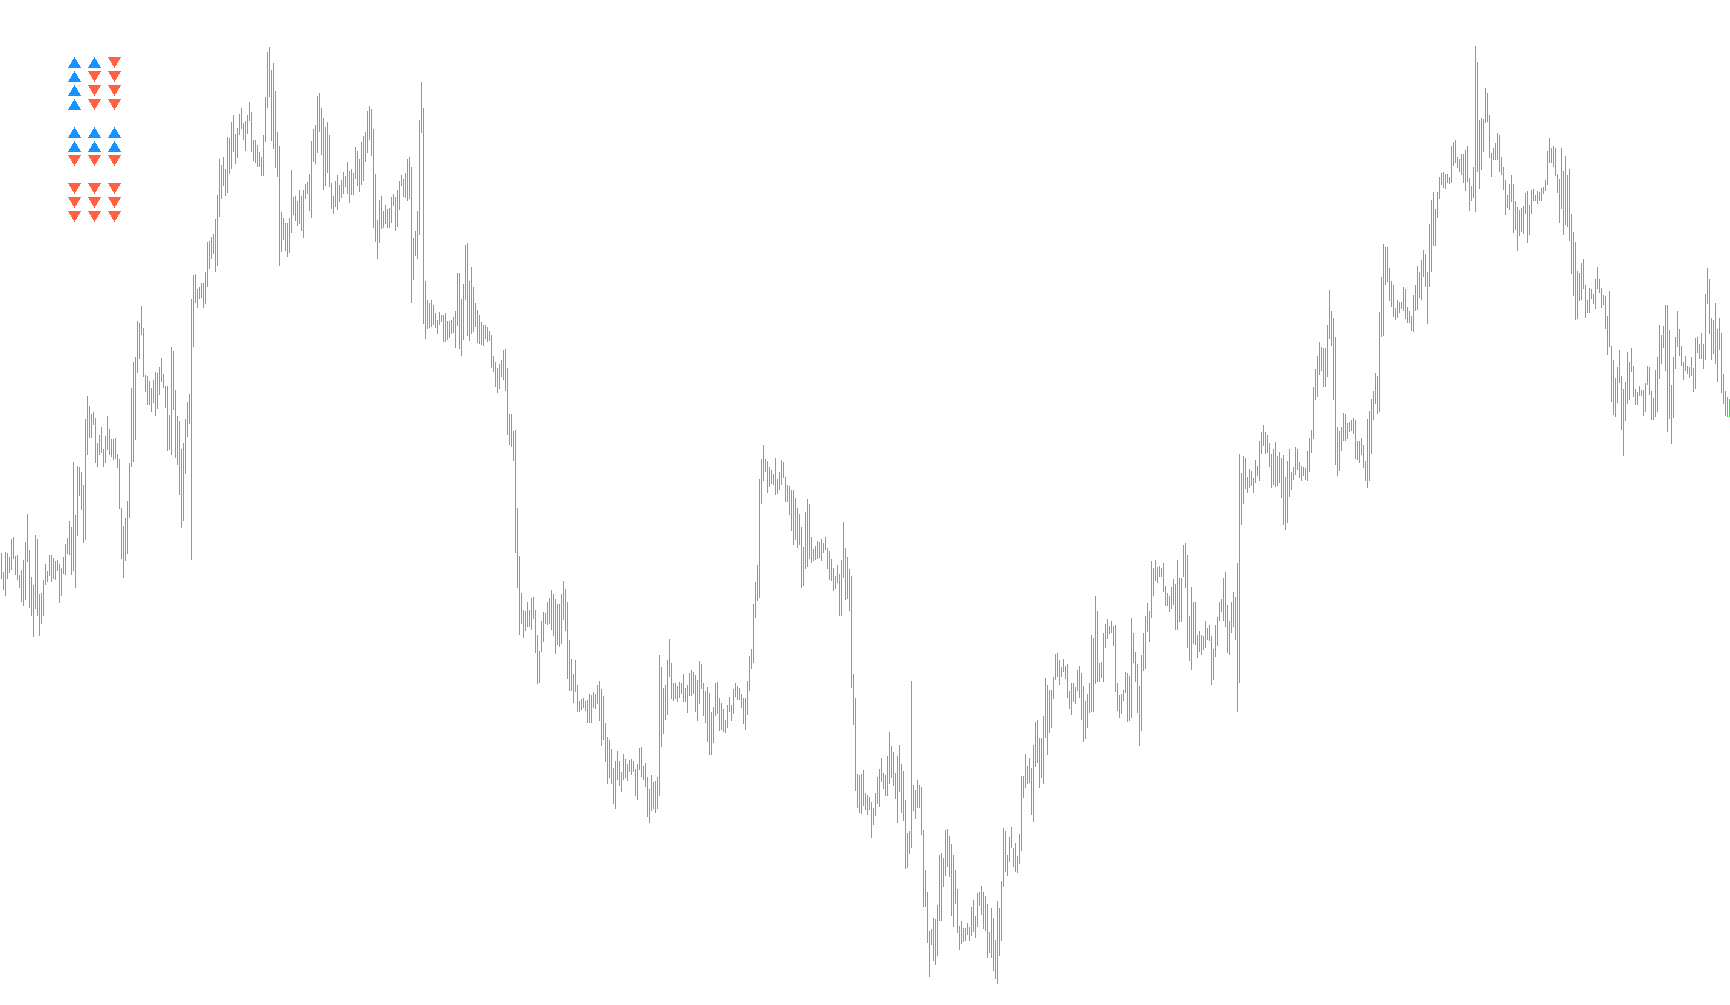
This indicator identifies potential trend reversals by detecting simultaneous crossings of the Williams %R extremes combined with RSI momentum filters and historical price action validation.

WPRSI_signal_V.2(SoundAlarm)
Indicator

WPRSI_signal_V.2(SoundAlarm)

iWPRiRSI

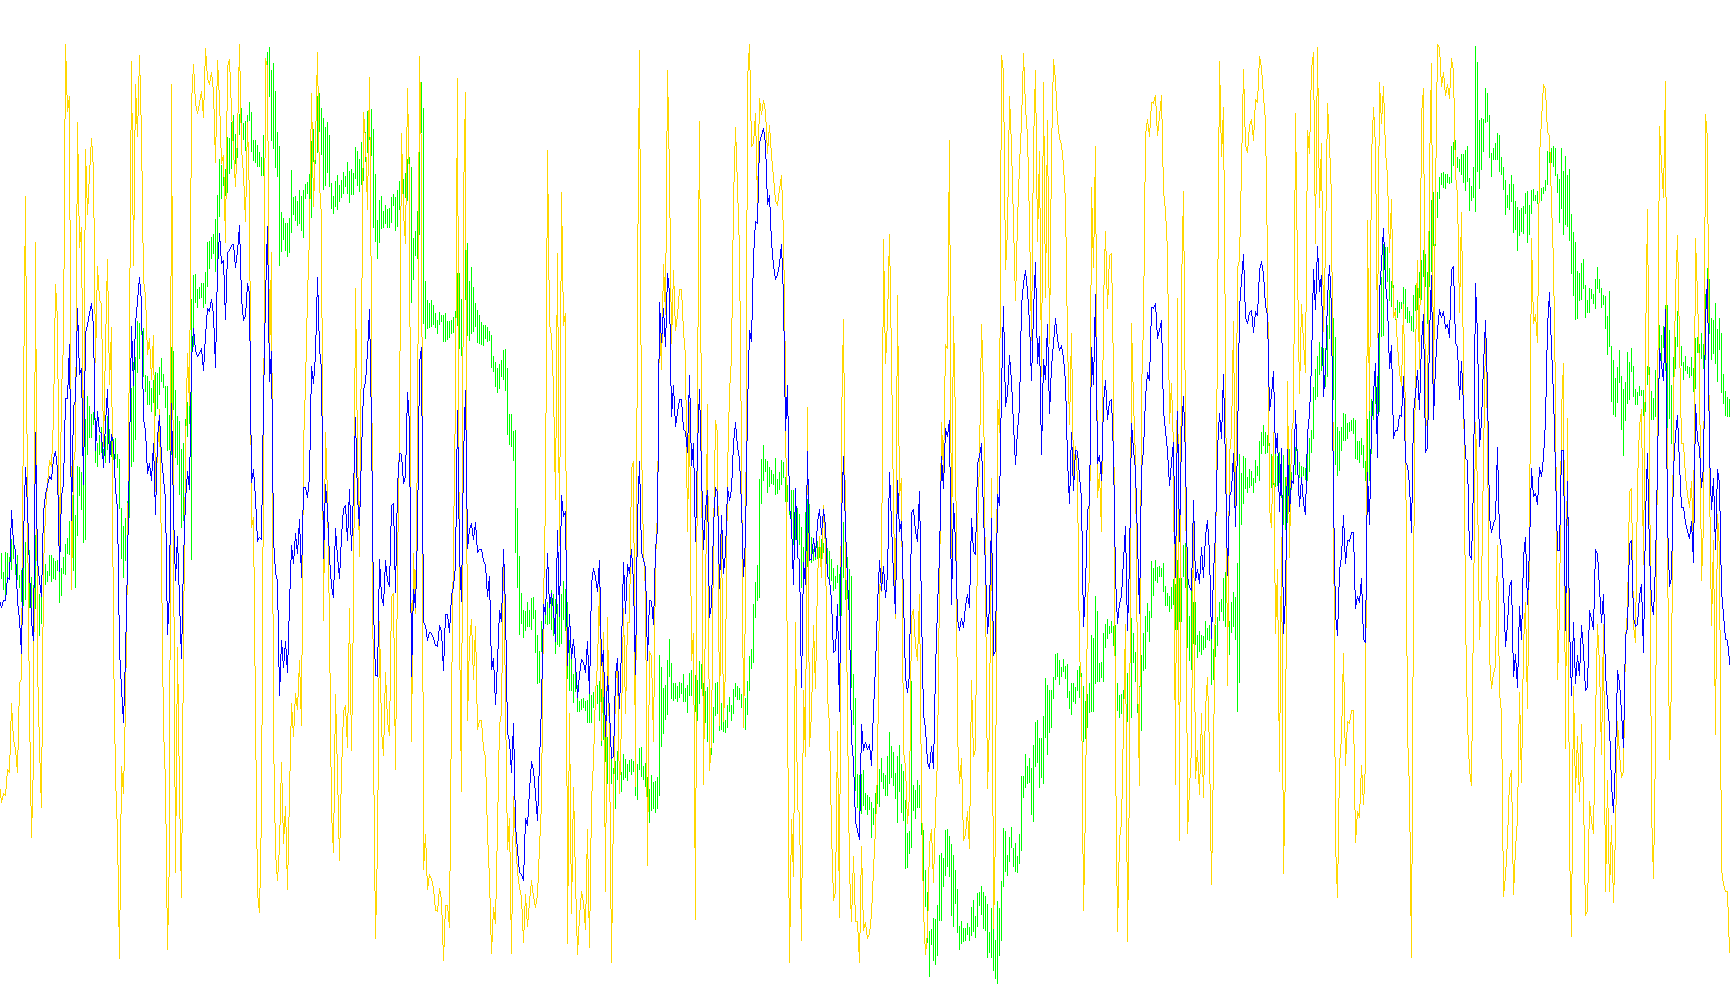
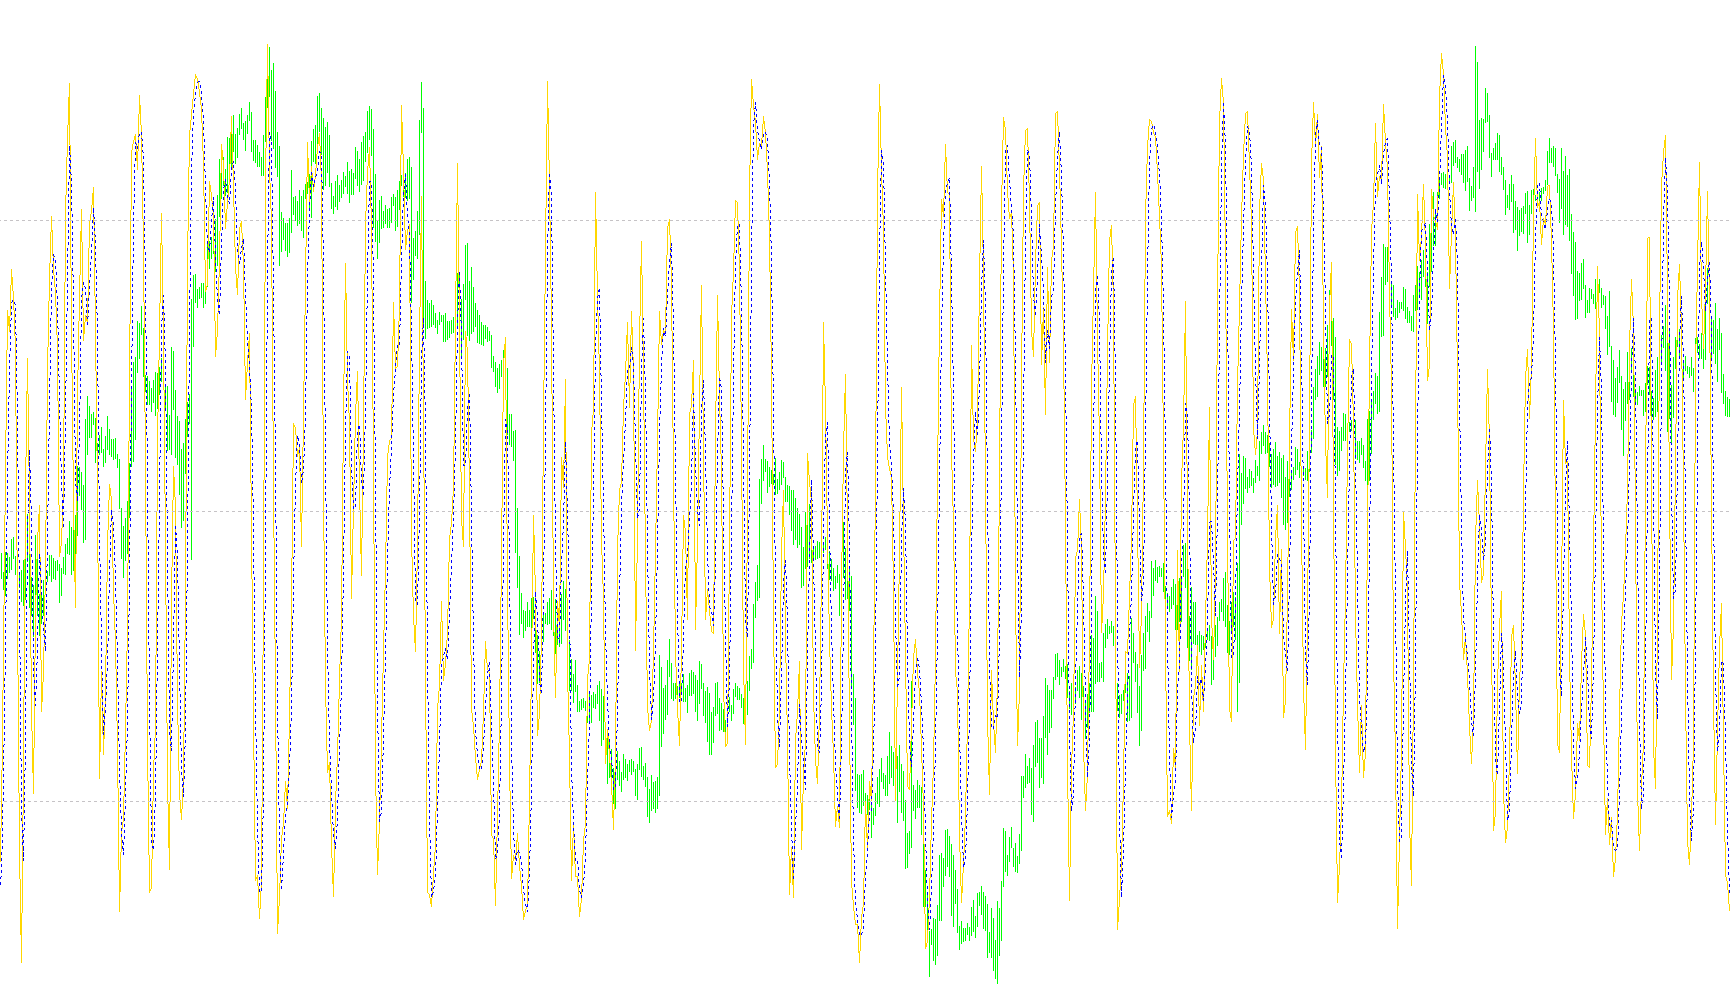
This indicator identifies trend reversals and momentum shifts by cross-referencing Williams Percent Range and RSI values with a hyperbolic tangent transformation of cumulative price action.

WPRSI_signal_V.2
Indicator

WPRSI_signal_V.2

iWPRiRSI

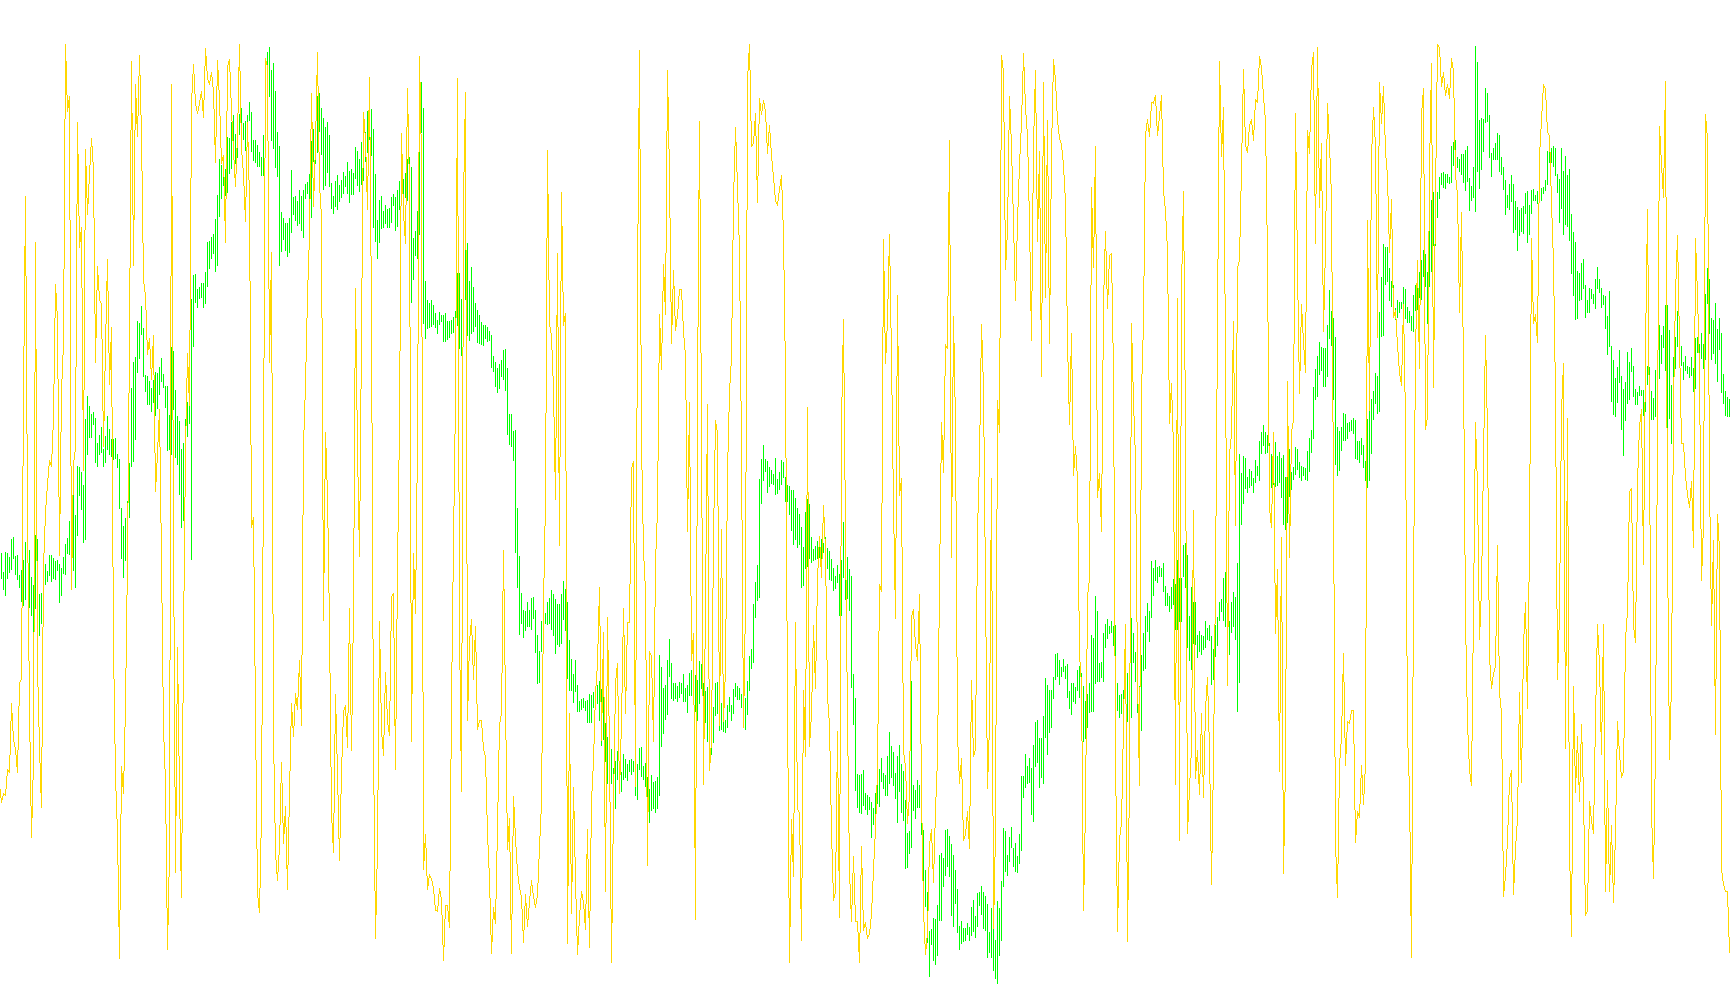
This indicator identifies trend reversals and momentum shifts by evaluating the divergence between Williams Percent Range and RSI levels, coupled with a hyperbolic tangent transformation of cumulative price action.

WPRslow
Indicator

WPRslow

iWPR

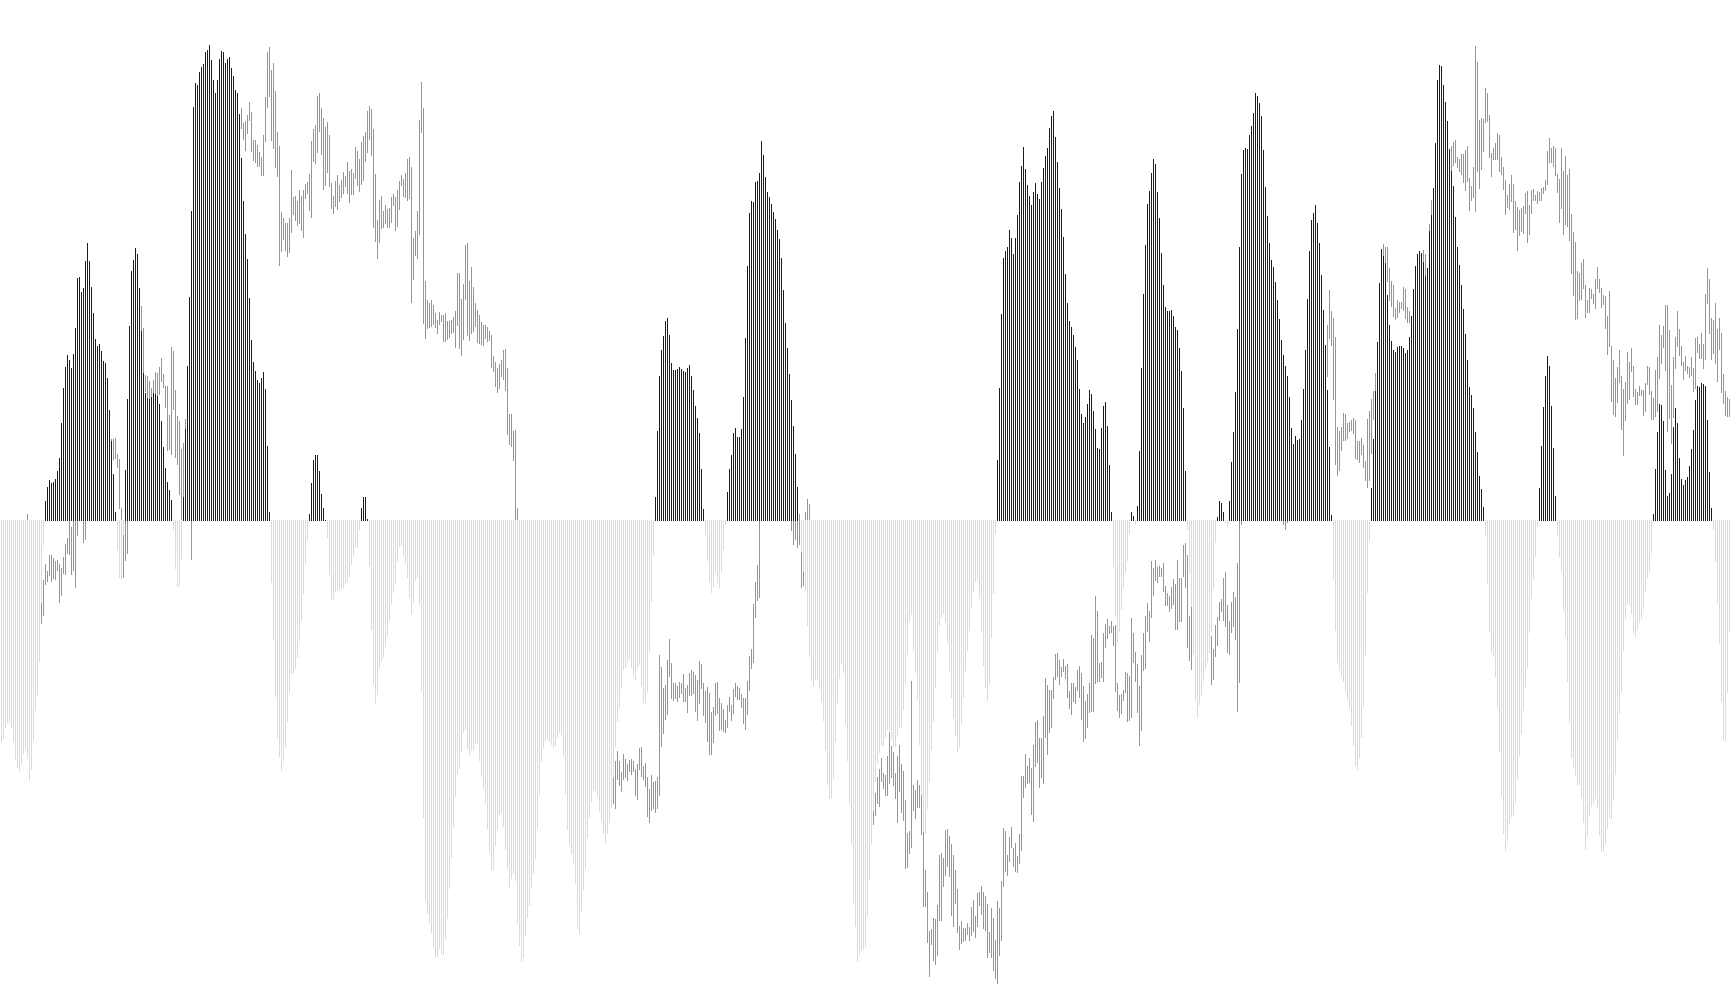
This indicator projects momentum extremes by mapping scaled Williams Percent Range values into distinct upward and downward histogram bars based on specific boundary thresholds.

WPRslow_v1
Indicator

WPRslow_v1

iWPR

This indicator captures extreme price momentum by filtering the squared Williams Percent Range values against two distinct boundary thresholds to highlight significant overbought and oversold conditions.

WPRslow_v2
Indicator

WPRslow_v2

iWPR

The logic filters the squared Williams Percent Range to isolate price action deviations that exceed specific upper and lower thresholds.

WPR_001
Indicator

WPR_001

This indicator calculates the relative position of the current closing price within the highest high and lowest low range over a specified lookback period to identify overbought and oversold exhaustion points.

WPR_Filter_mtf
Indicator

WPR_Filter_mtf

iWPR

This indicator categorizes market sentiment into four distinct states—bullish trend, overbought exhaustion, bearish trend, and oversold exhaustion—by analyzing the Williams Percent Range across higher timeframes.

WPR_hist_div_signal
Indicator

WPR_hist_div_signal

This indicator transforms the Williams Percent Range into an oscillating histogram that identifies trend extremes and detects potential reversals based on price shadow dynamics and high/low breakout conditions.

Indicator

WPR_JMA-HLOC

WPR_RSI_cross_alert
Indicator

WPR_RSI_cross_alert

iWPRiRSI

This indicator monitors the convergence and divergence between the Williams Pivot Range and Relative Strength Index to trigger alerts upon their directional intersection.

WPR_v2
Indicator

WPR_v2

This indicator calculates the relative position of the current closing price within the high-low range over a specified lookback period to identify overbought and oversold zones.

WriteDataSeries
Indicator

WriteDataSeries

iMACD

This automated script captures and archives historical MACD main line values along with price points into a structured CSV file for external quantitative analysis.

WSOWROTrend
Indicator

WSOWROTrend

This indicator identifies and maps sequential historical price extremes to visualize multi-layered support and resistance levels alongside automated trend line projections.

WSOWROTrend_v1
Indicator

WSOWROTrend_v1

This indicator identifies and projects key structural price pivots by tracking the most recent local highs and lows to render real-time support and resistance trendlines.

WSS_open
Indicator

WSS_open

iForceiADXiRSI
WSS_open_v1
Indicator

WSS_open_v1

iForceiADXiRSI
Indicator

X-Clock

X-Pair
Indicator

X-Pair

iMA

This indicator monitors concurrent moving average crossovers across multiple currency pairs and commodities to provide a unified real-time trend sentiment display.

X-Pair_v1
Indicator

X-Pair_v1

iMA

This indicator synchronizes real-time moving average crossovers across multiple currency pairs and commodities to provide a unified directional bias on a single dashboard.

X-Signals
Indicator

X-Signals

iMACDiStochastic

This indicator synthesizes Stochastic momentum and MACD trend data across nine distinct timeframes to provide a unified visual dashboard of market bias and volatility strength.

x
Indicator

x

A foundational boilerplate structure designed to initialize custom visual markers or computational logic within the MetaTrader 4 charting environment.
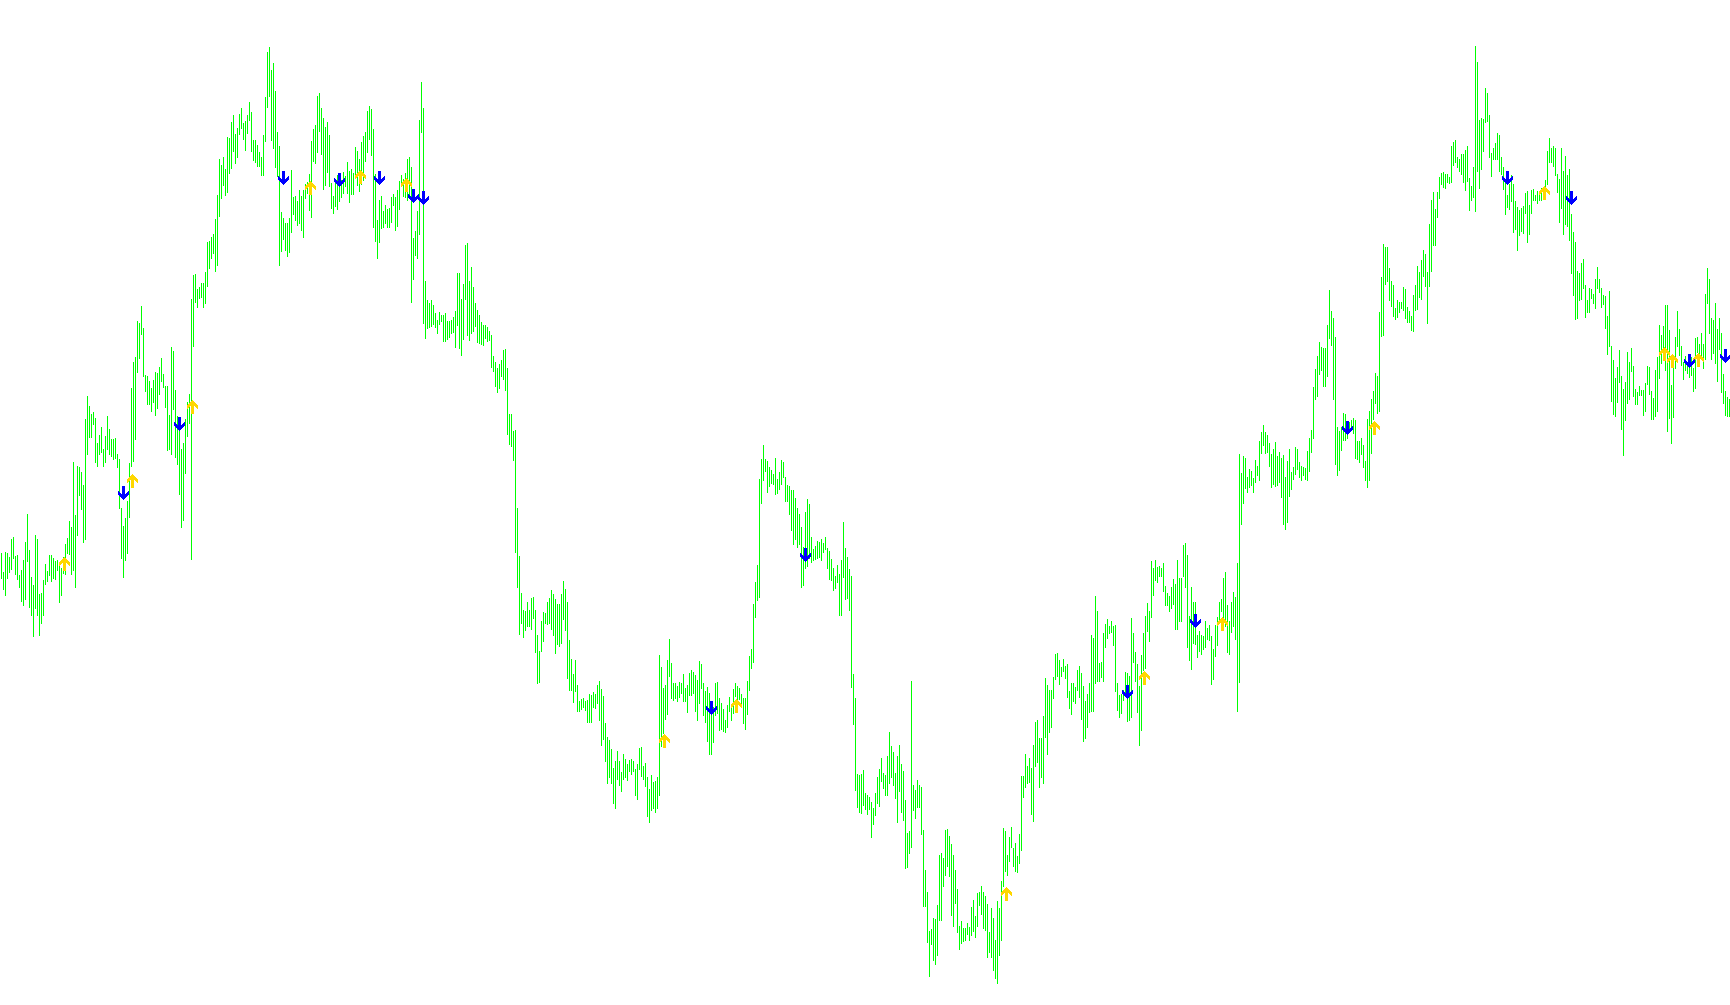
X0diagram1
Indicator

X0diagram1

This indicator visualizes market price action by plotting geometric blocks that track structural shifts and reversal amplitudes based on fixed point volatility.

X0diagram1_v1
Indicator

X0diagram1_v1

The indicator tracks price trajectory by plotting geometric segments that represent directional shifts based on threshold-defined reversal boundaries.

X0diagram1_v2
Indicator

X0diagram1_v2

The logic identifies structural price reversals by monitoring price fluctuations against user-defined box thresholds and plots directional movement as a geometric histogram.

X5
Indicator

X5

iMA

This indicator calculates the cumulative momentum of major fiat currencies by aggregating weighted moving average deviations across a basket of correlated currency pairs.

XALIF!
Indicator

XALIF!

This indicator dynamically maps the high and low price extremes within two specific time windows to visualize volatile session boundaries.

XALIF
Indicator

XALIF

This indicator identifies and projects the high and low price boundaries of two specific intraday sessions onto the chart for liquidity analysis.

XALIF2
Indicator

XALIF2

This indicator identifies and projects the high and low price extremes of two specific time-defined sessions across the daily chart.
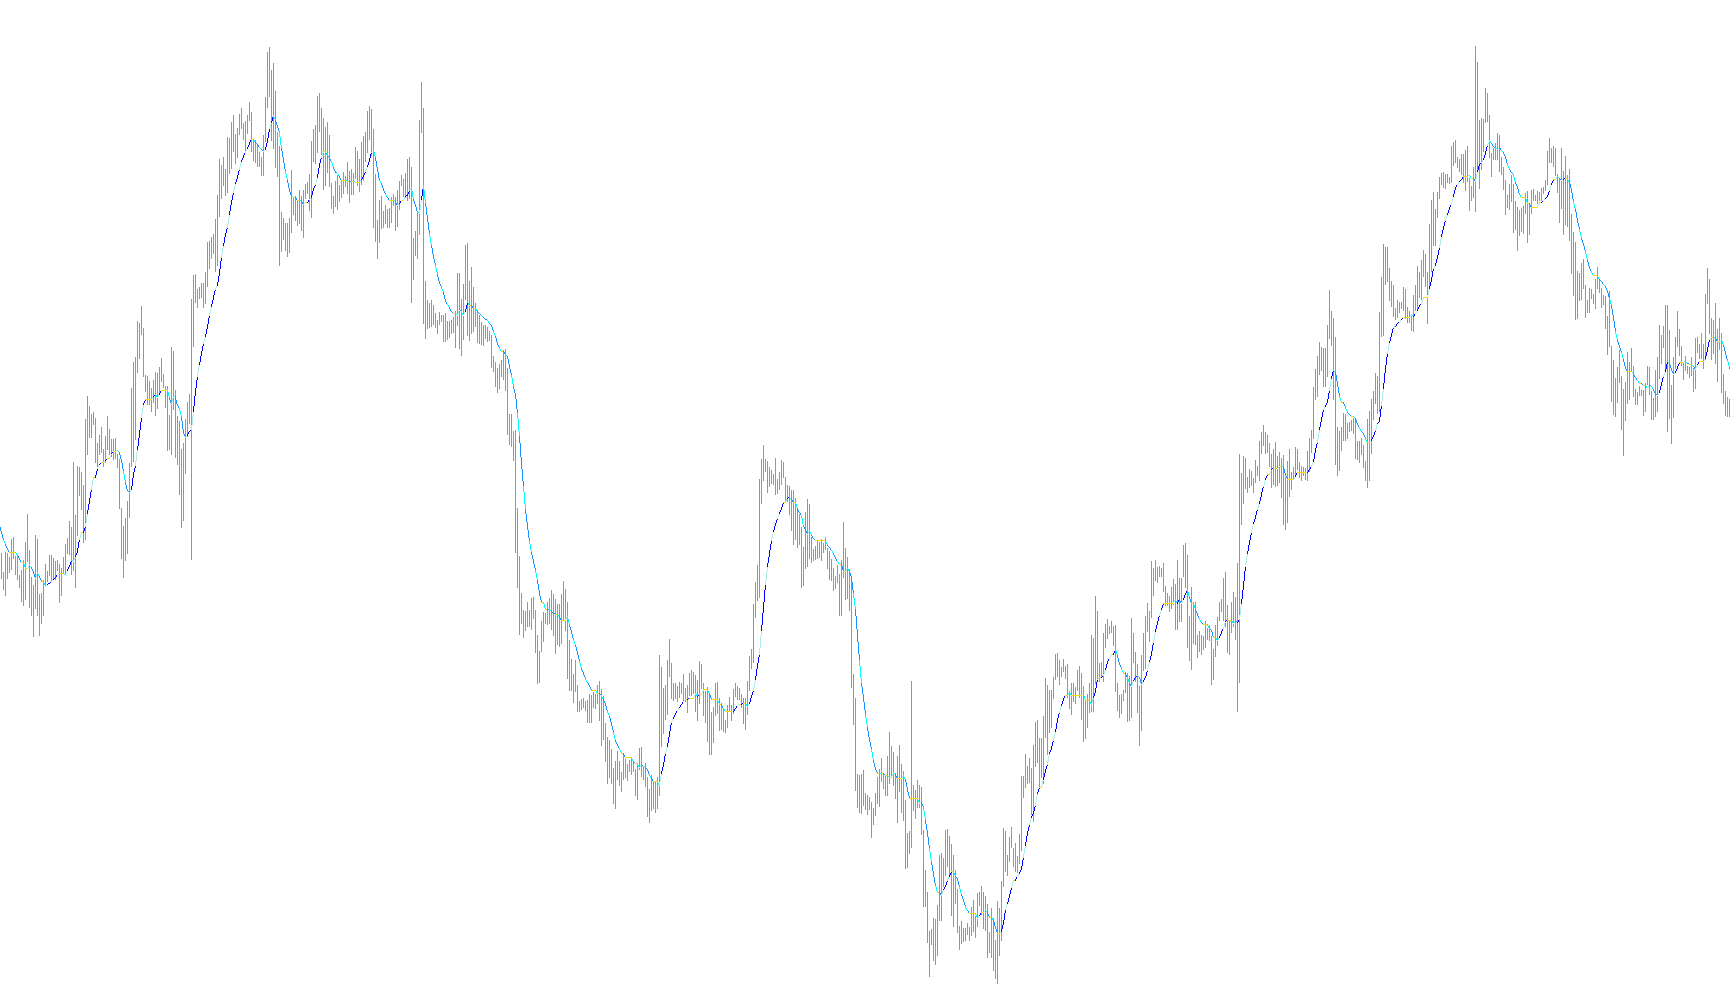
XaosExplorer
Indicator

XaosExplorer

The indicator identifies volatility patterns by calculating price ratios between current and historical data points to trigger signals when specific threshold deviations occur.
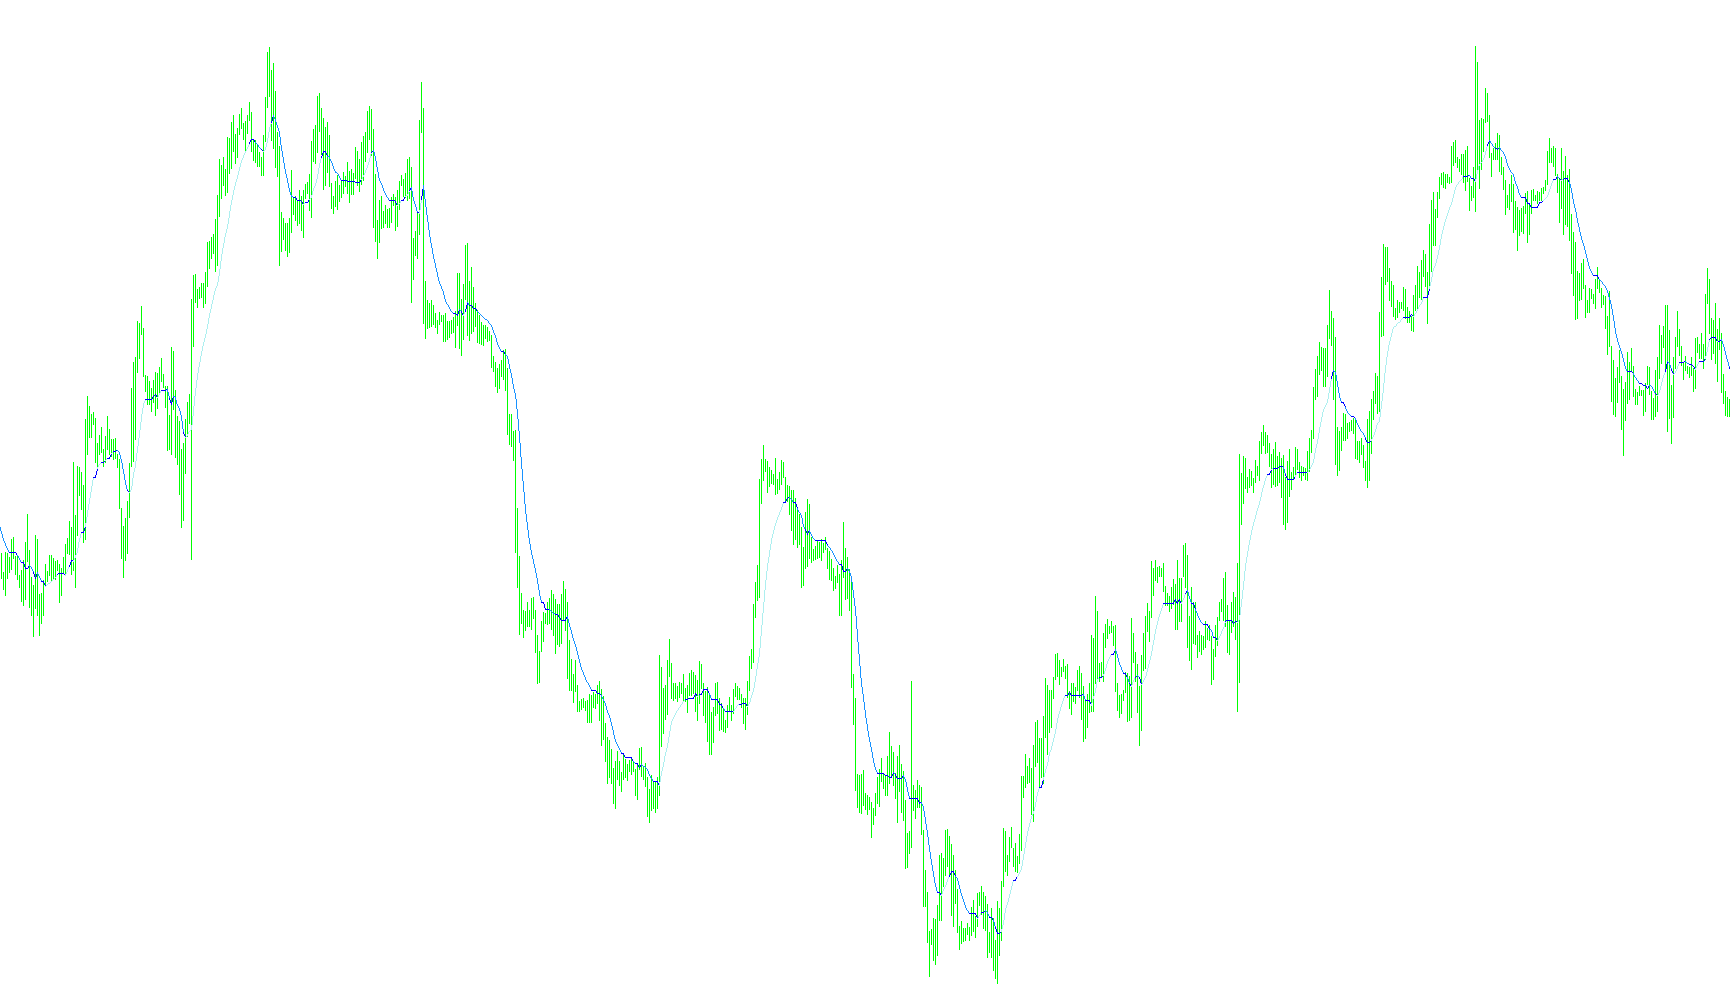
XaosExplore_PerkyMod
Indicator

XaosExplore_PerkyMod

This indicator identifies bullish and bearish price action by calculating the percentage variance between current prices and historical data points over a specific separation period.

Indicator

Xard-MM2

iMAiRSI
xb4a
Indicator

xb4a

iMA

This indicator maps directional momentum by isolating price shifts in an exponential moving average to highlight structural reversals.

xb4b
Indicator

xb4b

This indicator calculates a smoothed moving average using a linear regression weight and identifies bullish momentum by filtering for specific price crossovers against a second velocity-adjusted line.

xb4c
Indicator

xb4c

This indicator synthesizes daily pivot points, high/low price action history, and volatility-based trap levels to identify potential breakout zones and reversal points.

xb4d
Indicator

xb4d

This indicator computes a smoothed relative position of price within a dynamic range and applies a logarithmic transformation to visualize momentum extremes and directional bias.

xb4e
Indicator

xb4e

iStochastic

This indicator identifies market exhaustion and directional shifts by monitoring K-line crossovers relative to predefined overbought and oversold thresholds.

xb4f
Indicator

xb4f

Identifies dynamic trend reversals by detecting specific intersection patterns between two distinct moving average signal streams.

Indicator

xedginves@yahoo.com__Neutral_Hedge_osc_v4.5

iMAOnArrayiStdDevOnArray
Indicator

xedginves@yahoo.com__Neutral_Hedge_osc_v4.5~

iMAOnArrayiStdDevOnArray
Xma[1]
Indicator

Xma[1]

iMA

This indicator calculates an adaptive moving average that only updates its value when the variance between consecutive price actions exceeds a predefined point threshold, effectively filtering out minor market noise.

Xma_3col[1]
Indicator

Xma_3col[1]

iMA

This indicator filters price volatility by maintaining a constant moving average value until the delta between consecutive periods exceeds a user-defined point threshold.

Xma_Coloured
Indicator

Xma_Coloured

iMA

This indicator identifies trend reversals by detecting price breaches of a smoothed moving average that only updates when the variance exceeds a specific sensitivity threshold.

Xma_Coloured[1]
Indicator

Xma_Coloured[1]

iMA

The algorithm identifies trend shifts by detecting price breaches of a calculated moving average signal that only updates when the difference between two consecutive moving averages exceeds a defined volatility threshold.

Xma_col[1]
Indicator

Xma_col[1]

iMA

This indicator identifies structural market shifts by detecting significant price deviations between consecutive moving averages to generate distinct trend direction signals.

Indicator

xMeter Indicator

Indicator

xMeter Indicator2

Indicator

xMeter Indicator2_v1

xMeterMTF
Indicator

xMeterMTF

This indicator quantifies the relative market power of major currencies by calculating and averaging their price performance ratios across multiple currency pairs.