wlxBW5Zone
Download script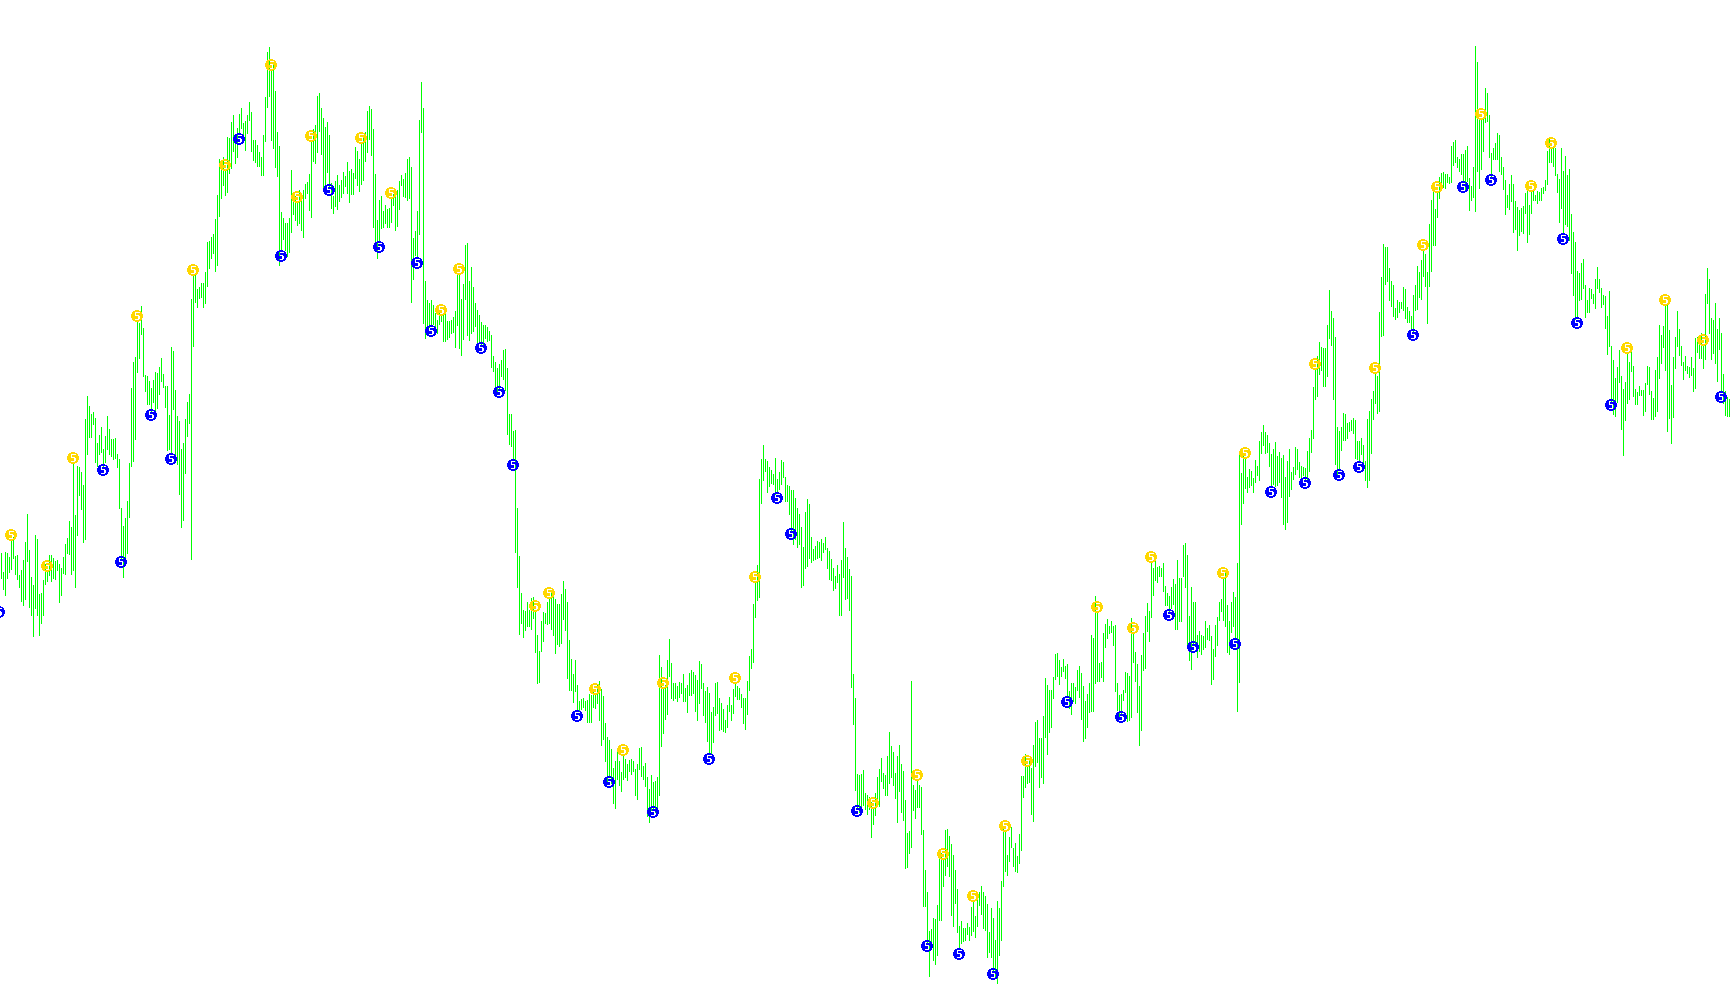
This tool is designed to help traders identify specific trend shifts by analyzing the relationship between two different market oscillators: the Awesome Oscillator (AO) and the Accumulation/Distribution (AC) index. By looking for "confluence"—where both indicators agree on a direction—the script filters out minor market noise to highlight more significant momentum changes.
How the Logic Works
The core logic of this script revolves around detecting continuous, multi-bar movements in price momentum. Instead of reacting to a single price tick, it looks for a specific sequence across five consecutive data points.
1. Identifying Upward Momentum (Bullish Zones) The script scans the market to see if both the Awesome Oscillator and the Accumulation/Distribution index are moving upward simultaneously over a five-bar period. Specifically, it checks if:
- The current value is higher than the previous value.
- The previous value is higher than the one before it, and so on, for five steps.
If both indicators show this consistent "staircase" growth, the script recognizes a strong bullish trend. It then places a visual marker (a gold arrow) above the price to signal this zone.
2. Identifying Downward Momentum (Bearish Zones) Conversely, the script looks for a continuous five-bar decline in both indicators. If both are moving downward consistently:
- The current value is lower than the previous.
- This pattern repeats backward for five steps.
When this condition is met, the script places a visual marker (a red arrow) below the price to signal a strong bearish trend.
3. Preventing Signal Overload (The Flag System) To keep your chart clean and readable, the script includes a "flag" system. This ensures that it doesn't place an arrow on every single bar during a long trend. Once a bullish or bearish zone is identified, the script "locks" that signal until the momentum actually breaks. It will only provide a new signal once the indicators reverse direction, preventing the chart from being cluttered with repetitive markers.
Summary for Traders
In simple terms, this indicator acts as a confirmation tool. It waits for two different types of market data (momentum and volume distribution) to line up in perfect agreement over a specific timeframe before highlighting a potential trend change. If both "agree" that the price is moving strongly in one direction, the script marks the entry point for you.
//+------------------------------------------------------------------+
//|                                                   wlxBW5Zone.mq4 |
//|                        Copyright © 2005 B.Williams, coding wellx |
//|                                        http://www.metaquotes.net |
//+------------------------------------------------------------------+
#property copyright "Copyright © 2005 B.Williams, coding wellx"
#property link      "http://www.metaquotes.net"
//----
#property indicator_chart_window
#property indicator_buffers 2
#property indicator_color1 PaleGoldenrod
#property indicator_color2 Red
//---- input parameters
extern int       updown=12;
//---- buffers
double BWZone5Up[];
double BWZone5Down[];
int pos=0;
double AC1,AC2,AC3,AC4,AC5;
double AO1,AO2,AO3,AO4,AO5;
bool flagUP=false, flagDown=false;
//+------------------------------------------------------------------+
//| Custom indicator initialization function                         |
//+------------------------------------------------------------------+
int init()
  {
//---- indicators
   SetIndexStyle(0,DRAW_ARROW);
   SetIndexArrow(0,144);
   SetIndexBuffer(0,BWZone5Up);
   SetIndexEmptyValue(0,0.0);
   //
   SetIndexStyle(1,DRAW_ARROW);
   SetIndexArrow(1,144);
   SetIndexBuffer(1,BWZone5Down);
   SetIndexEmptyValue(1,0.0);
//----
   return(0);
  }
//+------------------------------------------------------------------+
//| Custor indicator deinitialization function                       |
//+------------------------------------------------------------------+
int deinit()
  {
//---- TODO: add your code here
//----
   return(0);
  }
//+------------------------------------------------------------------+
//| Custom indicator iteration function                              |
//+------------------------------------------------------------------+
int start()
  {
   int    cbars=IndicatorCounted();
   if  (cbars<0) return(-1);
   if  (cbars>0) cbars--;
//---- TODO: add your code here
   if (cbars > (Bars-6)) pos=(Bars-6);
   else pos=cbars;
   while(pos > 0)
     {
      BWZone5Up[pos]=0;
      BWZone5Down[pos]=0;
      AO1=iAO(NULL,0,pos);
      AO2=iAO(NULL,0,pos+1);
      AO3=iAO(NULL,0,pos+2);
      AO4=iAO(NULL,0,pos+3);
      AO5=iAO(NULL,0,pos+4);
      //
      AC1=iAC(NULL,0,pos);
      AC2=iAC(NULL,0,pos+1);
      AC3=iAC(NULL,0,pos+2);
      AC4=iAC(NULL,0,pos+3);
      AC5=iAC(NULL,0,pos+4);
//----
      if ((AO1>AO2 && AO2>AO3 && AO3>AO4 && AO4>AO5) &&
          (AC1>AC2 && AC2>AC3 && AC3>AC4 && AC4>AC5))
        {
         if (flagUP==false)
           { BWZone5Up[pos] =High[pos]+updown*Point;
            flagUP=true;
           }
        }
      if ((AO1<AO2 && AO2<AO3 && AO3<AO4 && AO4<AO5) &&
          (AC1<AC2 && AC2<AC3 && AC3<AC4 && AC4<AC5))
        {
         if (flagDown==false)
           {
            BWZone5Down[pos]= Low[pos]-updown*Point;
            flagDown=True;
           }
        }
      if ((AO1<AO2)||(AC1<AC2)) flagUP=false;
      if ((AO1>AO2)||(AC1>AC2)) flagDown=false;
      pos--;
     }
//----
   return(0);
  }
//+------------------------------------------------------------------+
Comments