WcciPatterns_v1
Indicator

WcciPatterns_v1

iCCI

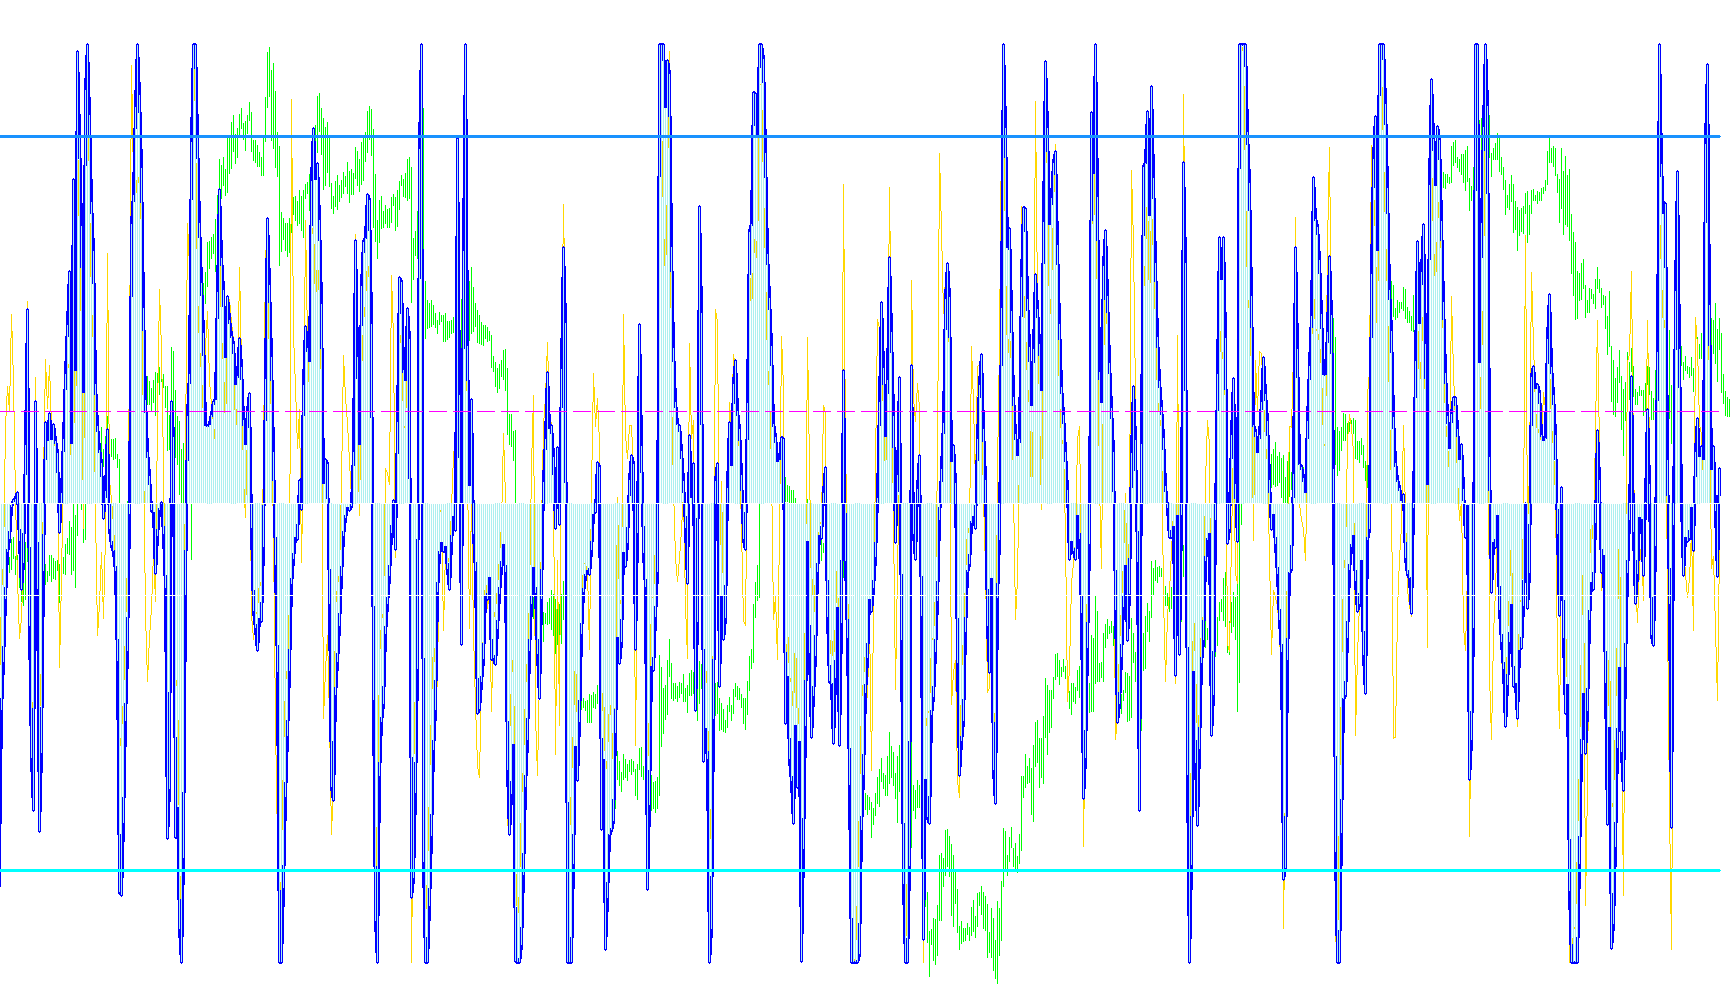
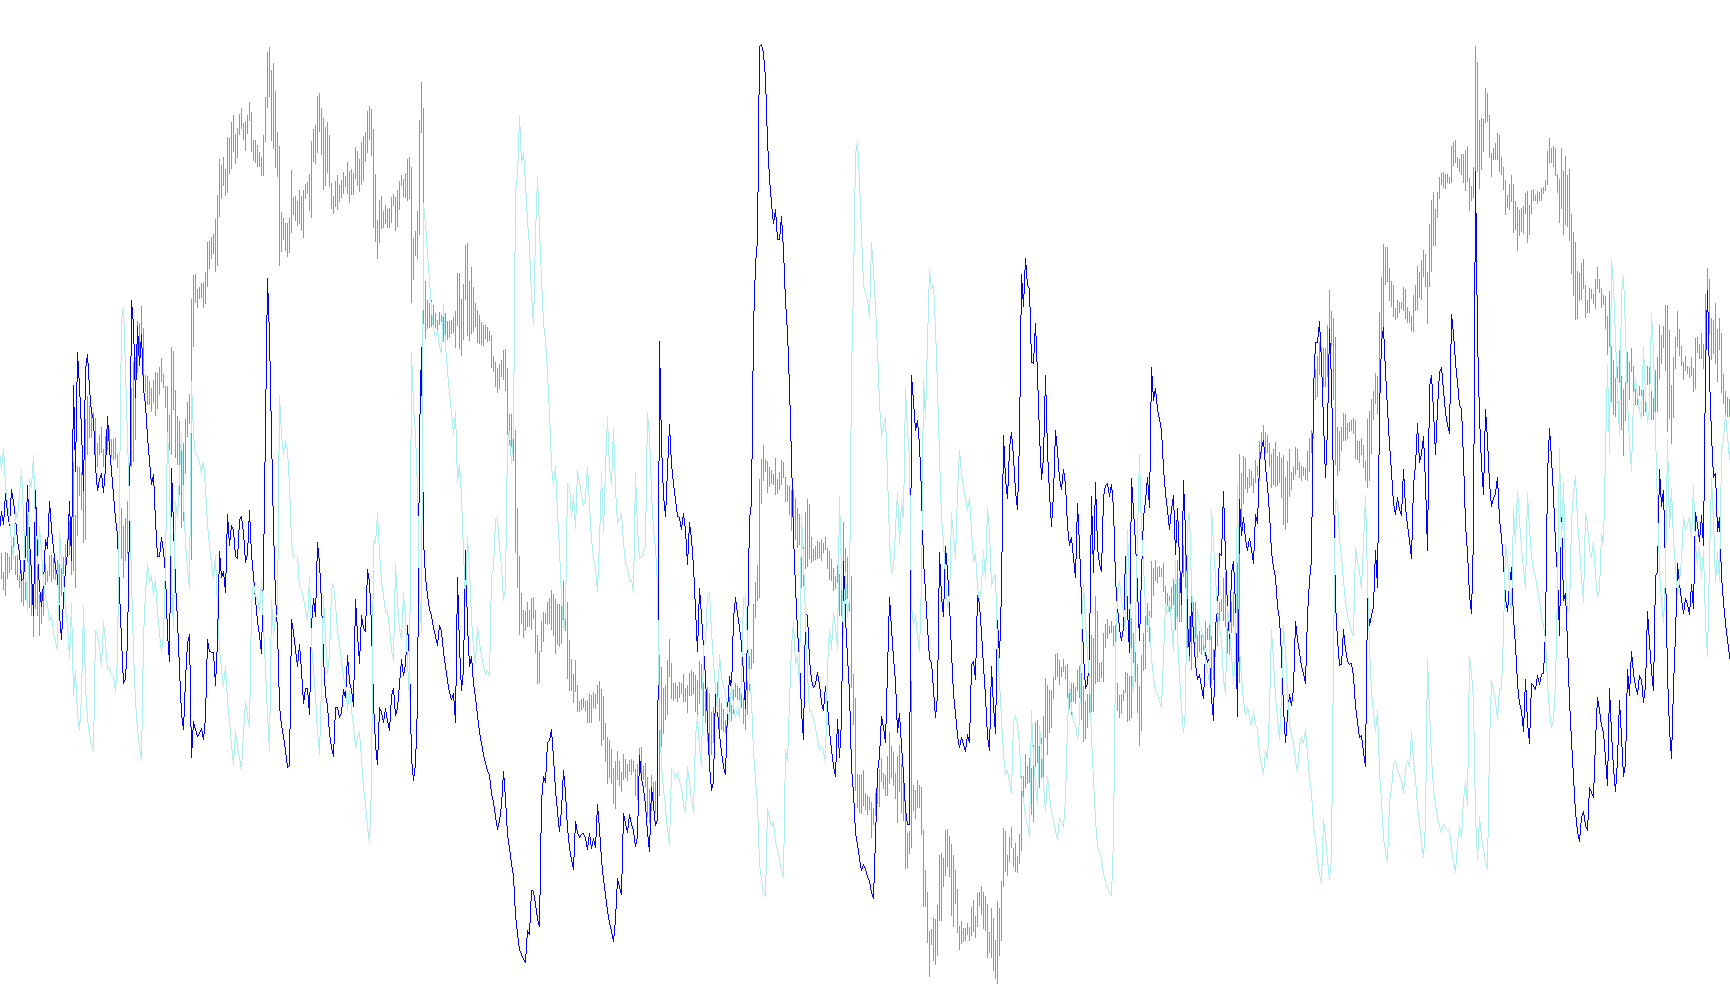
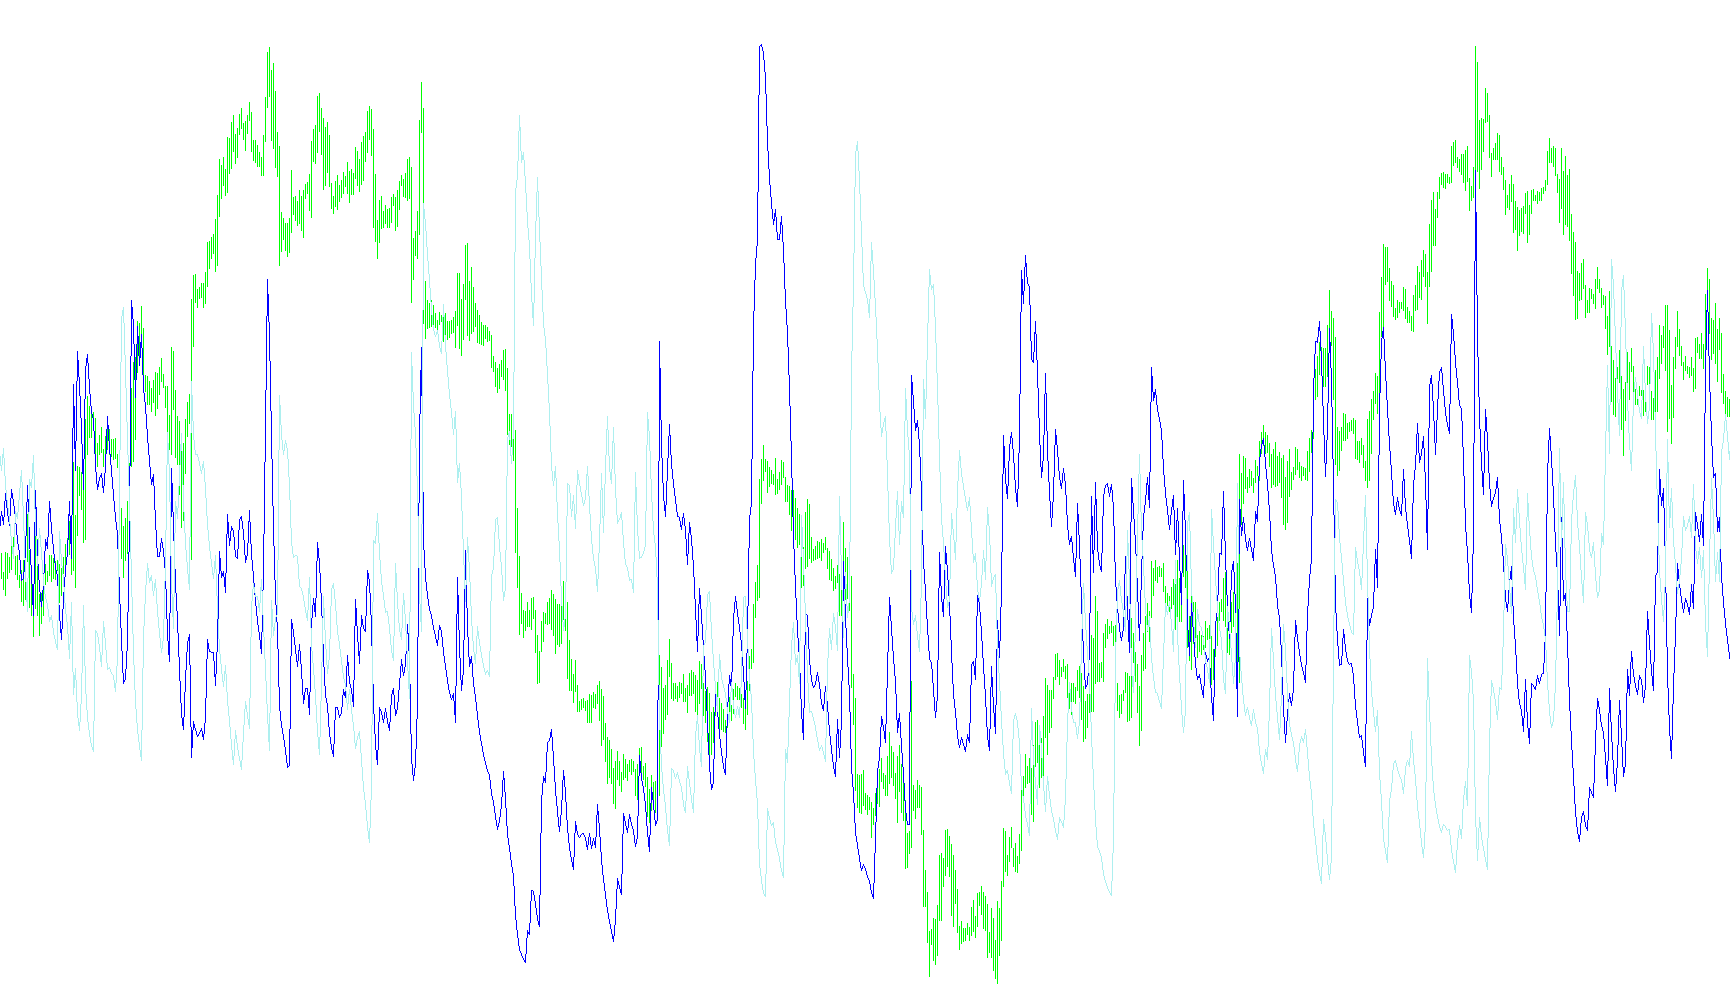
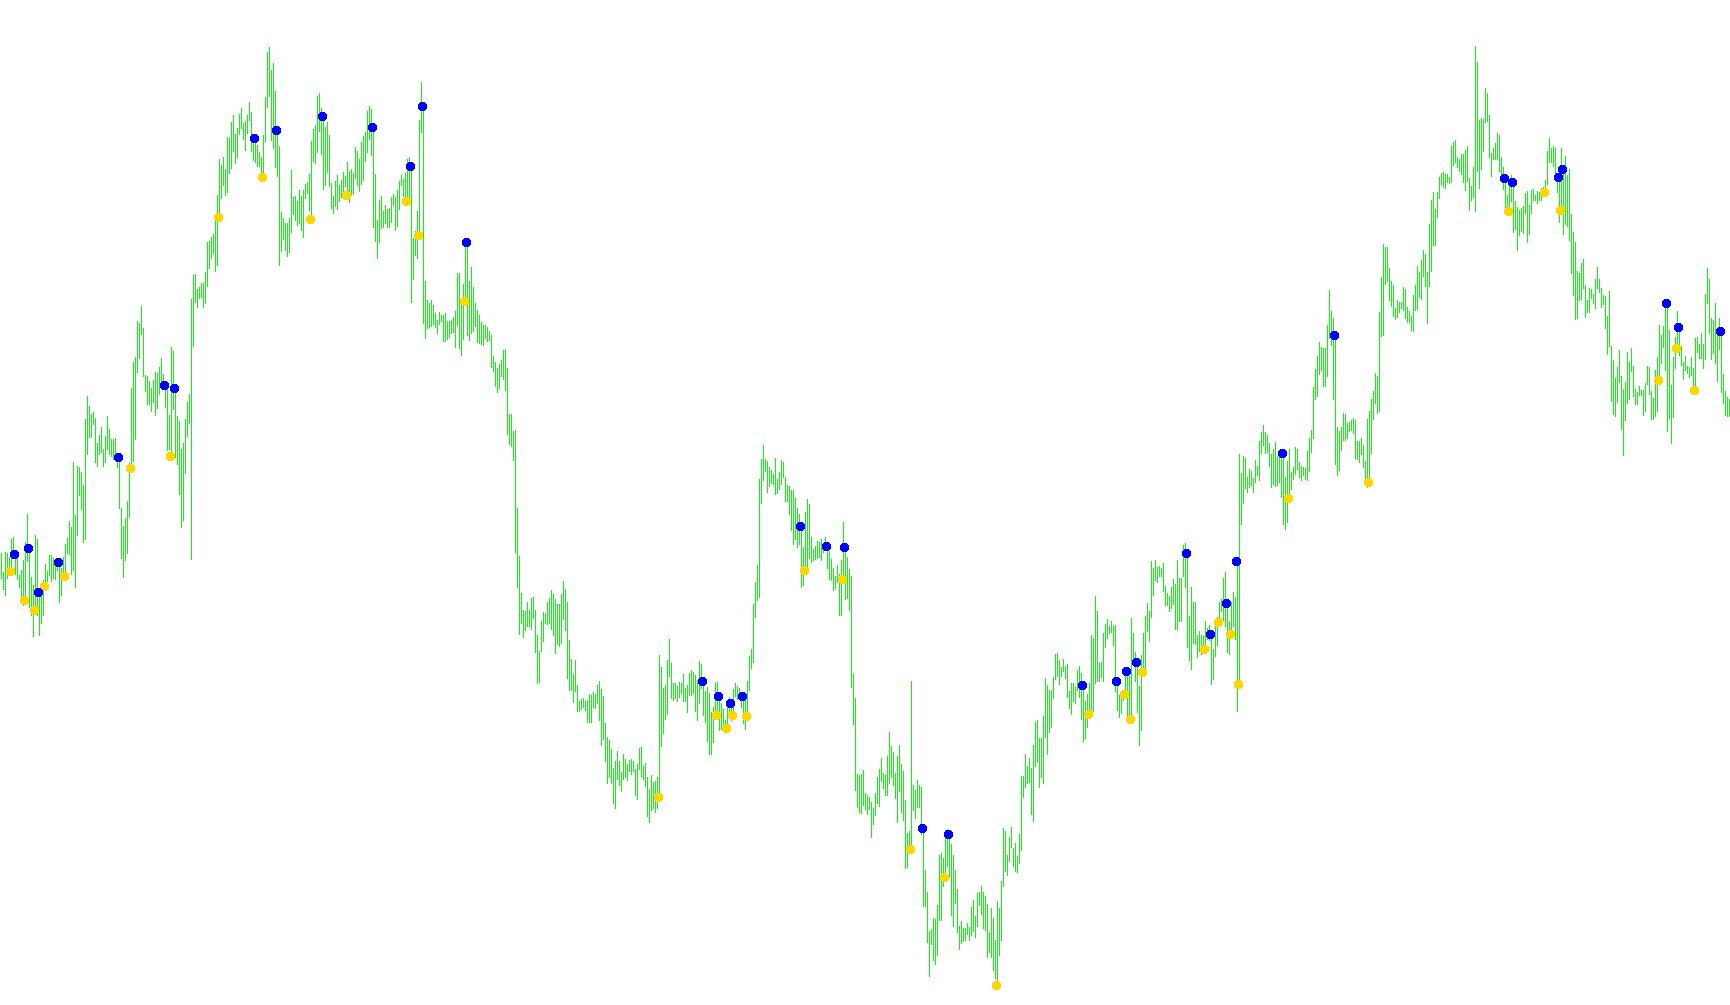
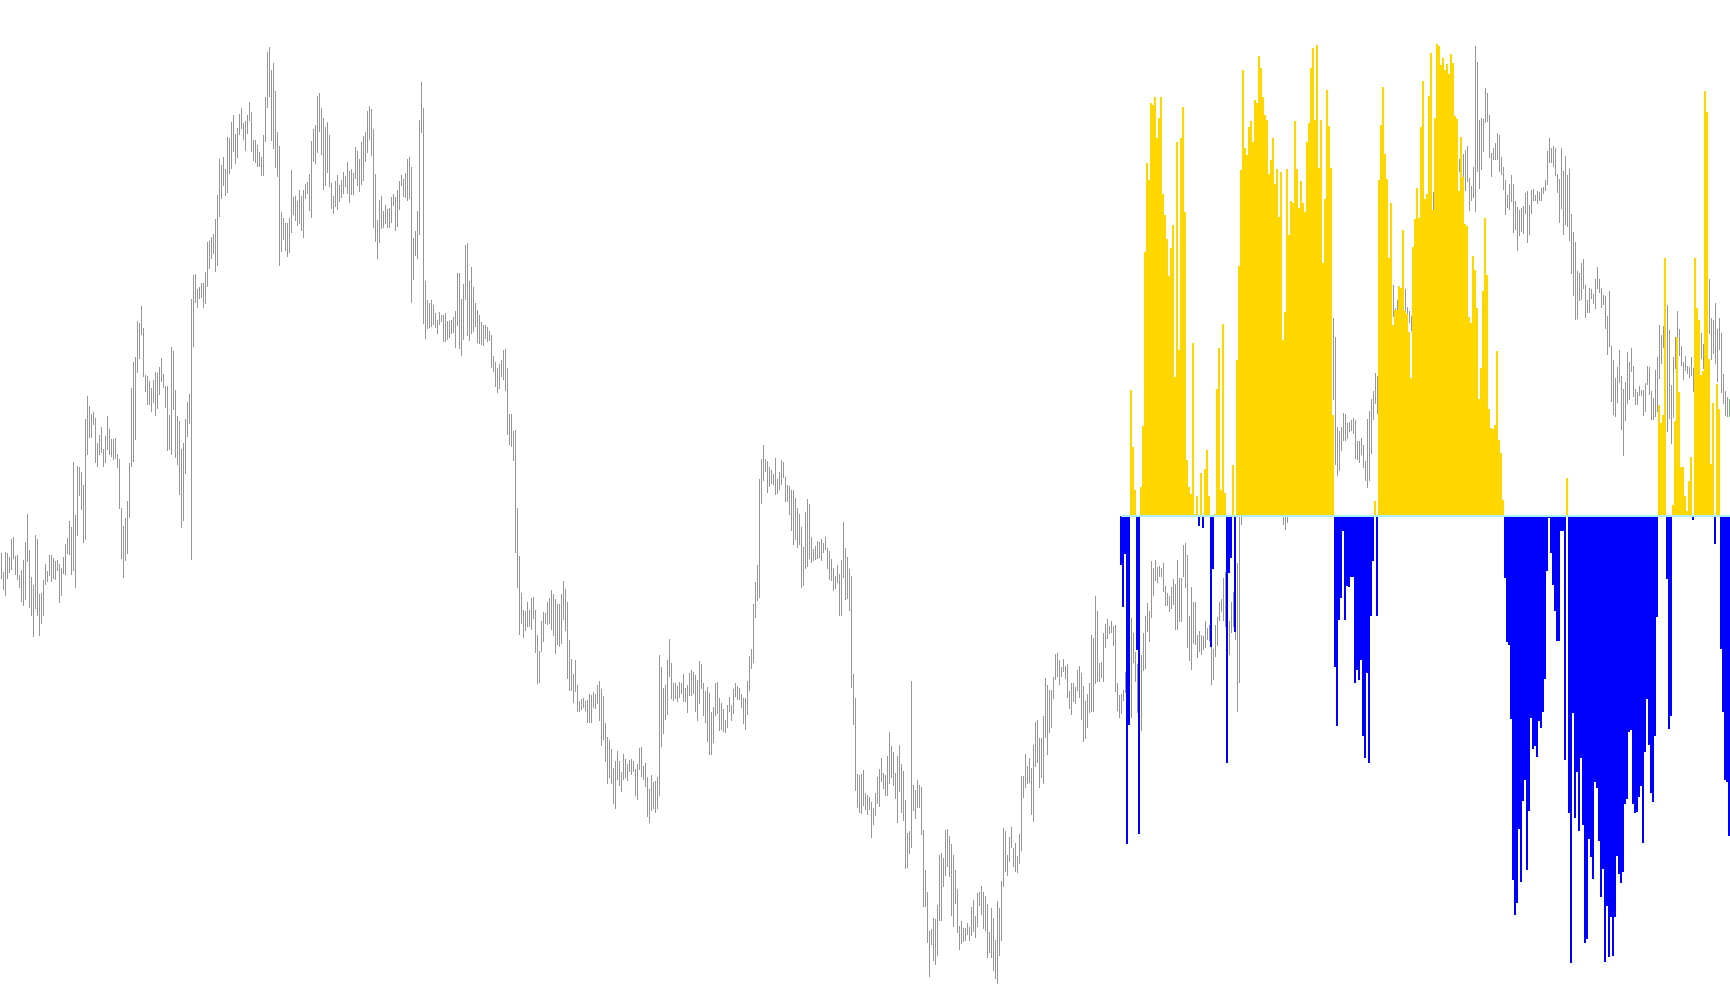
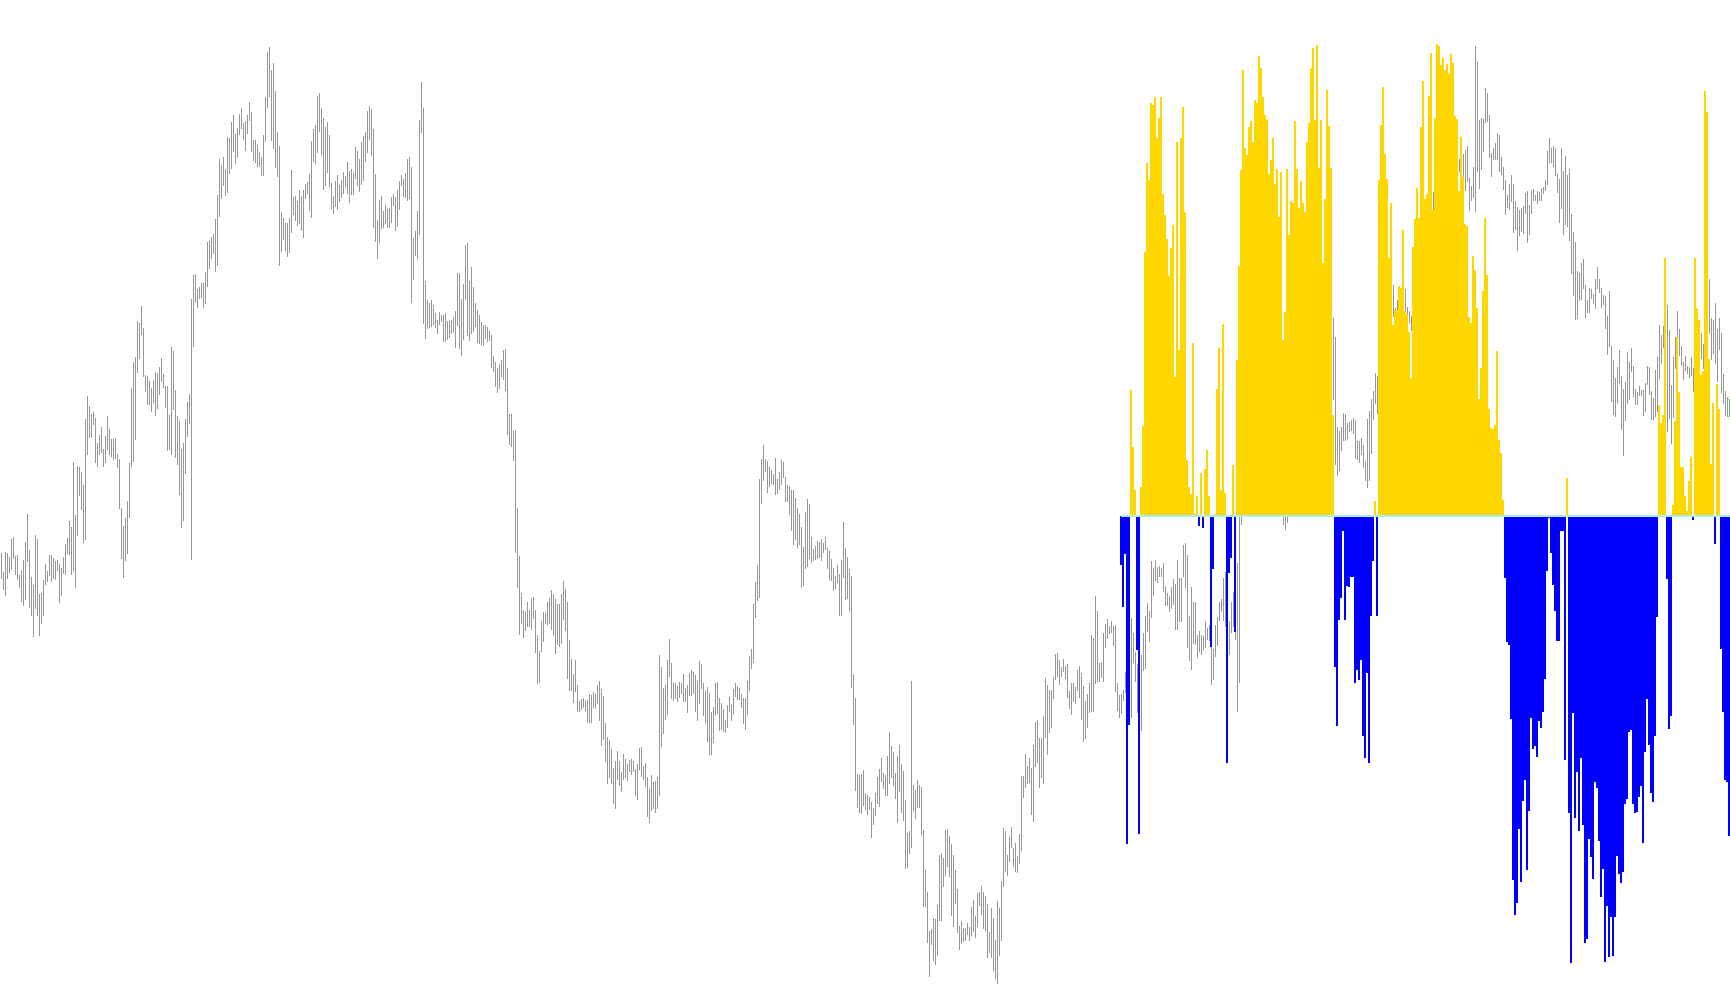
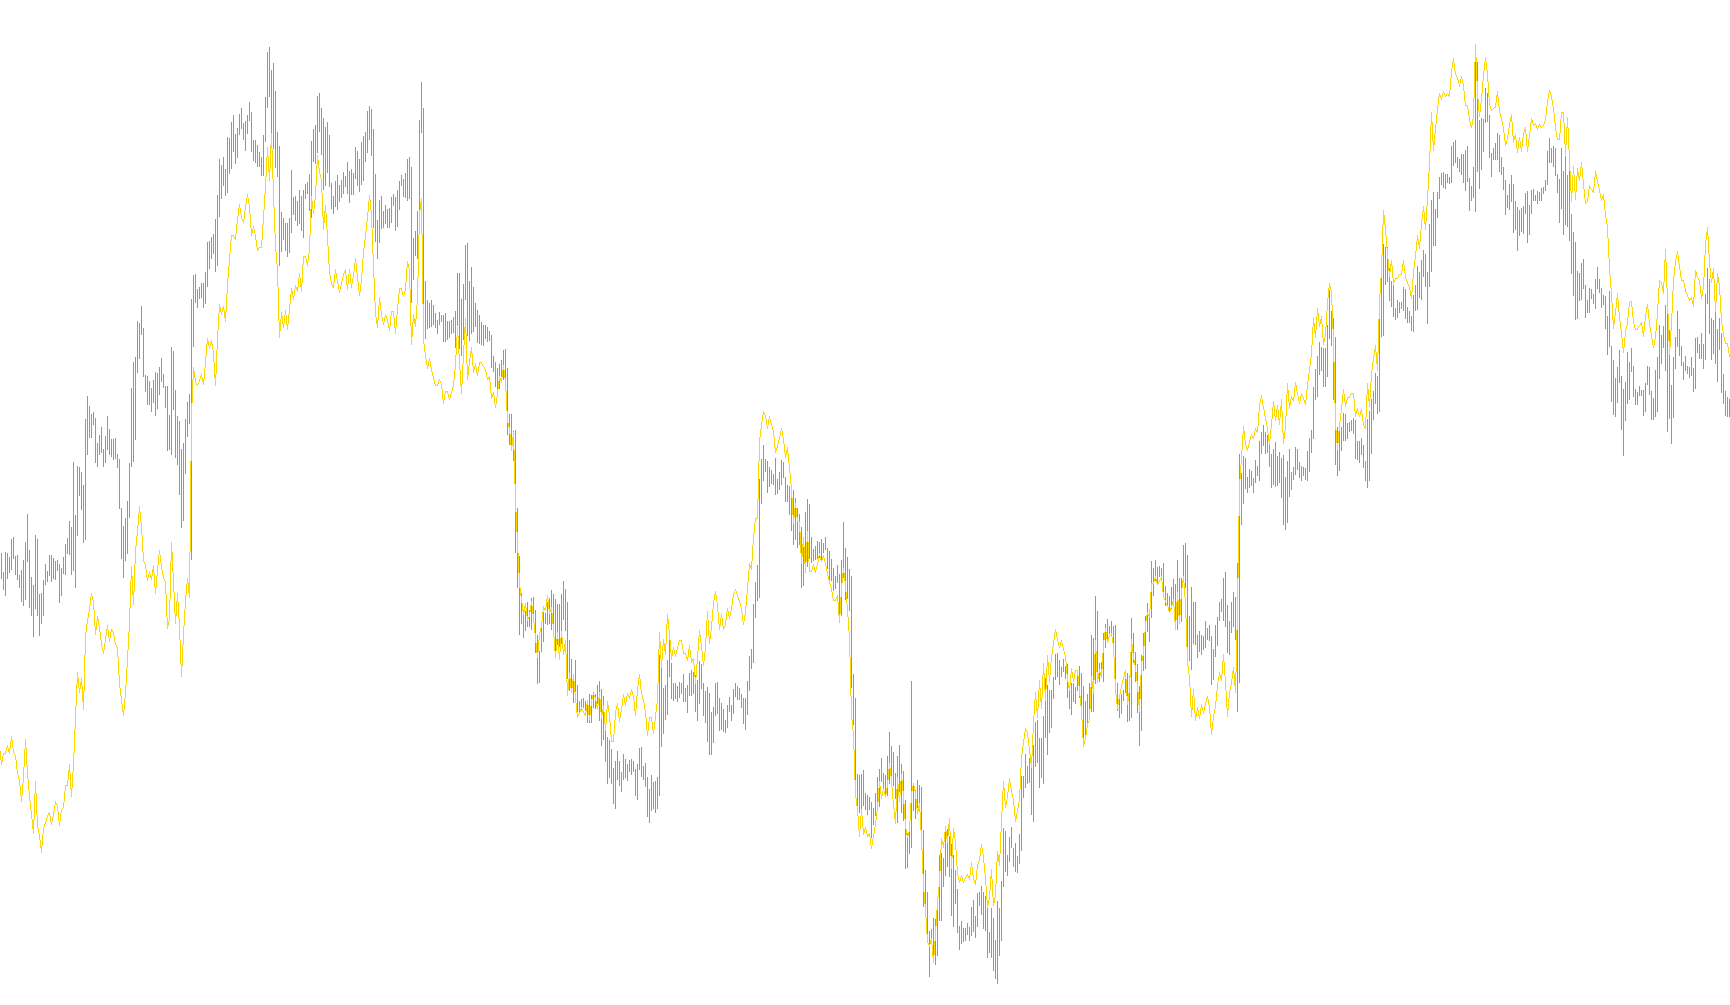
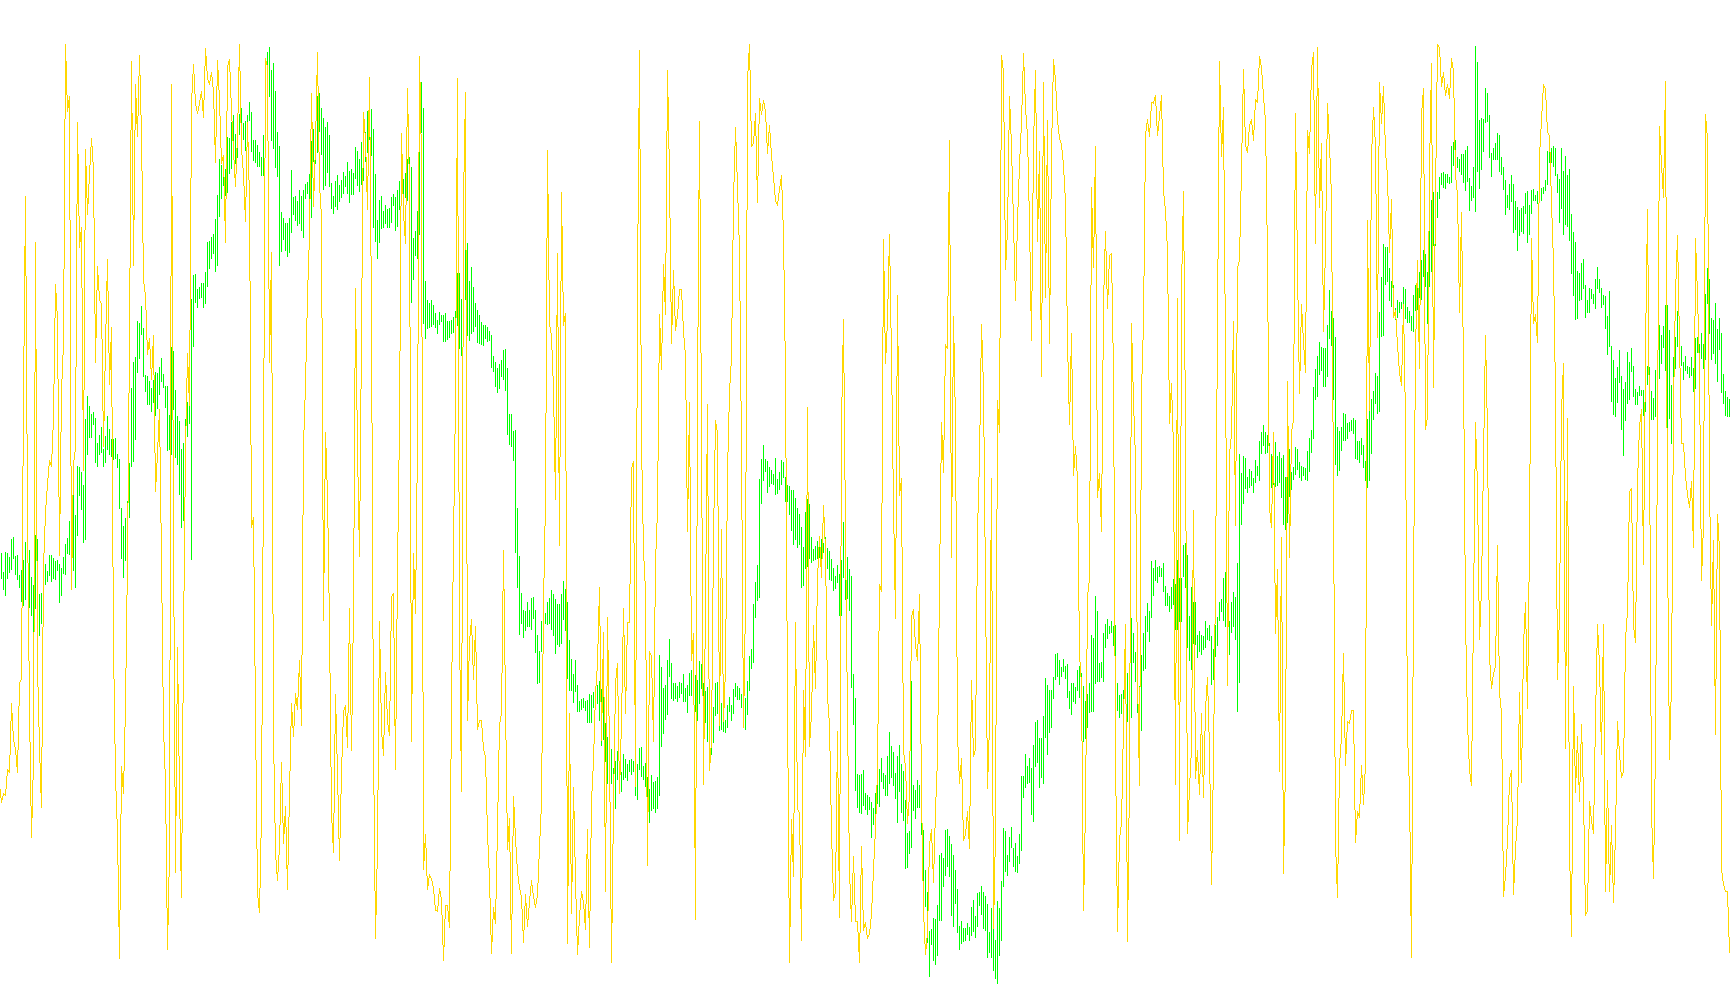
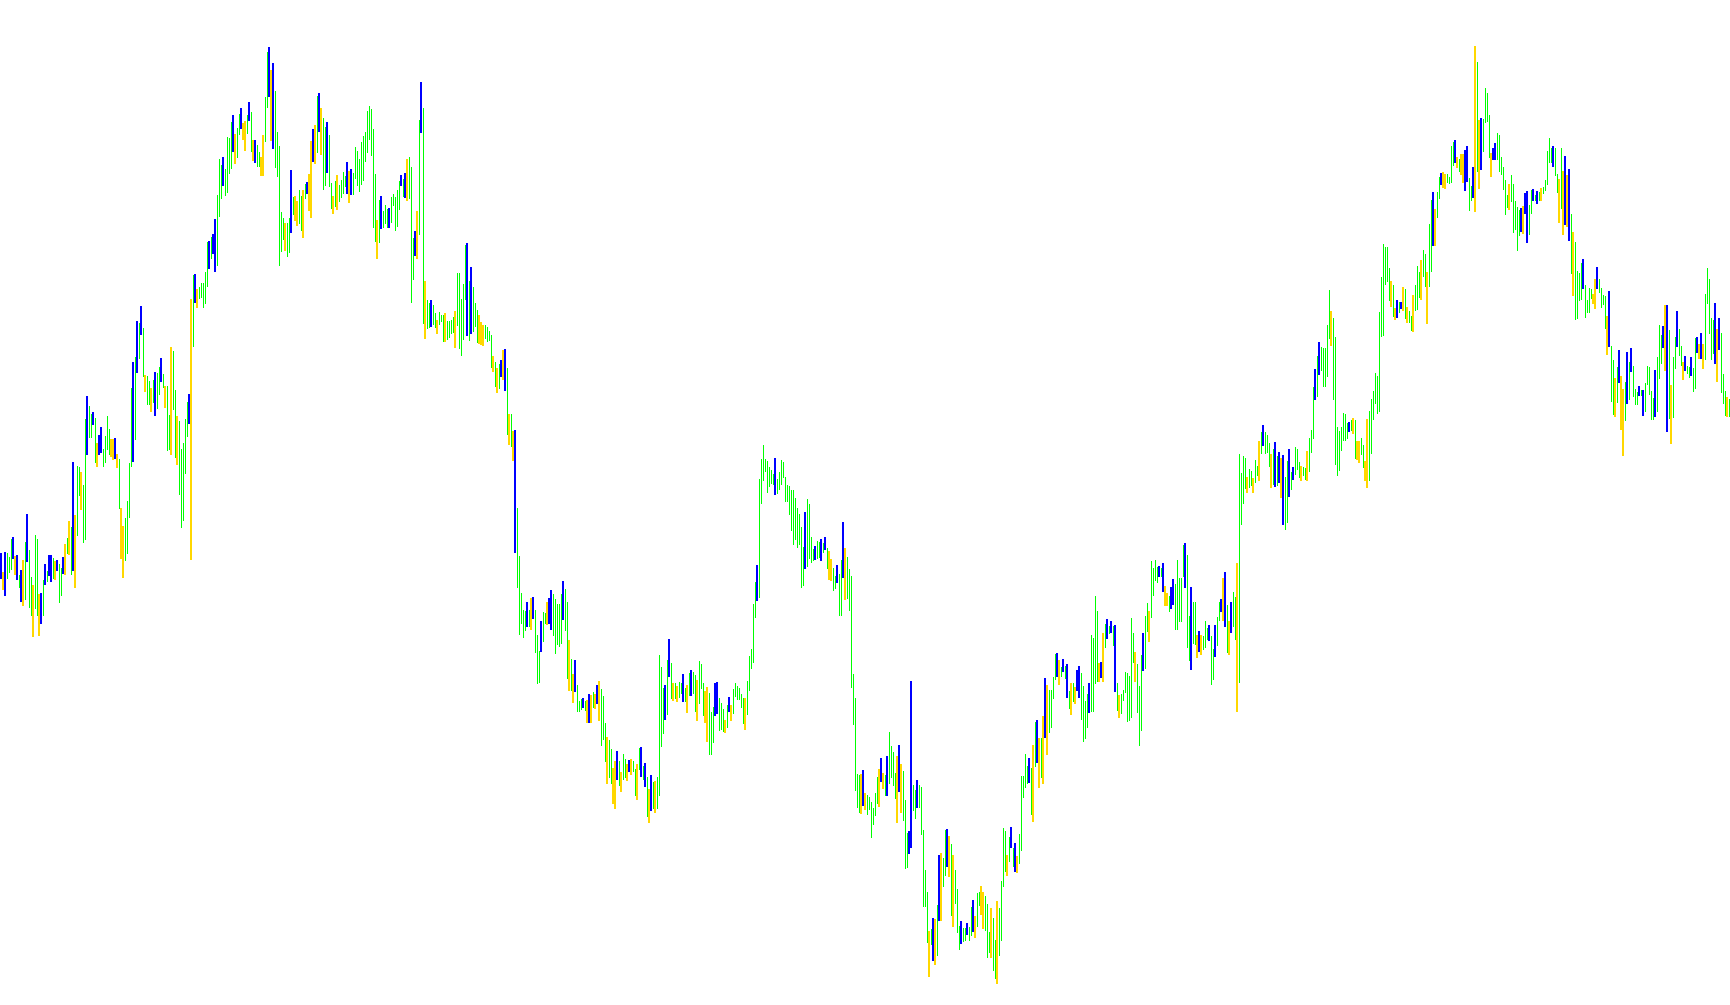
This indicator identifies complex trend and counter-trend opportunities by analyzing Commodity Channel Index (CCI) dynamics through eight distinct logic modules, including zero-line rejections, trendline breakouts, and reversal divergences.

WcciPatterns_v1Alert
Indicator

WcciPatterns_v1Alert

iCCI

This indicator identifies diverse market conditions by analyzing Commodity Channel Index (CCI) fluctuations to detect trend following signals, counter-trend reversals, and dynamic trendline breakouts.

WcciPatterns_v2
Indicator

WcciPatterns_v2

iCCI

This indicator identifies multiple sophisticated momentum and structural patterns—including trendline breaks, zero-line rejects, and reversal divergences—by analyzing the geometric behavior of dual Commodity Channel Index (CCI) periods.

Indicator

WCCISqueeze v1

iCCIiATRiStdDev
WCCI_v1
Indicator

WCCI_v1

iCCI

This indicator calculates and visualizes the divergence between two distinct Commodity Channel Index (CCI) periods to identify momentum shifts and potential trend reversals.

Weekly Pivot Fibo
Indicator

Weekly Pivot Fibo

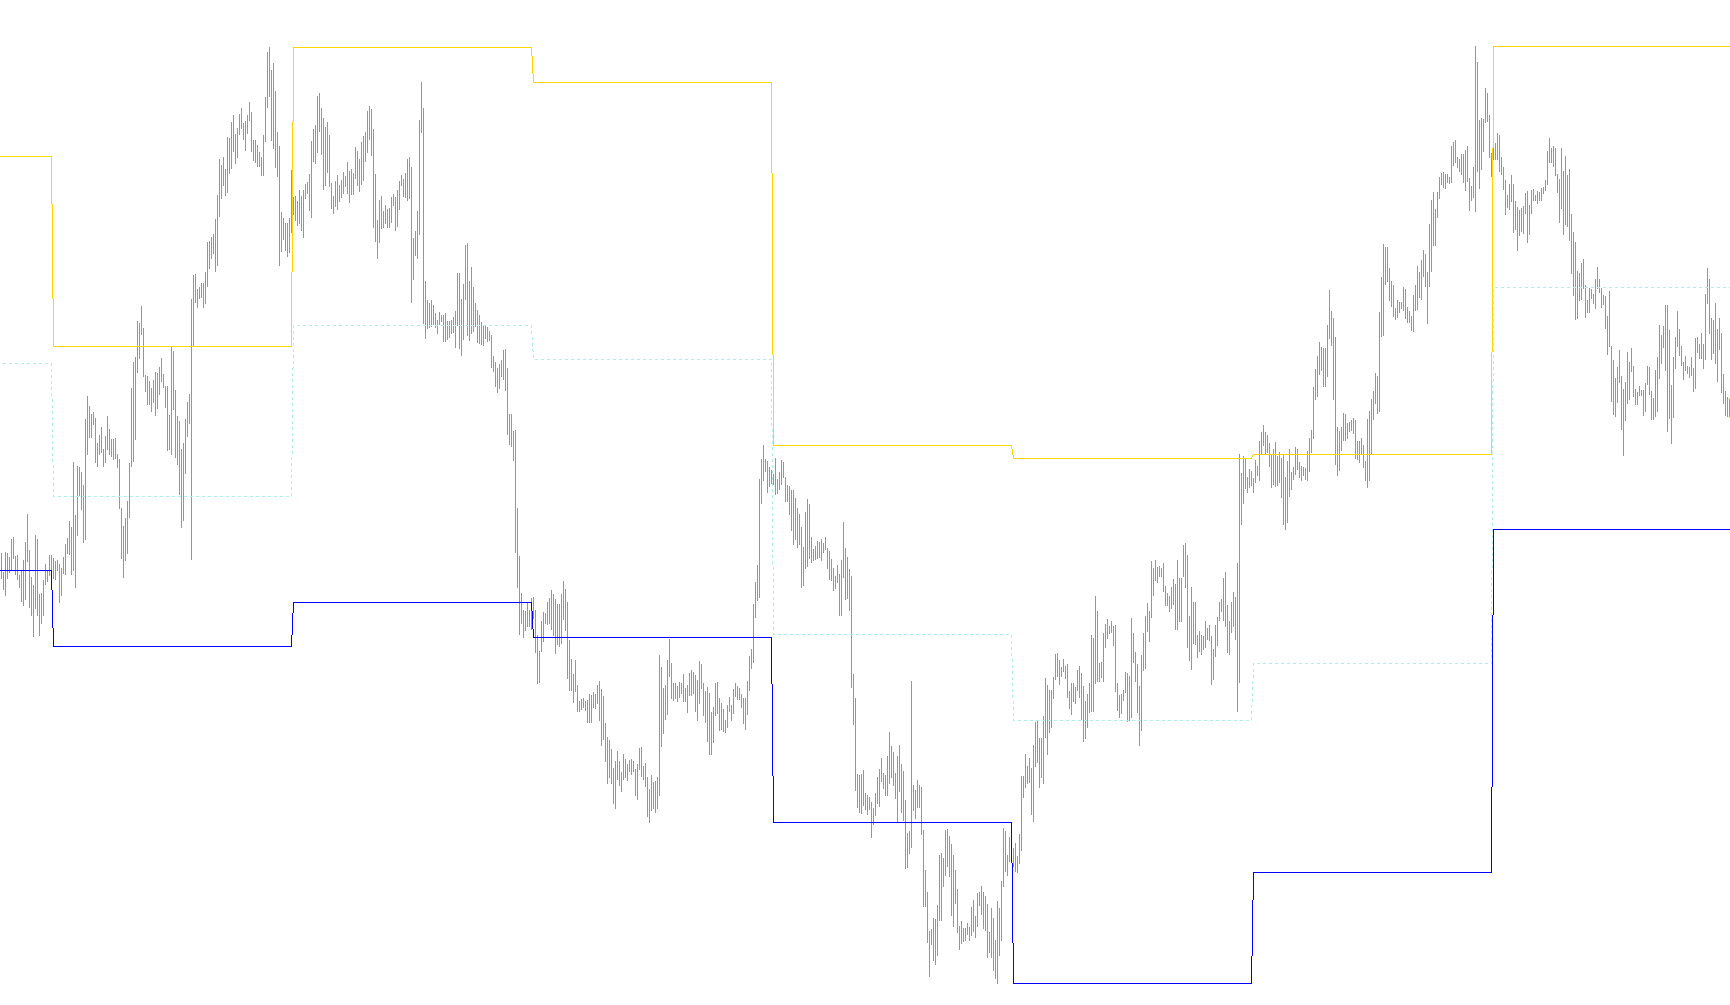
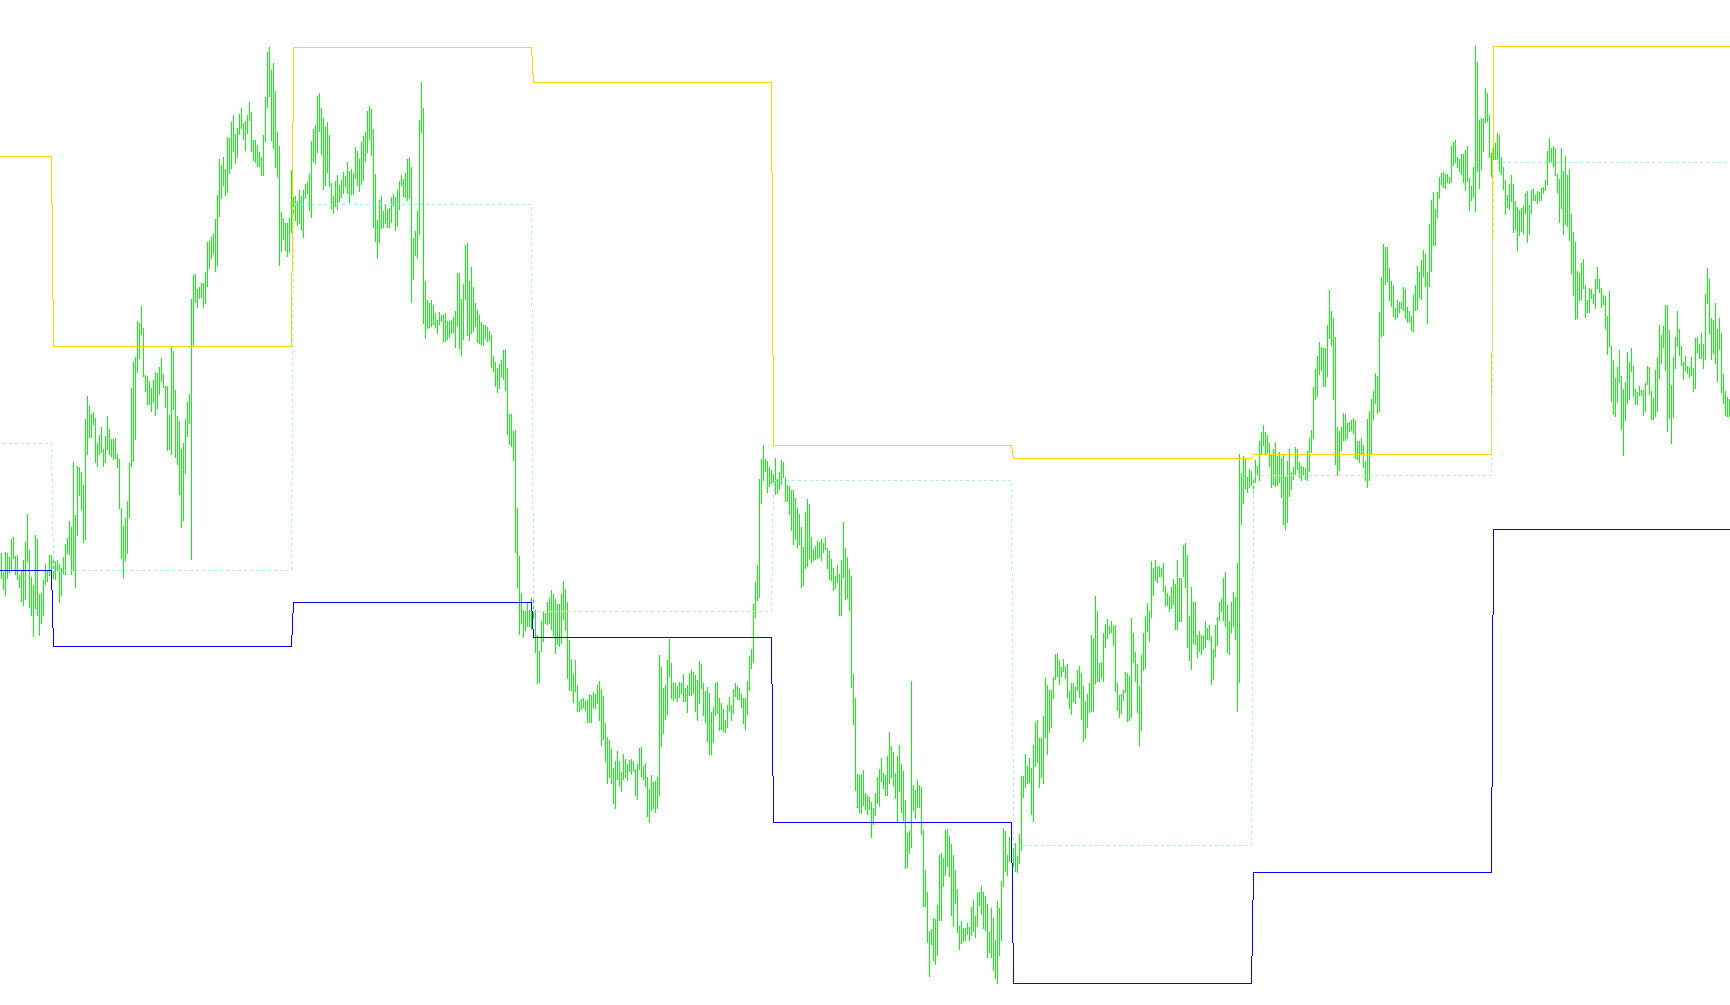
This indicator projects a comprehensive range of support and resistance levels by applying Fibonacci expansion coefficients to the previous week's price action.

WeeklyPivot
Indicator

WeeklyPivot

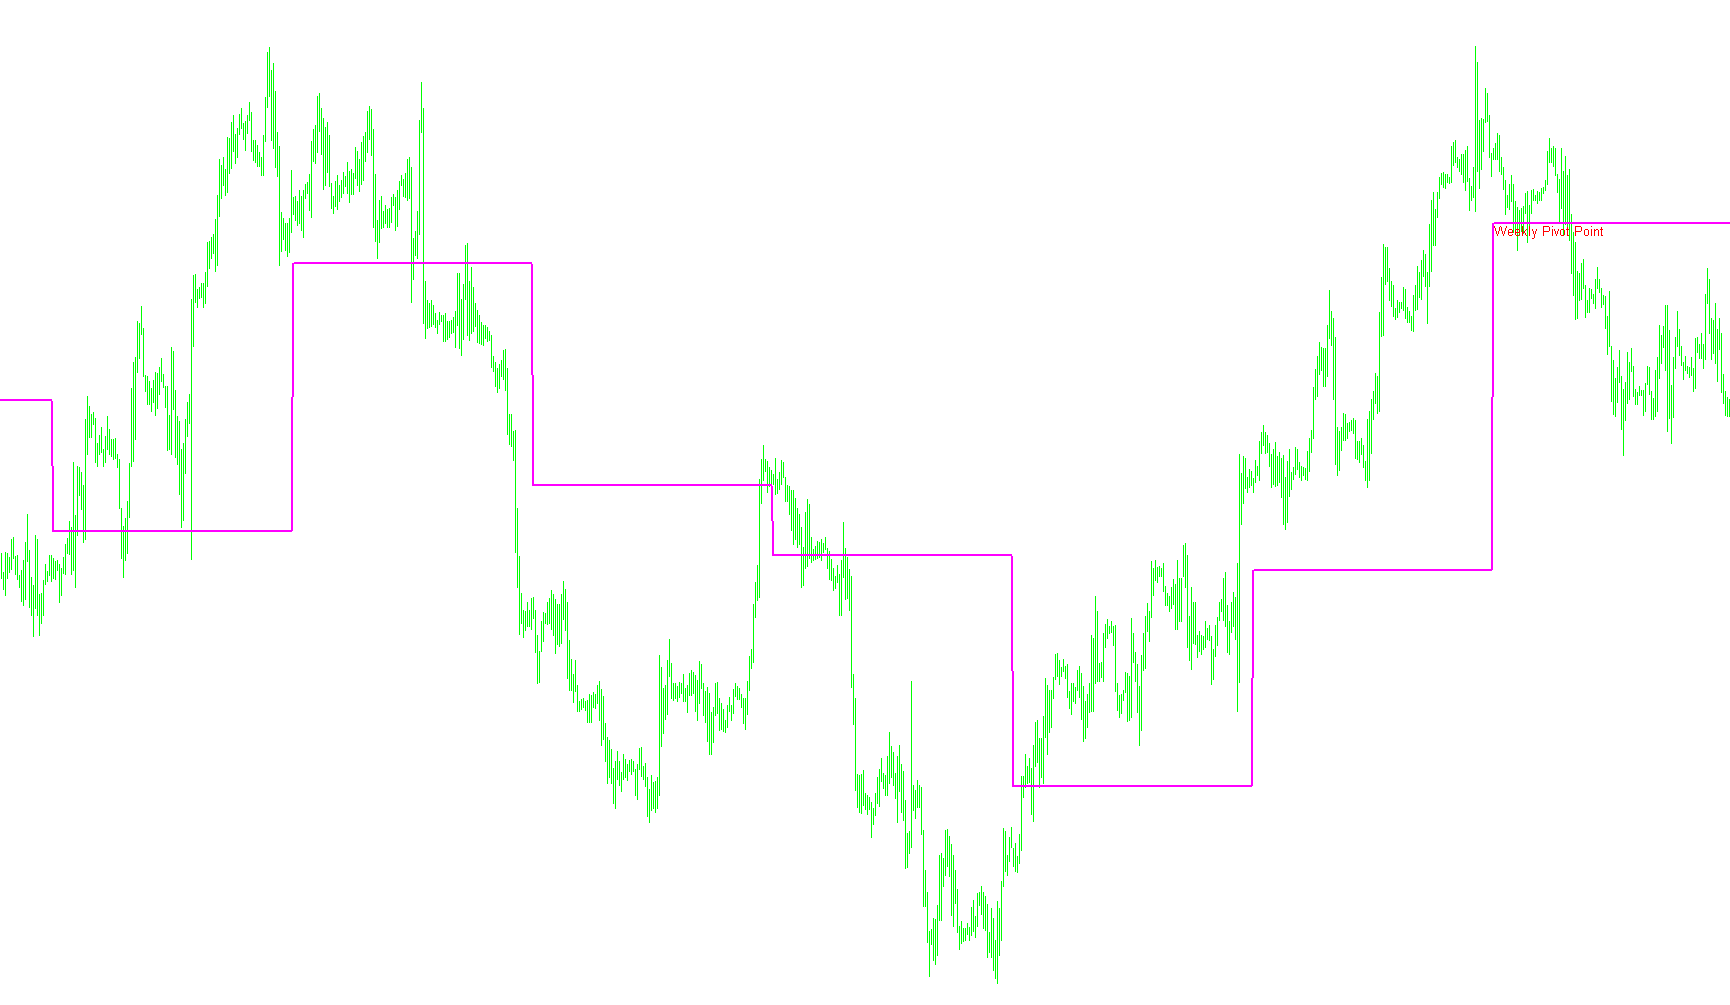
Calculates and plots weekly support and resistance levels by aggregating previous week high-low boundaries with current period opening data.

WeeklyPivotOnly[1]
Indicator

WeeklyPivotOnly[1]

This indicator dynamically projects horizontal support and resistance levels based on weekly price action extremes and opening values to identify potential reversal zones.

WeeklyPivotOnly[1]_v1
Indicator

WeeklyPivotOnly[1]_v1

This indicator projects weekly support and resistance levels by calculating the geometric mean of previous week extremes and current week opening price data.

WeeklyPivot_001
Indicator

WeeklyPivot_001

Calculates and projects weekly pivot points, support levels, and resistance zones based on the previous week's high, low, close, and current open price.

WeeklyPivot_002
Indicator

WeeklyPivot_002

This indicator calculates weekly floor pivots and multi-tier support/resistance levels by averaging previous week extremes with current session openings.

WeeklyPivot_v1
Indicator

WeeklyPivot_v1

Calculates weekly support and resistance levels by averaging previous period extremes with the current week's opening price.

WeeklyPivot_v2
Indicator

WeeklyPivot_v2

This indicator projects dynamic weekly support and resistance levels by calculating price anchors based on previous week highs, lows, opens, and closes.

weekly_high_low- LA
Indicator

weekly_high_low- LA

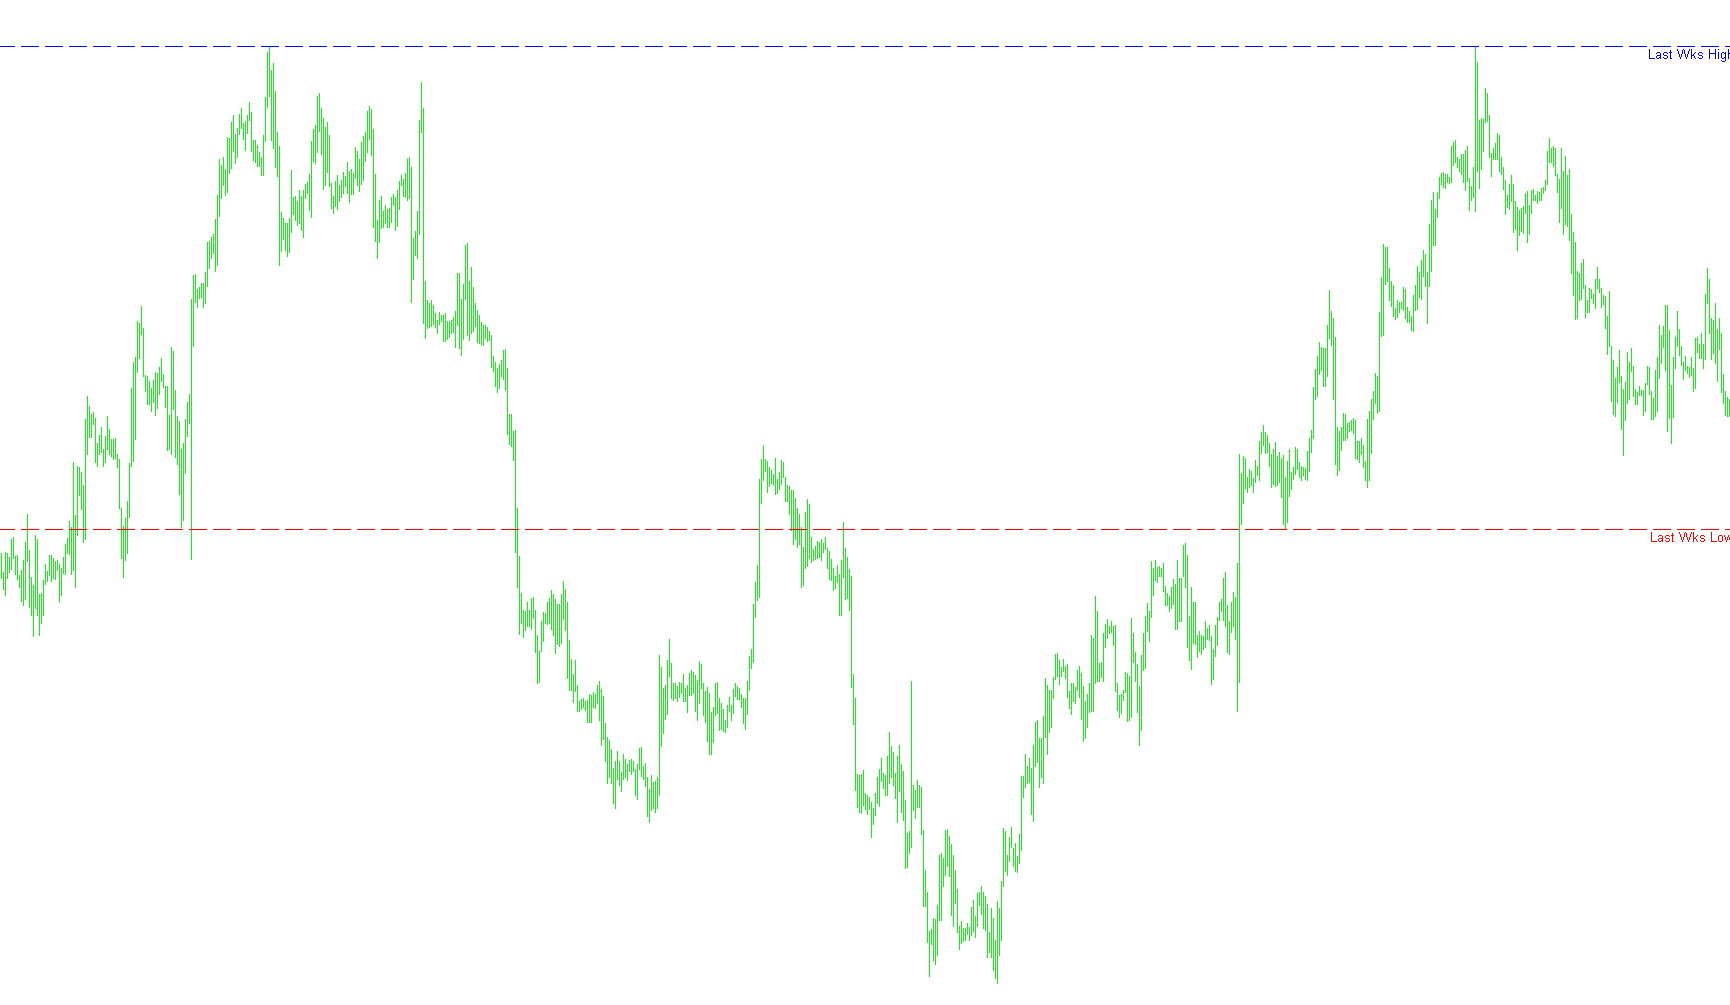
This indicator dynamically plots horizontal levels representing the highest and lowest price points reached during the preceding week's trading session.

weekly_high_low-
Indicator

weekly_high_low-

This indicator identifies and plots horizontal dashed lines representing the highest and lowest price points reached during the previous week's trading session.

Weekly_HILO_Shj
Indicator

Weekly_HILO_Shj

This indicator dynamically plots the high, low, and 50% median levels of the previous week's price action as horizontal reference lines.

Weekly_HILO_Shj_close
Indicator

Weekly_HILO_Shj_close

This indicator dynamically plots the previous week's high, low, and closing price levels as horizontal reference lines to identify significant structural boundaries.

Weekly_HILO_Shj_open
Indicator

Weekly_HILO_Shj_open

Identifies and projects the high, low, and opening price levels from the previous weekly candle onto the current trading period.

Weekly_HILO_Shj_v1
Indicator

Weekly_HILO_Shj_v1

This indicator projects the previous week's high, low, and 50% equilibrium midpoint onto the current chart to identify significant horizontal price zones.

Weekly_Pivots_TZ
Indicator

Weekly_Pivots_TZ

This indicator dynamically projects weekly pivot points, Fibonacci retracements, and Camarilla levels by synchronizing price data with specific destination time zones.

Weighted WCCI
Indicator

Weighted WCCI

iCCIiATR

This indicator dynamically scales the Commodity Channel Index (CCI) using a volatility ratio derived from Average True Range (ATR) to normalize momentum across different market conditions.

WeightedCCI
Indicator

WeightedCCI

iCCIiATR

This indicator calculates a dynamic momentum profile by applying an ATR-based volatility weight to the CCI and Turbo CCI values while enforcing specific boundary constraints.

WeightedCCI2
Indicator

WeightedCCI2

iCCIiATR

This indicator scales standard Commodity Channel Index (CCI) values by a dynamic ratio of short-term to long-term Average True Range (ATR) to normalize momentum against market volatility.

WeightedCCI_v1
Indicator

WeightedCCI_v1

iCCIiATR

This indicator scales the Commodity Channel Index (CCI) by a dynamic volatility ratio derived from ATR differences to identify weighted trend momentum.

wellxAMA
Indicator

wellxAMA

This indicator calculates a Kaufman Adaptive Moving Average that adjusts its sensitivity based on the efficiency ratio of price movement relative to market noise.

wellxAMA_v1
Indicator

wellxAMA_v1

This indicator utilizes a Kaufman Adaptive Moving Average (KAMA) logic to dynamically adjust smoothing based on signal-to-noise ratios, identifying directional shifts via momentum volatility thresholds.

Wick-O-Gram
Indicator

Wick-O-Gram

This indicator quantifies the relative length of upper and lower shadows by calculating the distance between price extremes and the candle body relative to open and close prices.

wick0.2
Indicator

wick0.2

iATR

This indicator quantifies the magnitude of upper and lower price wicks relative to the body, providing visual metrics on price rejection and volatility extremes.

wick0.3
Indicator

wick0.3

iATR

This indicator quantifies price rejection by calculating the distance between candle bodies and extremes, providing a visual representation of upper and lower shadow magnitudes.

Wilder Volatility System
Indicator

Wilder Volatility System

iATR

This indicator projects dynamic price corridors based on local extrema and multiple ATR deviations to identify structural breakout points.

Wilder's ADX
Indicator

Wilder's ADX

This indicator quantifies market directional strength by calculating the relative magnitude of positive and negative price movements against True Range, subsequently smoothing them into Average Directional Index metrics.

Wilder's ADX_v1
Indicator

Wilder's ADX_v1

This indicator quantifies market trend strength and directional bias by calculating the relative velocity of upward and downward price movements against total volatility.

Indicator

Wilder's DMI

WildersDMI_v1.1
Indicator

WildersDMI_v1.1

iMA

This indicator calculates smoothed directional movement and trend strength by applying Wilder's smoothing technique to price range dynamics and relative bull/bear pressure.

WildersDMI_v1
Indicator

WildersDMI_v1

iMA

This indicator calculates directional movement and trend strength by applying Wilder's smoothing technique to the Plus/Minus Directional Indicators and Average Directional Index.

Wilder_ADX_Crossing
Indicator

Wilder_ADX_Crossing

This indicator identifies trend reversal points by detecting bullish and bearish crossovers between the Positive and Negative Directional Indicators (DI+ and DI-).

Will-Spread
Indicator

Will-Spread

iMAOnArray

This indicator quantifies the relative pricing gap between two correlated financial instruments by applying an Exponential Moving Average crossover to their normalized ratio.

William36HistogramWalerttest
Indicator

William36HistogramWalerttest

This indicator monitors the Williams %R momentum oscillator to detect overextended price conditions and triggers alerts when the value crosses specific threshold boundaries.

William36HistogramWallerTest
Indicator

William36HistogramWallerTest

This indicator quantifies price position relative to a 40-period range and triggers auditory alerts when momentum shifts cross the zero-line into predefined extreme zones.

William36HistogramWallerTest1
Indicator

William36HistogramWallerTest1

This indicator calculates a modified Williams %R over a 40-period lookback to identify extreme overbought and oversold conditions via visual histogram polarity and automated alerts.

William36HistogramWallerTest1_1
Indicator

William36HistogramWallerTest1_1

This indicator identifies momentum shifts by calculating the relative position of closing prices within a 40-period high-low range and triggering alerts when values cross specific positive and negative thresholds.

William36HistogramWallerTest_v1
Indicator

William36HistogramWallerTest_v1

This indicator quantifies price position relative to a 40-period range to identify overextended momentum reversals and trigger alerts based on specific threshold breaches.

William36HistogramWallerTest_v2
Indicator

William36HistogramWallerTest_v2

This indicator calculates a modified Williams %R momentum score over a 40-period lookback to trigger automated alerts when price extremes cross specific bullish and bearish threshold boundaries.

WilliamsPR_alert
Indicator

WilliamsPR_alert

iWPR

This indicator monitors the Williams Percent Range to identify oversold and overbought exhaustion points, triggering notifications when price momentum hits extreme boundary thresholds.

Williams_Accumulation_Distribution
Indicator

Williams_Accumulation_Distribution

This indicator quantifies the cumulative net flow of capital by calculating price discrepancies between current and previous closing values relative to historical price boundaries.

Williams_Percent_Range
Indicator

Williams_Percent_Range

Quantifies price position within a specific high-low range to identify overbought and oversold extremes.

Wilson Channels
Indicator

Wilson Channels

iDeMarkeriMFIiRSIiStochastic

This indicator maps various momentum oscillators to absolute price coordinates to project potential exhaustion zones and reversal levels directly on the chart.

Indicator

wip

iStochastic
Wiseman 1
Indicator

Wiseman 1

Identifies bullish and bearish momentum shifts by detecting discrepancies between price extremes and the bar's median closing position.
Indicator

Wiseman Horizon

iAlligator