wlxBWWiseMan-2_v2
Download script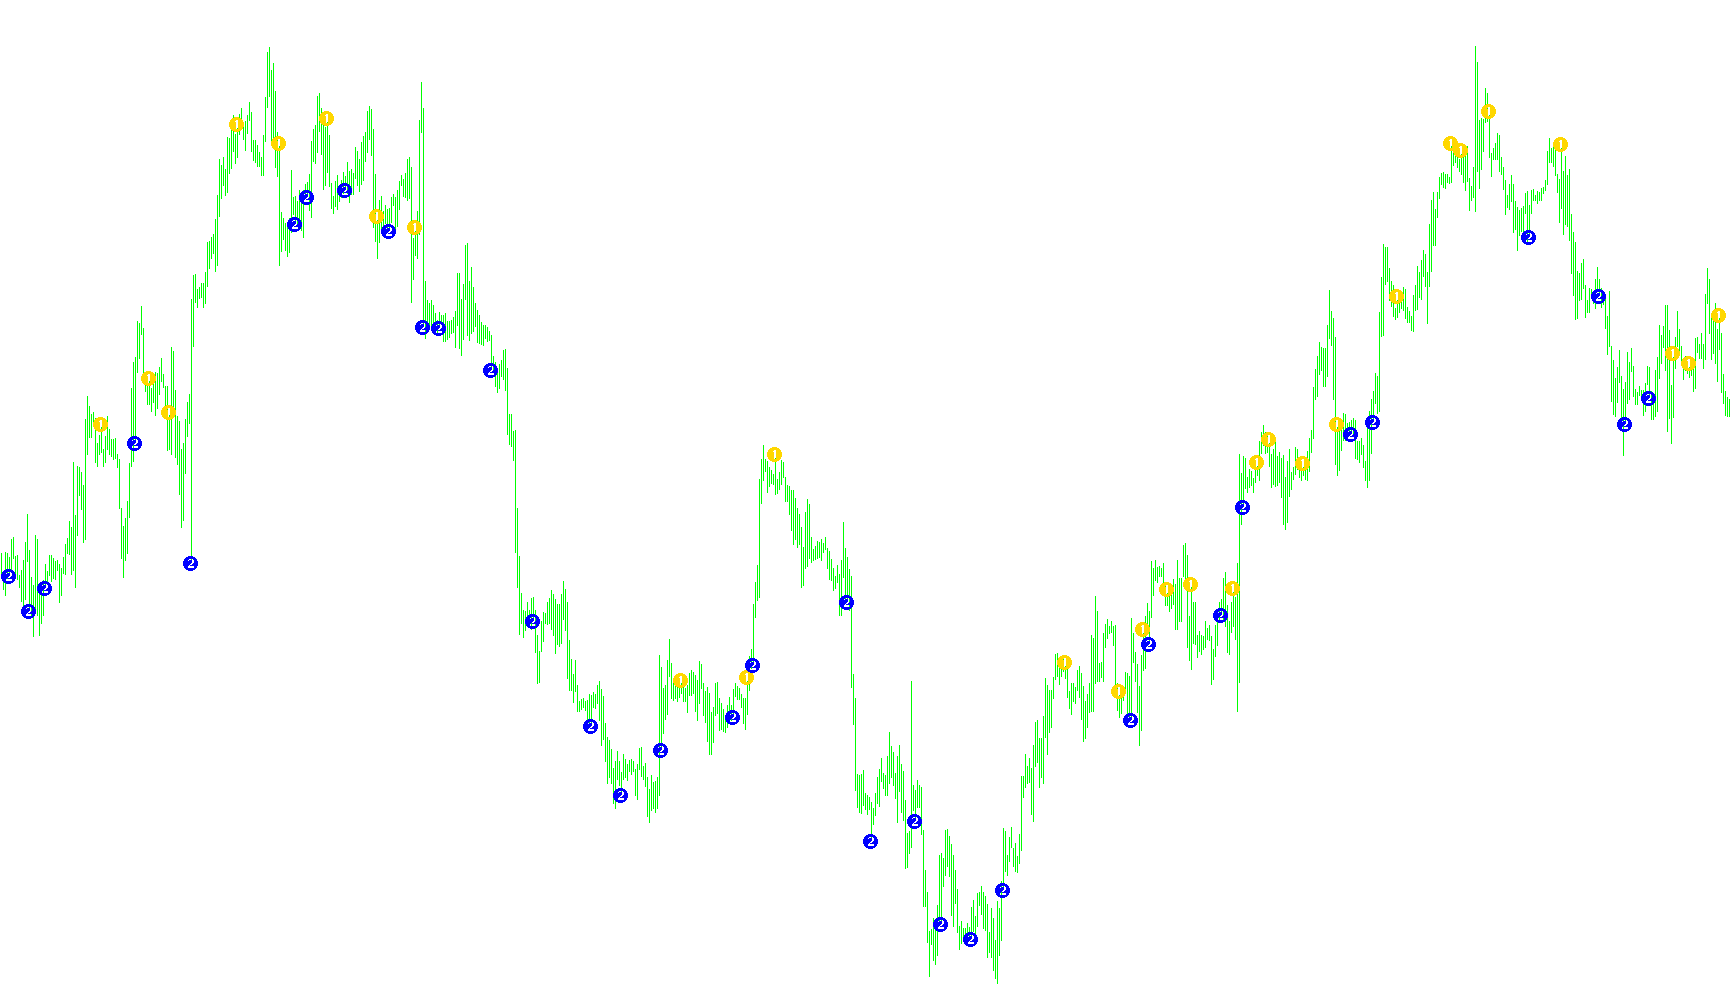
This tool is designed as a visual trading aid for the MetaTrader platform, specifically engineered to identify potential trend reversals by analyzing price momentum. Instead of cluttering your screen with complex graphs, it provides clear, actionable signals in the form of visual arrows on your chart.
Core Logic and Functionality
The script operates by monitoring a specific momentum indicator called the "Awesome Oscillator" (AO). It looks back at a series of recent data points to identify very specific patterns in how price strength is shifting.
How it identifies Buy Signals: The tool scans for a unique "mountain" or "peak" pattern in positive momentum. Specifically, it looks for a situation where:
- The momentum values are currently above zero (indicating a bullish environment).
- The momentum follows a precise sequence of decreasing then increasing values across five consecutive data points.
- When this specific structural shift occurs, the script places a Blue Arrow above the price candle, suggesting a potential upward movement or trend continuation.
How it identifies Sell Signals: Conversely, the tool searches for a "valley" or "trough" pattern in negative momentum. It looks for:
- Momentum values that are currently below zero (indicating a bearish environment).
- A sequence where the momentum values rise and then fall across five consecutive data points.
- When this specific structural shift is detected, the script places a Red Arrow below the price candle, signaling a potential downward movement or trend reversal.
Key Features for Traders
- Visual Clarity: By using arrows rather than lines, the tool allows you to see exactly where the logic identifies a "trigger" point without having to interpret complex underlying math manually.
- Customizable Sensitivity: The script includes a user-defined parameter (updown) that allows you to adjust the distance between the arrows and the price candles. This ensures the signals remain clearly visible regardless of your specific timeframe or asset's volatility.
- Historical Analysis: The tool automatically calculates these patterns across historical data, allowing you to review past performance and see how the momentum logic behaved during previous market cycles.
In summary, this script acts as a filter that ignores standard market "noise" and only alerts you when the momentum shows a distinct, multi-point structural shift, helping you identify potential turning points in the market trend.
//+------------------------------------------------------------------+
//|                                               wlxBWWiseMan-2.mq4 |
//|                                          Copyright © 2005, wellx |
//|                                        http://www.metaquotes.net |
//+------------------------------------------------------------------+
#property copyright "Copyright © 2005, wellx"
#property link      "http://www.metaquotes.net"

#property indicator_chart_window
#property indicator_buffers 2
#property indicator_color1 Blue
#property indicator_color2 Red
//---- input parameters
extern int updown = 10;
//---- buffers
double BWWM2Up[];
double BWWM2Down[];
//----
int pos = 0;
double AO, AO1, AO2, AO3, AO4;
//+------------------------------------------------------------------+
//| Custom indicator initialization function                         |
//+------------------------------------------------------------------+
int init()
  {
//---- indicators
   SetIndexBuffer(0, BWWM2Up);
   SetIndexBuffer(1, BWWM2Down);
//----
   SetIndexStyle(0, DRAW_ARROW, 0, 2);
   SetIndexStyle(1, DRAW_ARROW, 0, 2);
//----
   SetIndexArrow(0, 140);
   SetIndexArrow(1, 141);
//----
   IndicatorShortName("StrInd(" + updown + ")");
   SetIndexLabel(0, "StrIndUp");
   SetIndexLabel(1, "StrIndDn");
//----
   return(0);
  }
//+------------------------------------------------------------------+
//| Custor indicator deinitialization function                       |
//+------------------------------------------------------------------+
int deinit()
  {
//----
   return(0);
  }
//+------------------------------------------------------------------+
//| Custom indicator iteration function                              |
//+------------------------------------------------------------------+
int start()
  {
   int cbars = IndicatorCounted();
//----
   if(cbars < 0)
       return(-1);
//----
   if(cbars > 0)
       cbars--;
//----
   if(cbars > (Bars - 40))
       pos = (Bars - 40);
   else
       pos = Bars - cbars;
//----
   while(pos > 0)
     {
       BWWM2Up[pos] = NULL;
       BWWM2Down[pos] = NULL;
       AO = iAO(NULL, 0, pos);
       AO1 = iAO(NULL, 0, pos + 1);
       AO2 = iAO(NULL, 0, pos + 2);
       AO3 = iAO(NULL, 0, pos + 3);
       AO4 = iAO(NULL, 0, pos + 4);
       //----
       if((AO4 > 0.0 && AO3 > 0.0) && (AO4 < AO3 && AO3 > AO2 && AO2 > AO1 && AO1 > AO))
           BWWM2Up[pos] = (High[pos] + updown*Point);
       //----
       if((AO4 < 0.0 && AO3 < 0.0) && (AO4 > AO3 && AO3 < AO2 && AO2 < AO1 && AO1 < AO))
           BWWM2Down[pos] = (Low[pos] - updown*Point);
       pos--;
     }
   return(0);
  }
//+------------------------------------------------------------------+
Comments