wma_cross_3emaRSI
Download script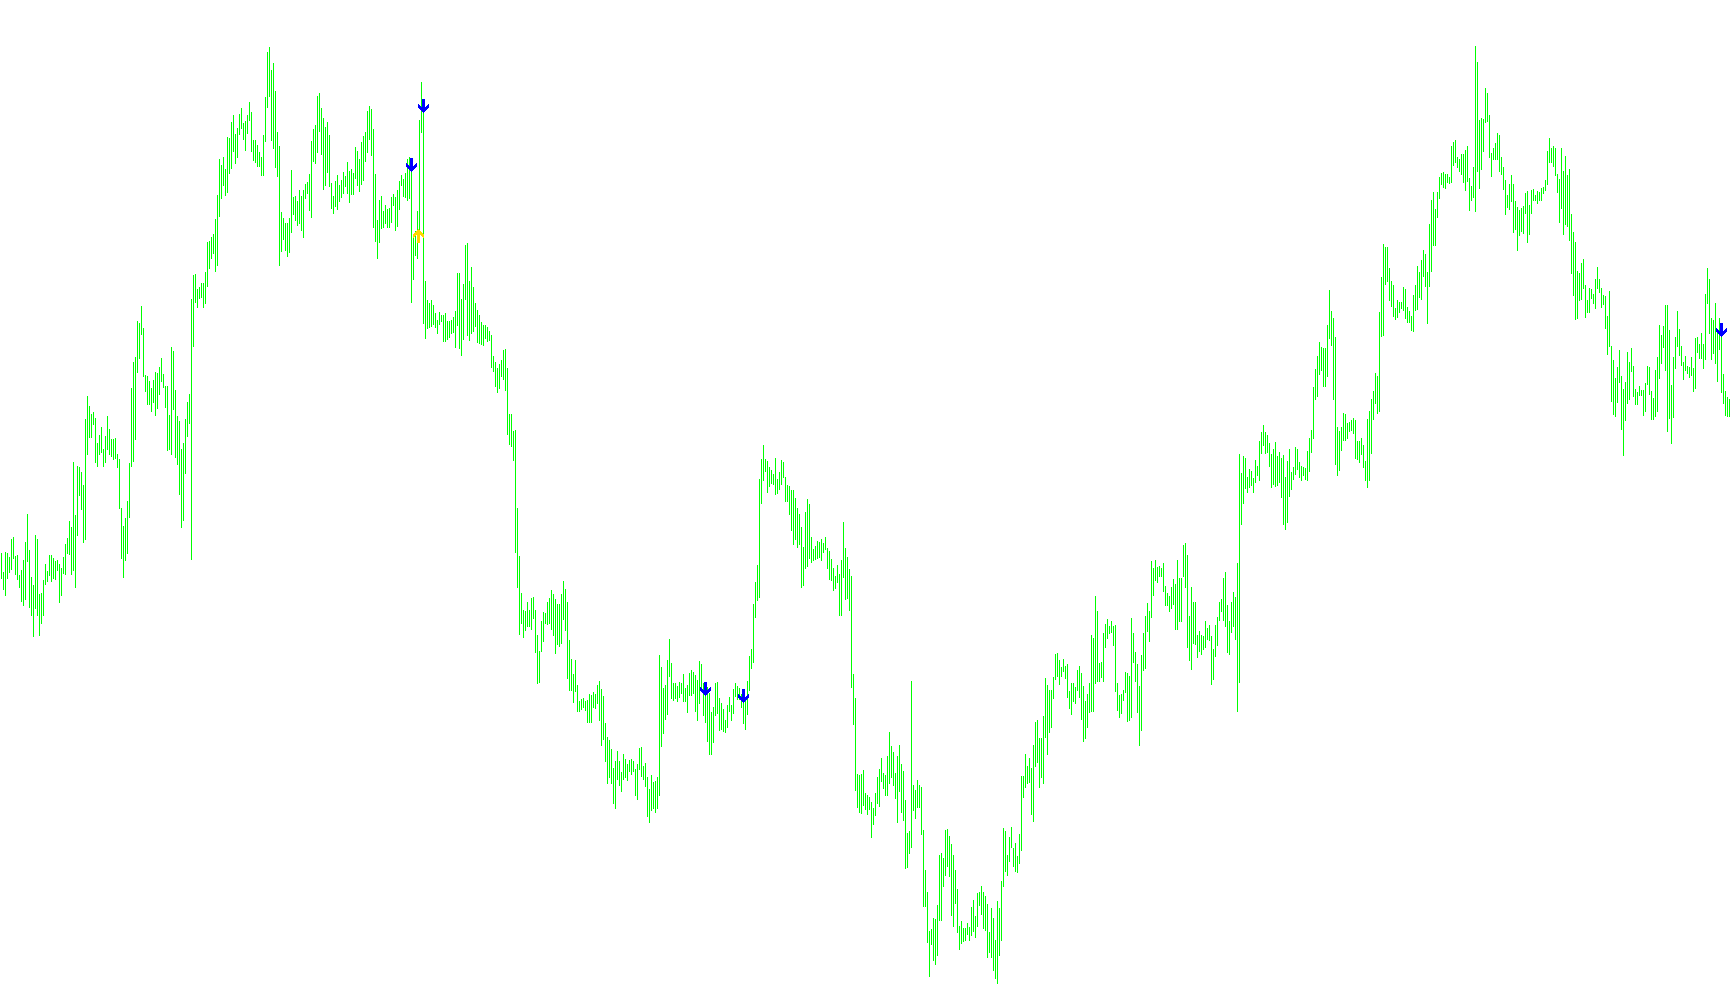
This technical tool is designed to analyze market trends and provide visual signals on a trading chart to help identify potential buying and selling opportunities. It achieves this by monitoring three distinct types of price momentum and strength indicators simultaneously.
Core Logic Overview
The script operates by comparing the relationship between short-term price movements and longer-term averages. It looks for specific "crossover" moments where fast-moving data breaks through slower, more stable trends, combined with a secondary check on market momentum to confirm the strength of the move.
Key Components of the Analysis
To generate a signal, the tool evaluates three main factors:
- Moving Averages (Short, Medium, and Long): The tool calculates several moving averages of different lengths. It specifically looks for instances where a very fast moving average crosses over a medium-length average AND a long-term trend line at the same time. This ensures that the signal isn't just a minor flicker in price, but a meaningful shift in the trend.
- Relative Strength Index (RSI): In addition to the moving averages, the script uses an RSI indicator. This acts as a "momentum filter." It ensures that a buy signal is only triggered when the market shows enough positive momentum, and a sell signal is only triggered when there is sufficient downward pressure.
- Crossover Verification: The logic requires a specific sequence: the fast average must have been below (for a buy) or above (for a sell) the longer averages in the previous bar, but must move across them in the current bar.
Signal Execution
When all conditions are met simultaneously, the script performs the following actions:
- Visual Markers: It places specific arrows on the chart (Up arrows for buying opportunities and Down arrows for selling opportunities).
- Notifications: Depending on your settings, the tool can provide immediate feedback through three different methods:
- Audio Alerts: Playing a sound file when a signal occurs.
- Pop-up Alerts: Sending a text notification with the specific currency pair and timeframe.
- On-Screen Comments: Displaying a written summary on the chart, including the current Bid/Ask prices and the exact date and time of the signal.
Summary for the User
Think of this script as a "trend filter." It ignores minor price noise and only highlights moments where short-term price action confirms a shift against the medium and long-term trends, while also verifying that there is enough momentum behind the move to be significant.
//+------------------------------------------------------------------+
//|                                                                  |
//|                                                          Kalenzo |
//|                                                  simone@konto.pl |
//|                                    Modified by Newdigital        |
//+------------------------------------------------------------------+

#property copyright "Kalenzo"
#property link      "simone@konto.pl"

#property indicator_chart_window
#property indicator_color1 Aqua
#property indicator_color2 Magenta

extern bool UseSound = False;
extern bool TypeChart = False;
extern bool UseAlert = False;
extern string NameFileSound = "alert.wav";
extern double ShortPeriod = 5;
extern int ShortPeriodMode =  1; //0=sma, 1=ema, 2=smma, 3=lwma
extern double BigPeriod = 62;
extern int BigPeriodMode =  1; //0=sma, 1=ema, 2=smma, 3=lwma
extern int MediumPeriod = 13;
extern int MediumPeriodMode =  1; //0=sma, 1=ema, 2=smma, 3=lwma
extern double PeriodRSI = 45;
extern double SellRSILevel = 50;
extern double BuyRSILevel = 50;


#property indicator_buffers 2
//---- input parameters
//---- buffers
double UpBuffer[];
double DnBuffer[];

//+------------------------------------------------------------------+
//| Custom indicator initialization function                         |
//+------------------------------------------------------------------+
int init()
  {
//---- indicators

  // IndicatorBuffers(2);
   SetIndexStyle(0,DRAW_ARROW,EMPTY,1);
   SetIndexStyle(1,DRAW_ARROW,EMPTY,1);

   SetIndexBuffer(0,UpBuffer);
   SetIndexBuffer(1,DnBuffer);

   SetIndexArrow(0,233);
   SetIndexArrow(1,234);

   SetIndexLabel(0,"Up Signal");
   SetIndexLabel(1,"Down Signal");

//----
   return(0);
  }
//+------------------------------------------------------------------+
//| Custor indicator deinitialization function                       |
//+------------------------------------------------------------------+
int deinit()
  {
//----

//----
   return(0);
  }
//+------------------------------------------------------------------+
//| Custom indicator iteration function                              |
//+------------------------------------------------------------------+
int start()
  {

   int limit;
   int counted_bars=IndicatorCounted();
   if(counted_bars<0) counted_bars=0;
   if(counted_bars>0) counted_bars--;
   limit=Bars-counted_bars;


   for(int i = 0 ;i < limit ;i++)
   {
      double pwma5 = iMA(Symbol(),0,ShortPeriod,0,ShortPeriodMode,PRICE_CLOSE,i+1);
      double cwma5 = iMA(Symbol(),0,ShortPeriod,0,ShortPeriodMode,PRICE_CLOSE,i);

      double pwma50 = iMA(Symbol(),0,BigPeriod,0,BigPeriodMode,PRICE_CLOSE,i+1);
      double cwma50 = iMA(Symbol(),0,BigPeriod,0,BigPeriodMode,PRICE_CLOSE,i);

      double pwma20 = iMA(Symbol(),0,MediumPeriod,0,MediumPeriodMode,PRICE_CLOSE,i+1);
      double cwma20 = iMA(Symbol(),0,MediumPeriod,0,MediumPeriodMode,PRICE_CLOSE,i);

      double rsi6=iRSI(NULL,0,PeriodRSI,PRICE_CLOSE,i+1);
      double rsi7=iRSI(NULL,0,PeriodRSI,PRICE_CLOSE,i);

      if( pwma5 <= pwma50 && cwma5 > cwma50 && pwma5 <= pwma20 && cwma5 > cwma20 && rsi7 > BuyRSILevel )

      {
        UpBuffer[i] = iLow(Symbol(),0,i)-(3*Point);
        DnBuffer[i] = EMPTY_VALUE;
      if (UseSound==1) PlaySound(NameFileSound);
      if (UseAlert==1) Alert(Symbol(), "Buy signal", Period());
      if (TypeChart==1) Comment ("Buy signal at Ask=",Ask,", Bid=",Bid,", Date=",TimeToStr(CurTime(),TIME_DATE)," ",TimeHour(CurTime()),":",TimeMinute(CurTime())," Symbol=",Symbol()," Period=",Period());
      }

      else if( pwma5 >= pwma50 && cwma5 < cwma50 && pwma5 >= pwma20 && cwma5 < cwma20 && rsi7 < SellRSILevel )
      {
        UpBuffer[i] = EMPTY_VALUE;
        DnBuffer[i] = iHigh(Symbol(),0,i)+(3*Point);
      if (UseSound==1) PlaySound(NameFileSound);
      if (UseAlert==1) Alert(Symbol(), "Sell signal", Period());
      if (TypeChart==1) Comment ("Sell signal at Ask=",Ask,", Bid=",Bid,", Date=",TimeToStr(CurTime(),TIME_DATE)," ",TimeHour(CurTime()),":",TimeMinute(CurTime())," Symbol=",Symbol()," Period=",Period());
      }
      else
      {
        DnBuffer[i] = EMPTY_VALUE;
        UpBuffer[i] = EMPTY_VALUE;
      }


   }
//----

   return(0);
  }
//+------------------------------------------------------------------+
Comments