WPRfast_v1
Download script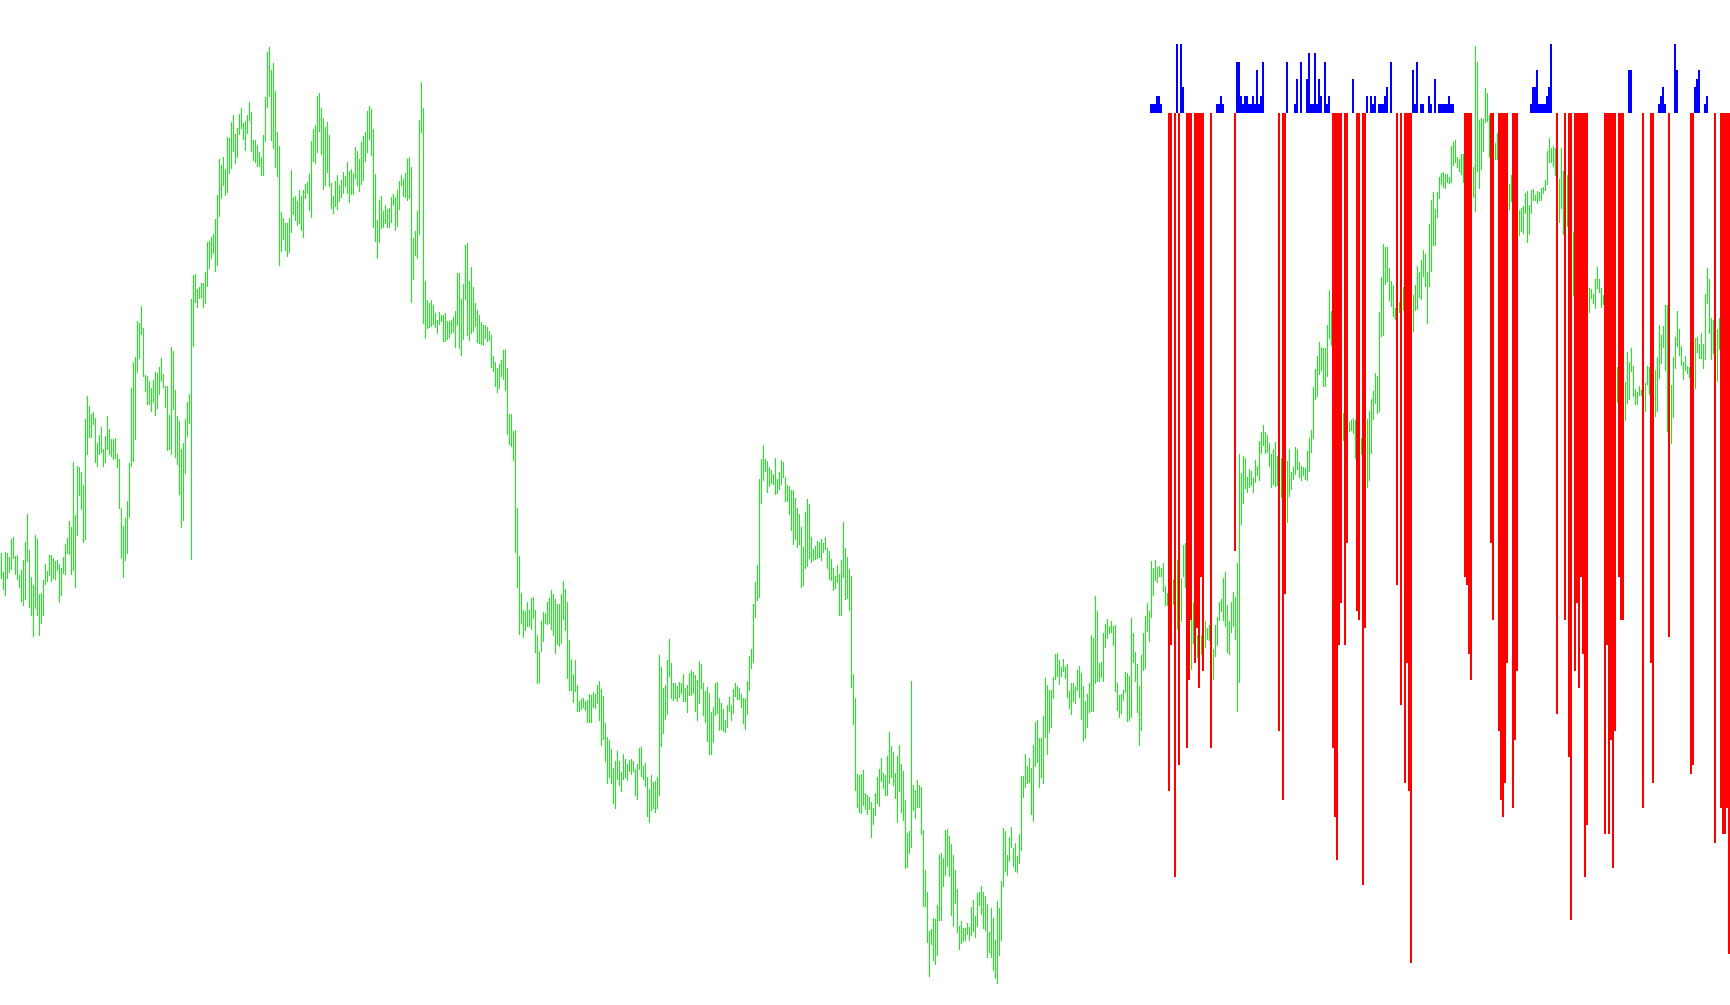
This tool is designed as a specialized visual aid for traders to help identify extreme market conditions and potential price reversals. It functions by analyzing price momentum and transforming it into a simplified, high-contrast histogram that highlights "overextended" movements.
How the Logic Works
The script operates by calculating a specific type of momentum value based on the relationship between recent price highs and lows. Instead of showing you every tiny fluctuation in the market, it focuses on significant trends to determine if the price is moving too fast in one direction.
Key components of its logic include:
- Momentum Scaling: The tool takes standard momentum data and applies a mathematical transformation. This converts raw market movement into a normalized scale, making it easier to visualize the "intensity" of the current trend.
- Threshold Filtering: The script uses specific boundaries (defined by your settings) to act as filters. It ignores minor market noise and only highlights movements that cross these pre-set levels.
- Visual Signaling:
- When the market momentum is considered "low" or hasn't reached a significant level of intensity, the indicator remains quiet.
- When the momentum exceeds the upper threshold, it generates a Red histogram signal, suggesting that the upward move may be becoming overextended.
- When the momentum falls below the lower threshold, it generates a Blue histogram signal, indicating that the downward move may be reaching an extreme point.
Practical Application
Rather than cluttering your chart with complex numbers, this script simplifies market sentiment into a clear visual summary. By monitoring where these colors appear, traders can better identify areas where the market might be "overbought" or "oversold," providing a clearer picture of potential turning points in the price action.
/*-----------------------------+
|			       |
| Shared by www.Aptrafx.com    |
|			       |
+------------------------------*/

//+------------------------------------------------------------------+
//|                                                      WPRfast.mq4 |
//|                                                                  |
//|                                        Ramdass - Conversion only |
//+------------------------------------------------------------------+
#property  copyright "Author - OlegVS"

#property indicator_separate_window
#property indicator_minimum -1.000000
#property indicator_maximum 1.000000
#property indicator_buffers 2
#property indicator_color1 Blue
#property indicator_color2 Red
//---- input parameters
extern int P=9;
extern int n1=9;
extern int n2=49;
extern int CountBars=300;
//---- buffers
double Up[];
double Down[];
//+------------------------------------------------------------------+
//| Custom indicator initialization function                         |
//+------------------------------------------------------------------+
int init()
  {
   string short_name;
//---- indicator line
   IndicatorBuffers(2);
   SetIndexStyle(0,DRAW_HISTOGRAM,STYLE_SOLID,2,Blue);
   SetIndexStyle(1,DRAW_HISTOGRAM,STYLE_SOLID,2,Red);
   SetIndexBuffer(0,Up);
   SetIndexBuffer(1,Down);
//----
//----
   return(0);
  }
//+------------------------------------------------------------------+
//| WPRfast                                                          |
//+------------------------------------------------------------------+
int start()
  {
   if (CountBars>Bars) CountBars=Bars;
   SetIndexDrawBegin(0,Bars-CountBars+P);
   SetIndexDrawBegin(1,Bars-CountBars+P);
   int i,counted_bars=IndicatorCounted();
   double V1,V2;
//----
   if(CountBars<=P) return(0);
//---- initial zero
   if(counted_bars<1)
   {
      for(i=1;i<=P;i++) Up[CountBars-i]=0.0;
      for(i=1;i<=P;i++) Down[CountBars-i]=0.0;
   }
//----
   i=CountBars-P-1;
   while(i>=0)
     {
Down[i]=0.0; Up[i]=0.0;
V1=iWPR(NULL,0,P,i)*iWPR(NULL,0,P,i)/100;
V2=MathCeil(V1);
if (V2<n1) {Up[i]=V2;}
if (V2>n2) {Down[i]=-(V2);}

      i--;
     }
   return(0);
  }
//+------------------------------------------------------------------+
Comments