Here's a breakdown of what this MetaTrader script does, explained in a way that avoids technical programming jargon:
Overall Purpose:
This script is designed to draw a line on a price chart. This line is intended to reflect a smoothed or filtered version of the closing prices of the financial instrument (like a stock or currency pair) you're viewing. It attempts to reduce noise and highlight underlying trends.
Key Components and How They Work:
-
Inputs (External Parameters):
t3_period: This is a crucial setting. It determines how much smoothing is applied to the price data. Think of it like adjusting the sensitivity of a filter. A larger value will create a smoother line, reacting slower to price changes, while a smaller value will make the line more responsive. A default value of 21 is pre-set.mBar: This input determines how many past data points are included in the calculation. The script goes back a certain number of bars (historical periods) on the chart and calculates the line for that duration. It has a default of 300.
-
Calculations:
- Exponential Smoothing: The core of the script employs a technique called "exponential smoothing." Imagine it like averaging prices, but with more emphasis on the most recent prices. This helps to reduce the impact of older, less relevant price fluctuations. The script uses it repetitively to create smoother lines.
- T3 Indicator Formula: The script isn't just using simple exponential smoothing. It's using a more advanced version called the "T3" indicator. The T3 indicator takes the exponential smoothing a few steps further. It applies exponential smoothing to the exponential smoothing, multiple times over. This creates a line that smooths more aggressively with less lag. A smoothing value
bis used in the formula for smoothing.
-
Drawing the Line:
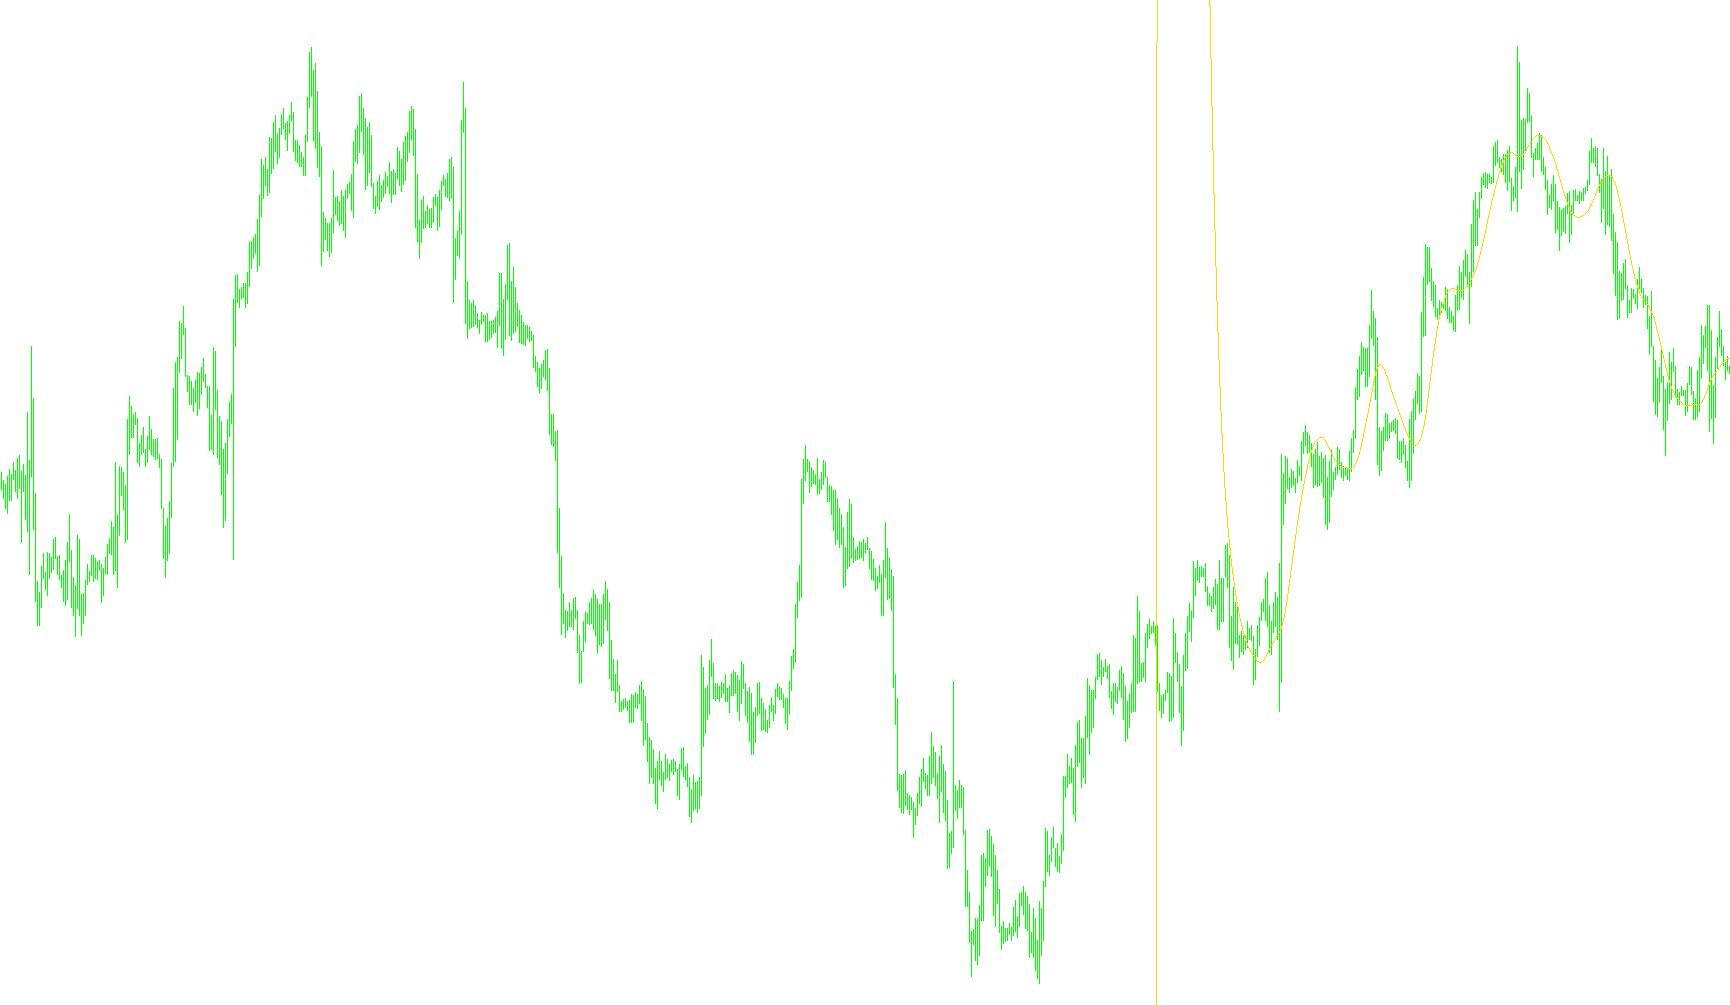
- The script calculates a value for each bar (candle) on the chart, based on the smoothed price data.
- These calculated values are then used to plot a red line on the chart. This line is the visual representation of the smoothed price trend.
In Simple Terms:
Imagine you're watching a very shaky, jittery stock price chart. This script attempts to take that shaky line and create a smoother, more flowing line that makes it easier to see the underlying direction the price is generally heading. It does this by averaging recent prices in a specific way, emphasizing the most recent prices to stay reasonably responsive to market changes. The t3_period setting lets you control just how smooth the line is.
Important Note: This explanation focuses on the logic of the script. It doesn't offer trading advice or guarantee any particular trading outcome. Using the script effectively requires understanding the financial markets and how to interpret technical indicators.
//+------------------------------------------------------------------+
//|                                                        RPr-E.mq4 |
//|                      Copyright © 2006, MetaQuotes Software Corp. |
//|                                        http://www.metaquotes.net |
//+------------------------------------------------------------------+
#property copyright "Copyright © 2006, HomeSoft-Tartan Corp."
#property link      "spiky@yranskeino.ru"
//----
#property indicator_chart_window
#property indicator_buffers 1
#property indicator_color1 Red
//----
extern double t3_period=21;
double b=0.7;
double mBar=300;
//---- buffers
double ExtMapBuffer1[];
//+------------------------------------------------------------------+
//| Custom indicator initialization function                         |
//+------------------------------------------------------------------+
int init()
  {
//---- indicators
   SetIndexStyle(0,DRAW_LINE);
   SetIndexBuffer(0,ExtMapBuffer1);
//----
   return(0);
  }
//+------------------------------------------------------------------+
//| Custom indicator iteration function                              |
//+------------------------------------------------------------------+
int start()
  {
   double e1, e2, e3, e4, e5, e6, c1, c2, c3, c4, n, w1, w2, b2, b3;
   double dpo, t3;
//----
   b2=b*b;
   b3=b2*b;
   c1=-b3;
   c2=(3*(b2+b3));
   c3=-3*(2*b2+b+b3);
   c4=(1+3*b+b3+3*b2);
   n=t3_period;
//----
   if (n<1) n=1;
   n=1 + 0.5*(n-1);
   w1=2/(n + 1);
   w2=1 - w1;
   for(int i=mBar; i>=0; i--)
     {
      dpo=Close[i];
//----
      e1=w1*dpo + w2*e1;
      e2=w1*e1 + w2*e2;
      e3=w1*e2 + w2*e3;
      e4=w1*e3 + w2*e4;
      e5=w1*e4 + w2*e5;
      e6=w1*e5 + w2*e6;
      t3=c1*e6 + c2*e5 + c3*e4 + c4*e3;
      ExtMapBuffer1[i]=t3;
     }
//----
   return(0);
  }
//+------------------------------------------------------------------+
Comments