ROC_v1
Download script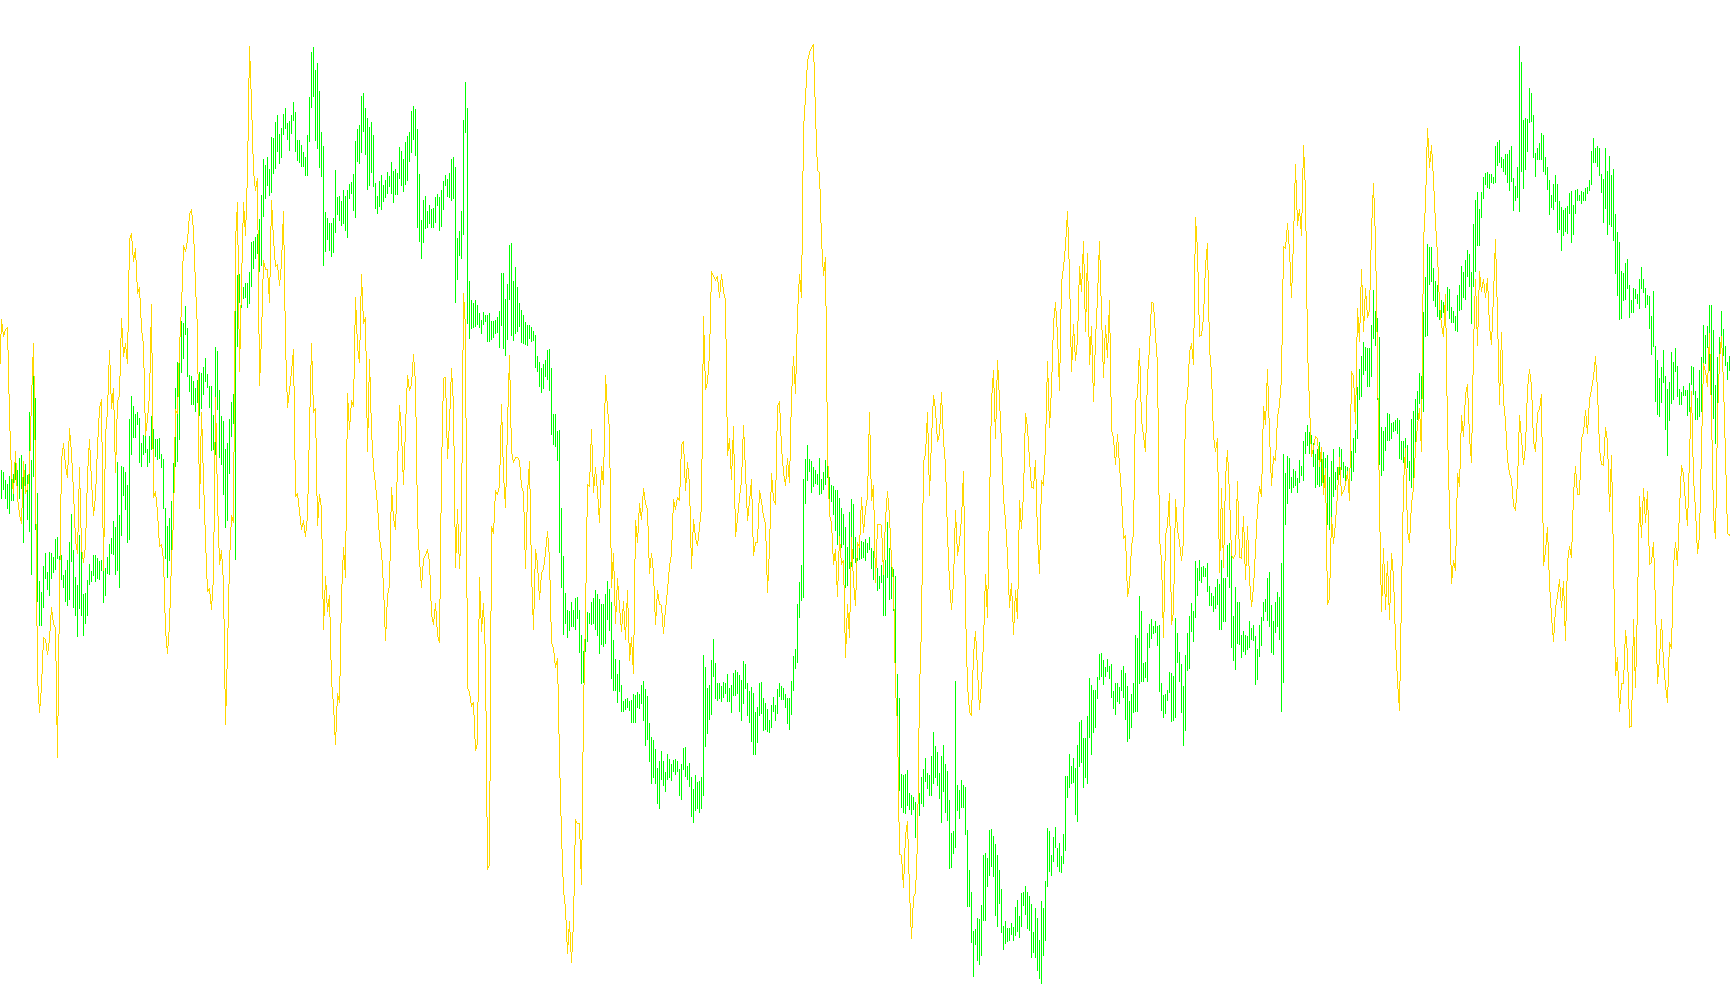
This tool is designed to measure the speed at which a financial asset's price is moving over a specific period. In simple terms, it helps traders visualize whether the price is accelerating, decelerating, or remaining stagnant by comparing where the price is now against where it was in the past.
How the Logic Works
The script operates based on three primary components:
1. The Time Horizon (Period) The tool looks back at a specific number of historical bars (defaulting to 12). By defining this window, the indicator allows you to choose the "memory" of the calculation—shorter periods focus on immediate, fast-moving changes, while longer periods provide a broader view of the trend.
2. The Price Comparison The core calculation identifies two specific price points:
- The Current Price: Where the market is currently trading.
- The Previous Price: Where the market was trading exactly at the start of your chosen time horizon (e.g., 12 bars ago).
By subtracting the old price from the current price, the script determines the raw numerical difference between these two points.
3. Display Options The script offers two ways to visualize this information:
- Raw Change: By default, the tool displays the simple mathematical difference between the two prices. If the line goes up, the price has increased; if it goes down, the price has decreased.
- Percentage Change: If enabled, the tool converts that raw difference into a percentage. This is particularly useful because it allows you to compare the volatility of different assets (like comparing a volatile stock to a stable currency) on an equal scale.
Summary for Traders
Essentially, this indicator acts as a "speedometer" for the market. Instead of just showing you the price, it shows you the momentum. A rising line indicates that the price is gaining strength, while a falling line suggests it is losing steam or retreating, helping you identify trends before they become obvious on a standard chart.
//+------------------------------------------------------------------+
//|                                                          ROC.mq4 |
//|                                    Copyright © 2006, Robert Hill |
//+------------------------------------------------------------------+

#property  copyright "Copyright © 2006, Robert Hill"
//---- indicator settings
#property  indicator_separate_window
#property  indicator_buffers 1
#property  indicator_color1  Red
//---- indicator parameters
extern int RPeriod = 12;
extern bool UsePercent = false;
//---- indicator buffers
double RateOfChange[];
//+------------------------------------------------------------------+
//| Custom indicator initialization function                         |
//+------------------------------------------------------------------+
int init()
  {
//---- drawing settings
   SetIndexStyle(0, DRAW_LINE);
   SetIndexDrawBegin(0, RPeriod);
   IndicatorDigits(Digits + 1);
//---- indicator buffers mapping
   if(!SetIndexBuffer(0, RateOfChange))
       Print("cannot set indicator buffers!");
//---- name for DataWindow and indicator subwindow label
   IndicatorShortName("ROC(" + RPeriod + ")");
//---- initialization done
   return(0);
  }
//+------------------------------------------------------------------+
//| Moving Averages Convergence/Divergence                           |
//+------------------------------------------------------------------+
int start()
  {
   int limit;
   double ROC, CurrentClose, PrevClose;
   int counted_bars = IndicatorCounted();
//---- check for possible errors
   if(counted_bars < 0)
       return(-1);
//---- last counted bar will be recounted
   if(counted_bars > 0)
       counted_bars--;
   limit = Bars - counted_bars - RPeriod;
//---- ROC calculation
   for(int i = 0; i < limit; i++)
     {
       CurrentClose = iClose(NULL, 0, i);
       PrevClose = iClose(NULL, 0, i + RPeriod);
       ROC = CurrentClose - PrevClose;
       //----
       if(UsePercent)
         {
           if(PrevClose != 0)
               RateOfChange[i] = 100 * ROC / PrevClose;
         }
       else
           RateOfChange[i] = ROC;
     }
//---- done
   return(0);
  }
//+------------------------------------------------------------------+
Comments