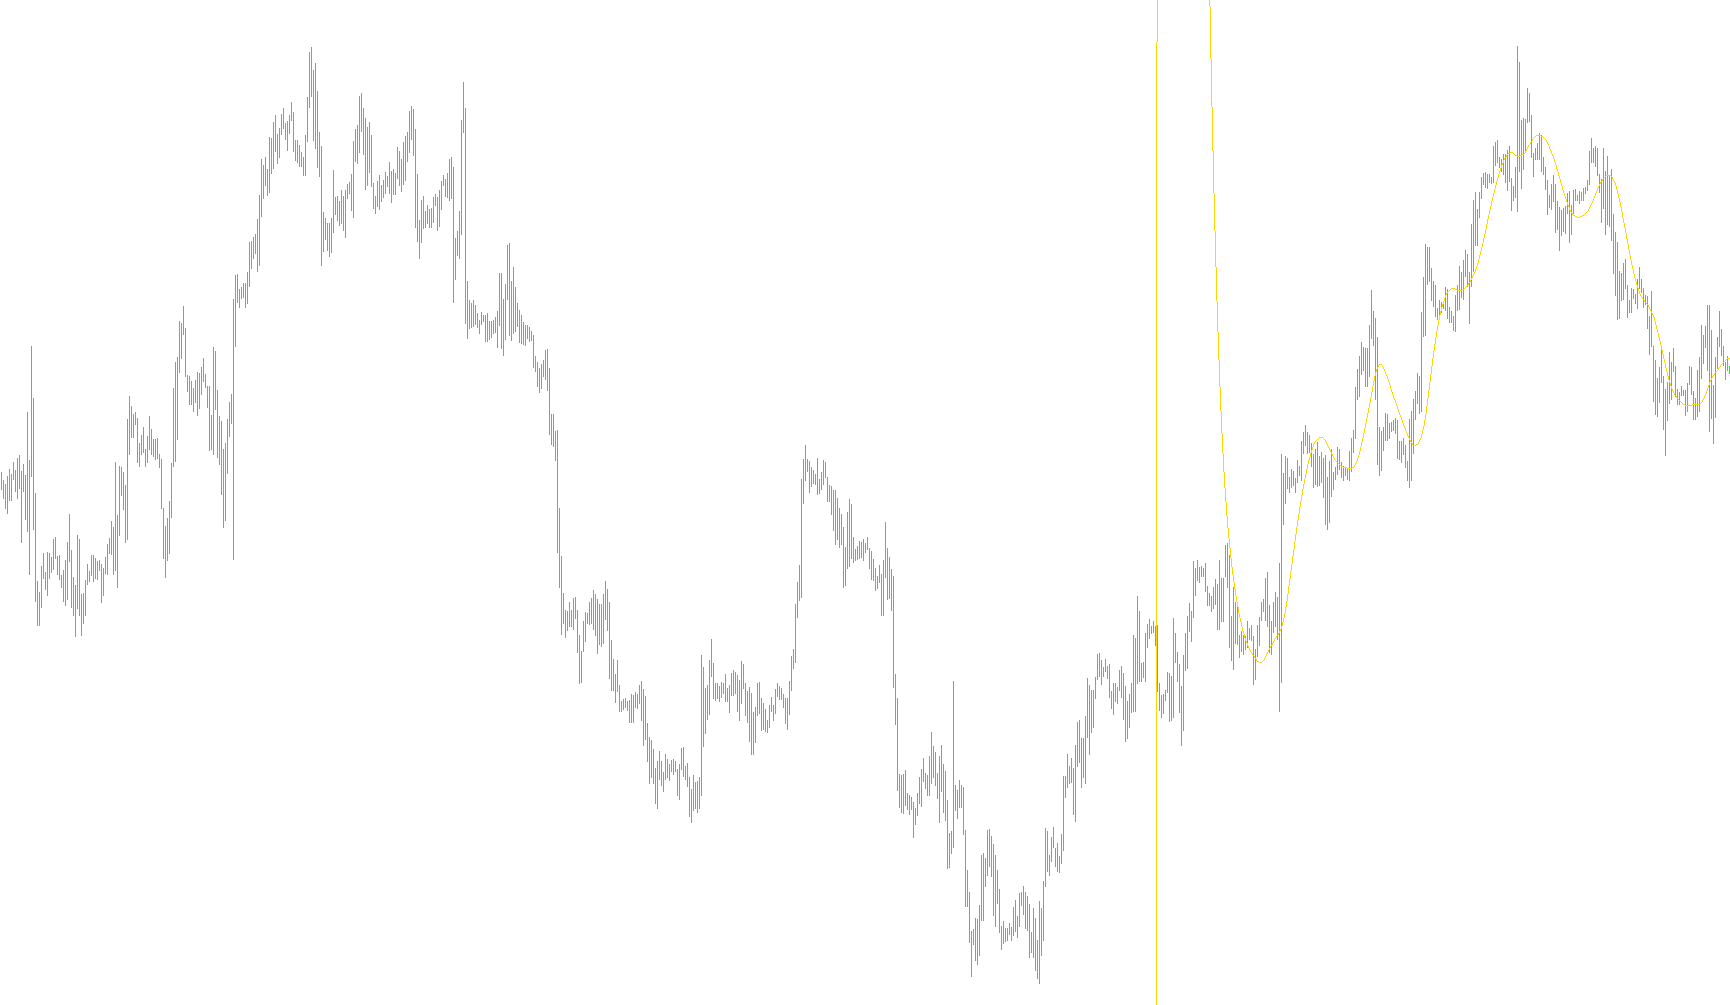
This custom indicator is designed to provide a smoothed visual representation of price action on your trading chart. Instead of showing the volatile, moment-to-moment fluctuations of raw market prices, it calculates a refined trend line that helps identify the underlying direction of the market with less "noise."
How the Logic Works
1. Data Smoothing (The Foundation) The script utilizes a multi-layered smoothing technique. Rather than looking at just the most recent price, it takes the closing price of a candle and processes it through a series of weighted calculations. It essentially creates a chain of moving averages where each step relies on the previous one, progressively filtering out minor price spikes.
2. Weighted Distribution The logic employs specific mathematical weights to determine how much importance to give to recent data versus older data. By adjusting these weights (controlled by the "period" setting), the indicator balances responsiveness with smoothness. A higher period will result in a smoother, slower-moving line that highlights long-term trends, while a lower period will follow the price more closely.
3. Triple Exponential Processing The core engine of this script performs a "Triple" calculation. It takes the smoothed data and passes it through three distinct stages of processing. Each stage acts as a secondary filter:
- The first layer removes the immediate jitter of the market.
- The second layer smooths out the remaining oscillations.
- The third layer creates a finalized trend line that emphasizes the most significant price movements while ignoring insignificant price "noise."
4. Visual Output The result of these calculations is plotted as a continuous blue line on your chart. Because it processes hundreds of bars of historical data (defined by the "mBar" setting), it provides a consistent visual path of where the price has been and where it appears to be heading based on the smoothed momentum.
Summary for the Trader
Think of this indicator as a "filter" for the market's heartbeat. While the raw price might jump up and down constantly, this script ignores those tiny vibrations to show you the actual path of the trend. It helps you see the "big picture" by calculating a weighted average that reacts to significant moves while staying steady during periods of minor consolidation.
//+------------------------------------------------------------------+
//|                                                        RPr-E.mq4 |
//|                      Copyright © 2006, MetaQuotes Software Corp. |
//|                                        http://www.metaquotes.net |
//+------------------------------------------------------------------+
#property copyright "Copyright © 2006, HomeSoft-Tartan Corp."
#property link      "spiky@yranskeino.ru"

#property indicator_chart_window
#property indicator_buffers 1
#property indicator_color1 Blue

extern double t3_period=21;
extern double b=0.7;
extern double mBar = 300;

//---- buffers
double ExtMapBuffer1[];

//+------------------------------------------------------------------+
//| Custom indicator initialization function                         |
//+------------------------------------------------------------------+
int init()
  {
//---- indicators
   SetIndexStyle(0,DRAW_LINE);
   SetIndexBuffer(0,ExtMapBuffer1);
//----
   return(0);
  }
//+------------------------------------------------------------------+
//| Custom indicator iteration function                              |
//+------------------------------------------------------------------+
int start()
  {
   double e1, e2, e3, e4, e5, e6, c1, c2, c3, c4, n, w1, w2, b2, b3;
   double dpo, t3;

   b2=b*b;
   b3=b2*b;
   c1=-b3;
   c2=(3*(b2+b3));
   c3=-3*(2*b2+b+b3);
   c4=(1+3*b+b3+3*b2);
   n=t3_period;

   if (n<1) n=1;
   n = 1 + 0.5*(n-1);
   w1 = 2 / (n + 1);
   w2 = 1 - w1;


   for(int i=mBar; i>=0; i--)

   {

      dpo=Close[i];

      e1 = w1*dpo + w2*e1;
      e2 = w1*e1 + w2*e2;
      e3 = w1*e2 + w2*e3;
      e4 = w1*e3 + w2*e4;
      e5 = w1*e4 + w2*e5;
      e6 = w1*e5 + w2*e6;

      t3 = c1*e6 + c2*e5 + c3*e4 + c4*e3;
      ExtMapBuffer1[i]=t3;
   }

   return(0);
  }
//+------------------------------------------------------------------+
Comments