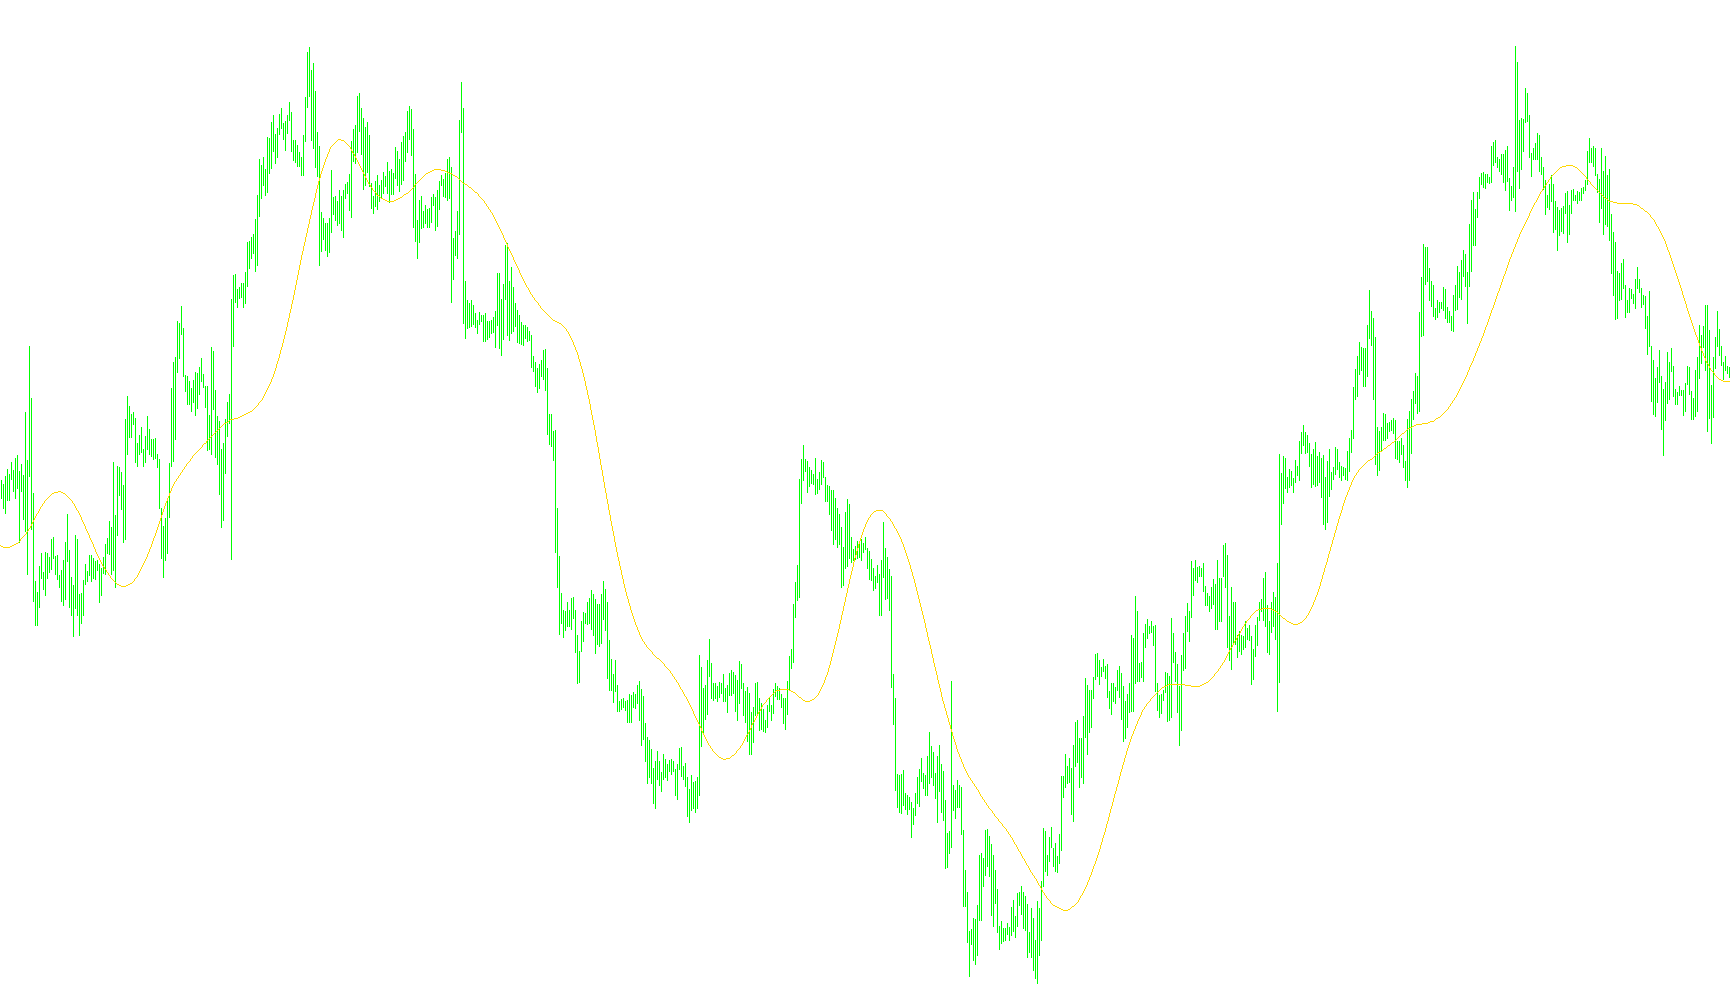
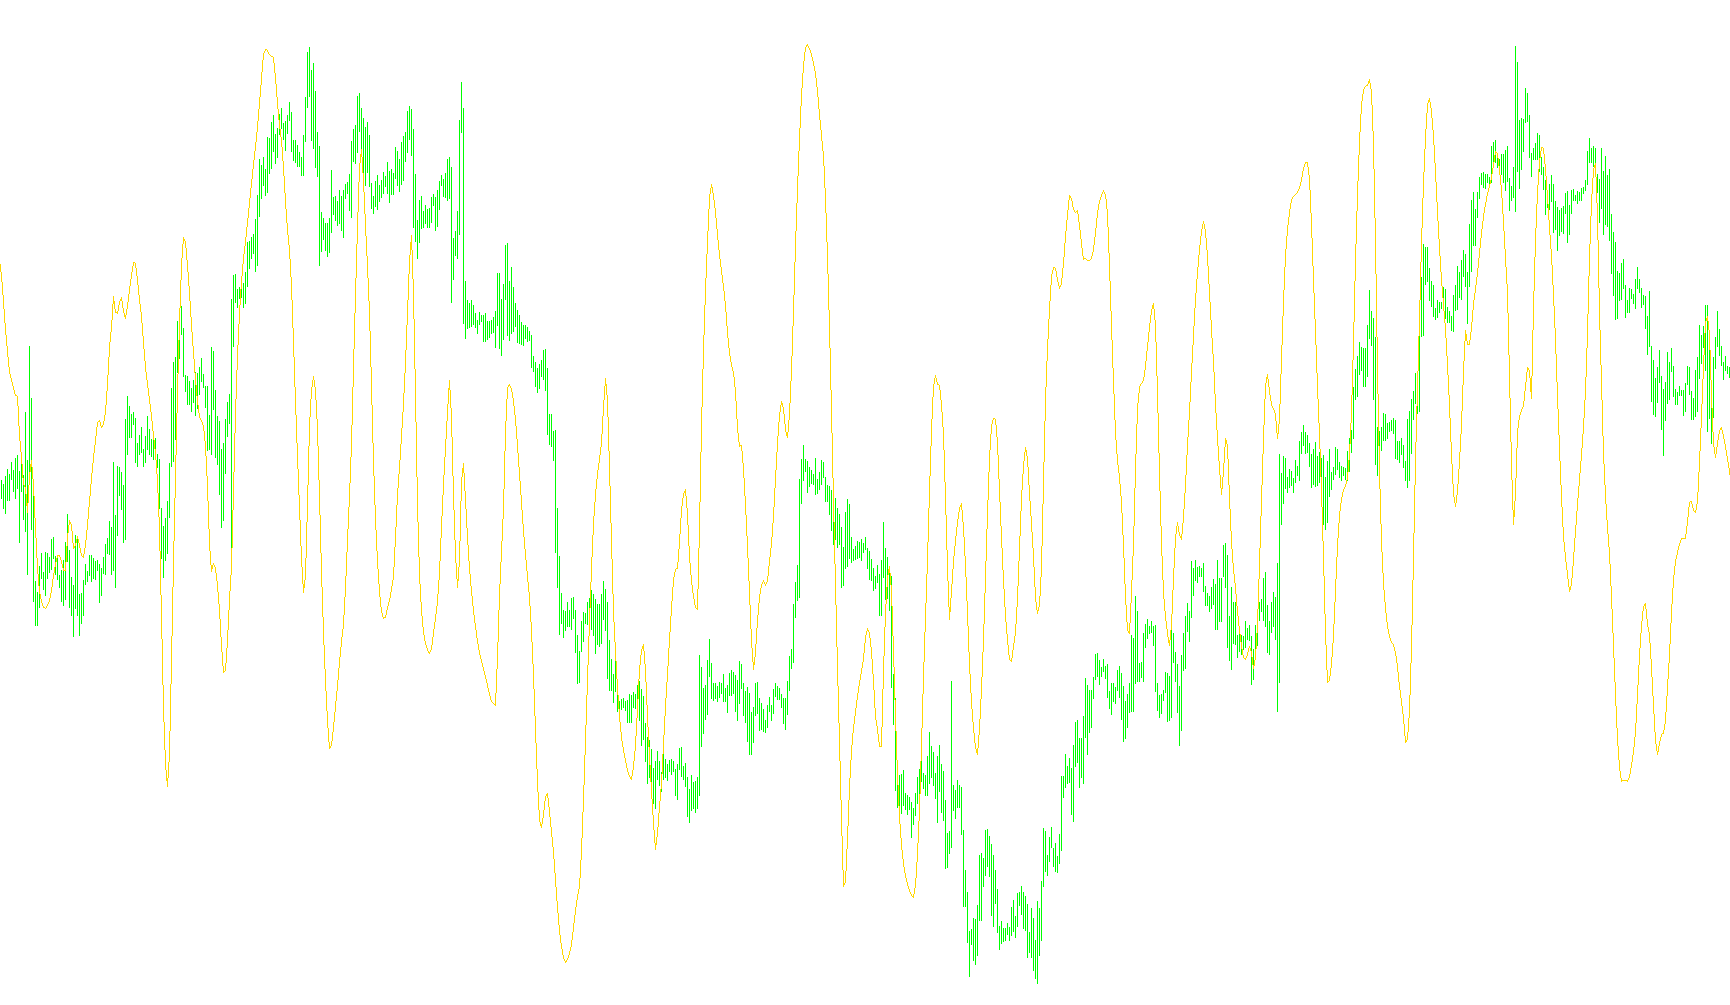
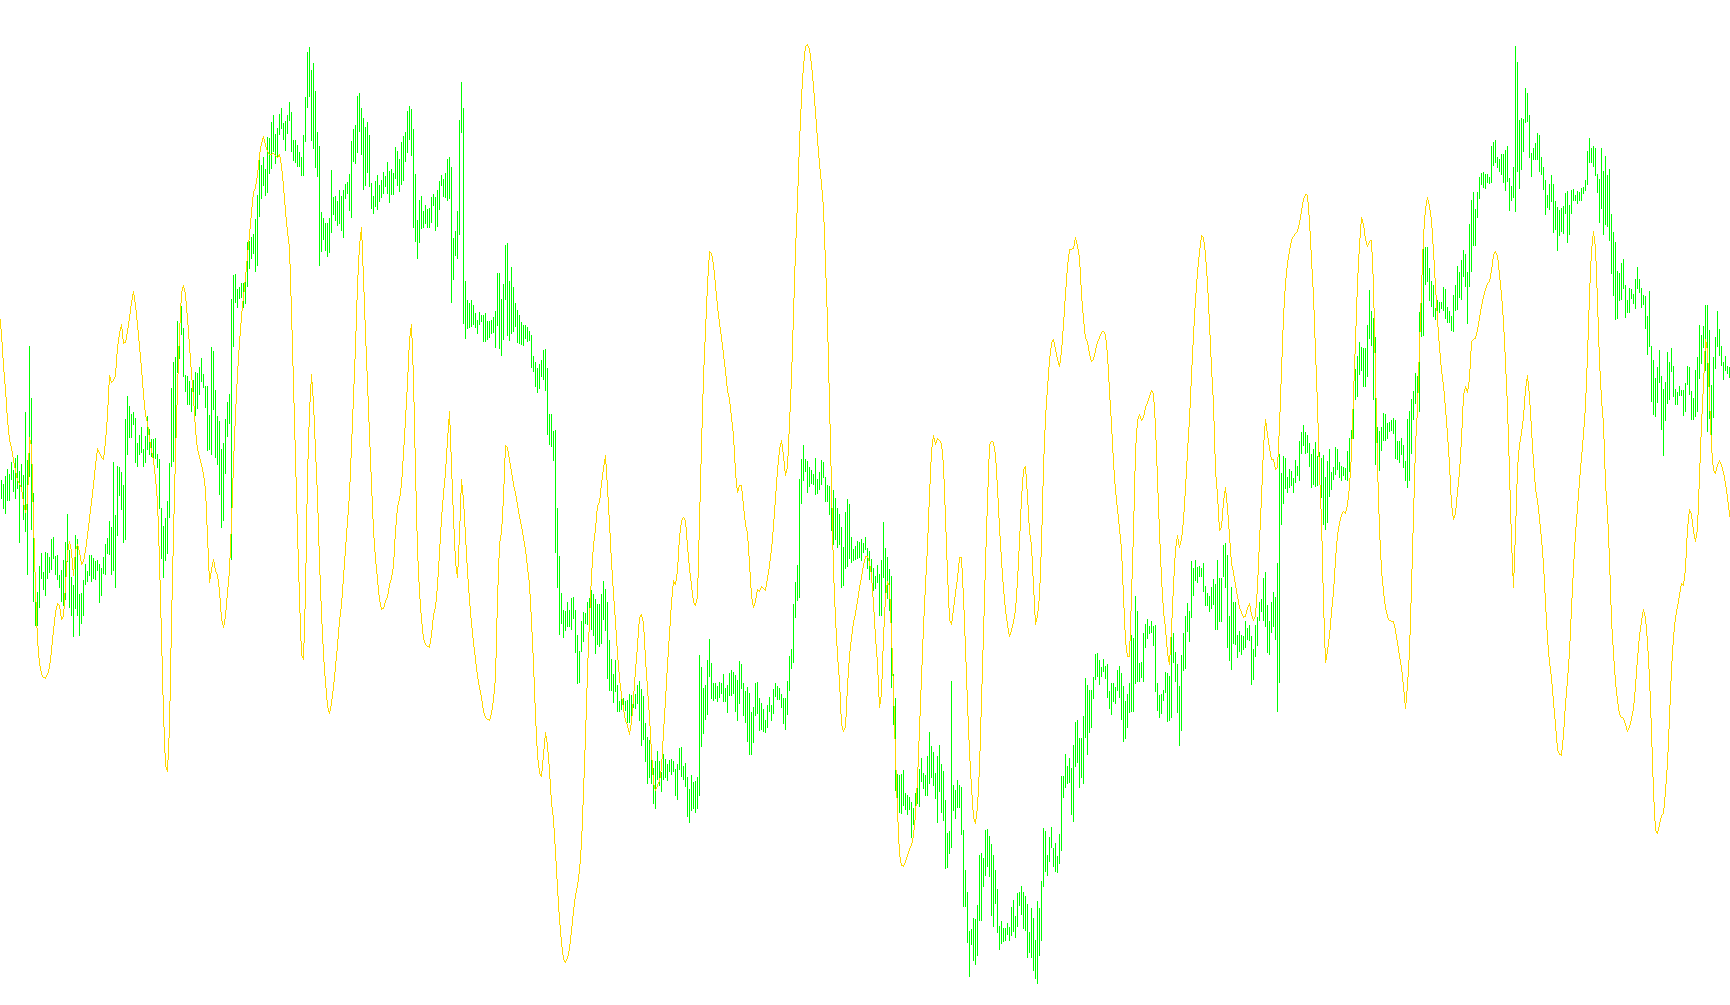
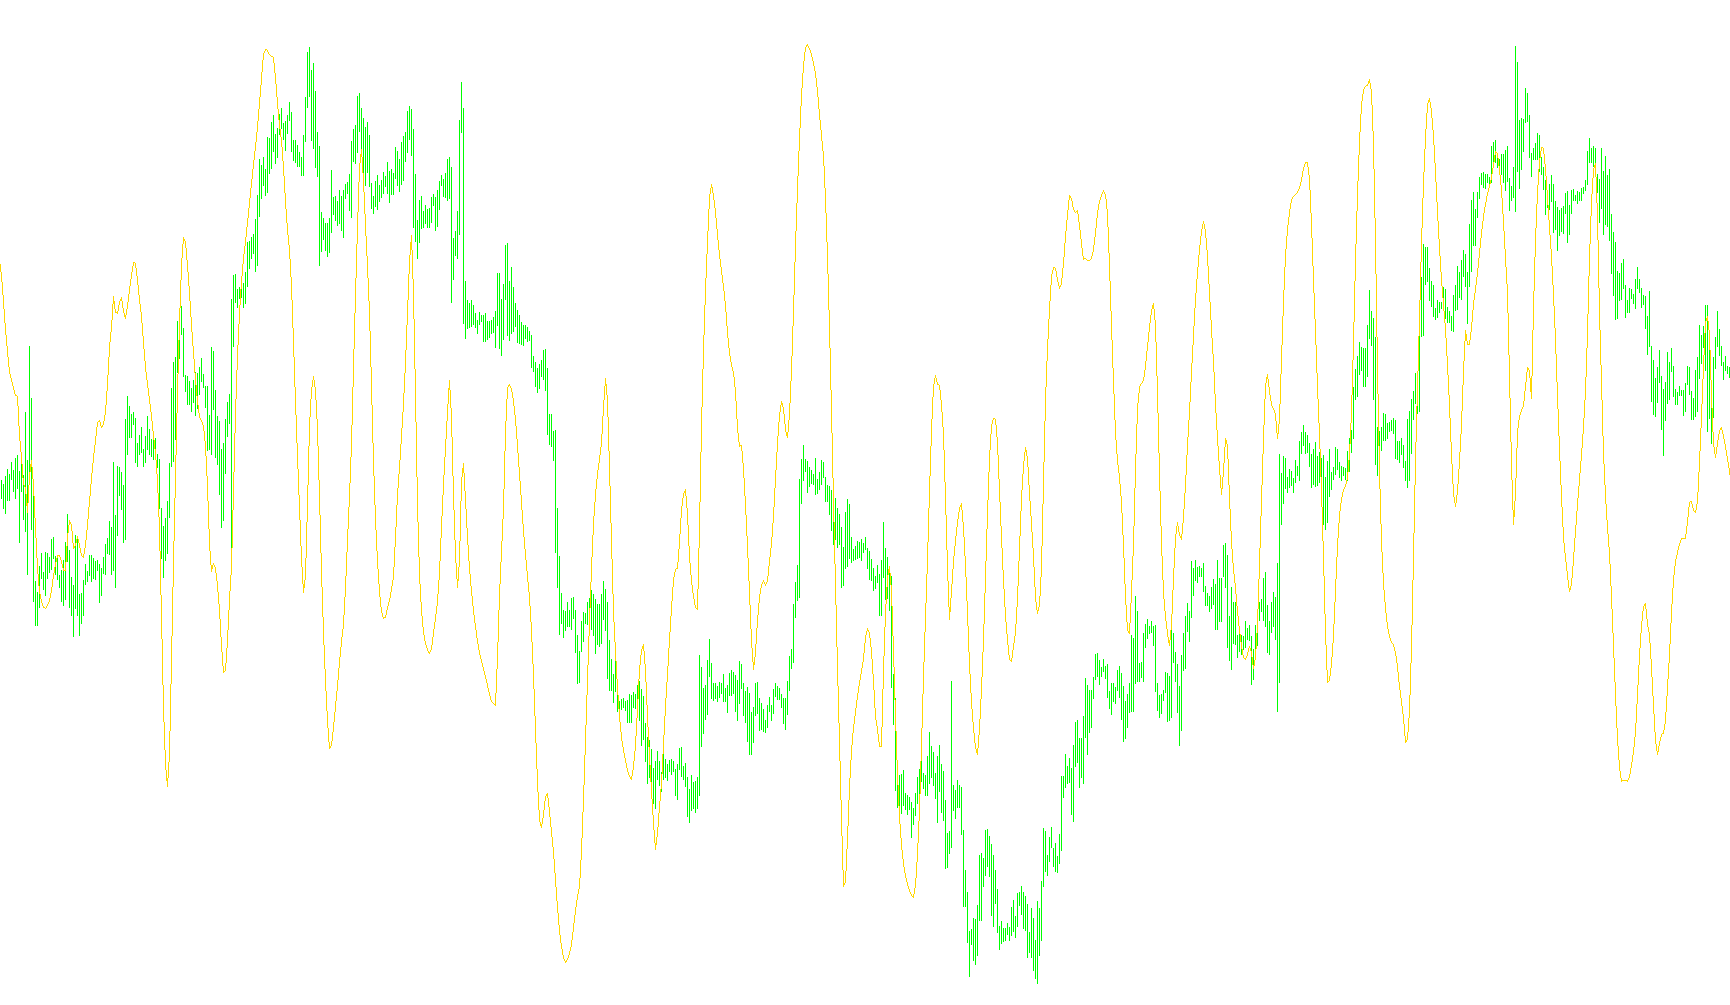
RSI_v1
Indicator

RSI_v1

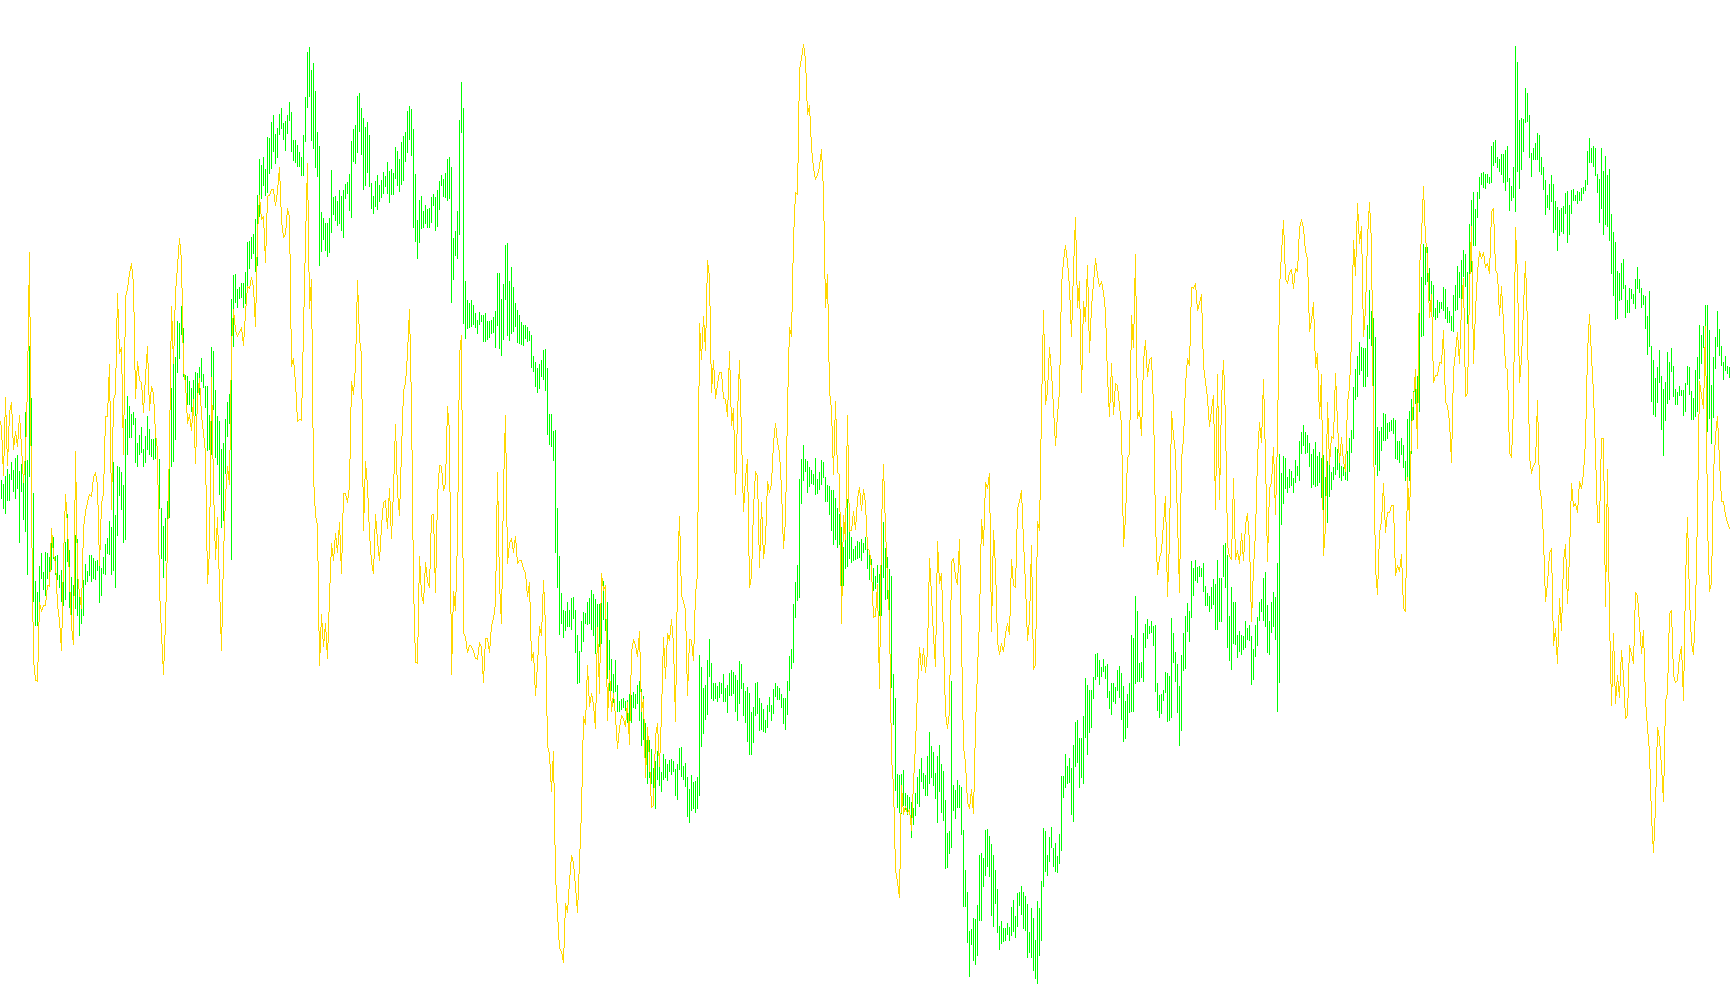
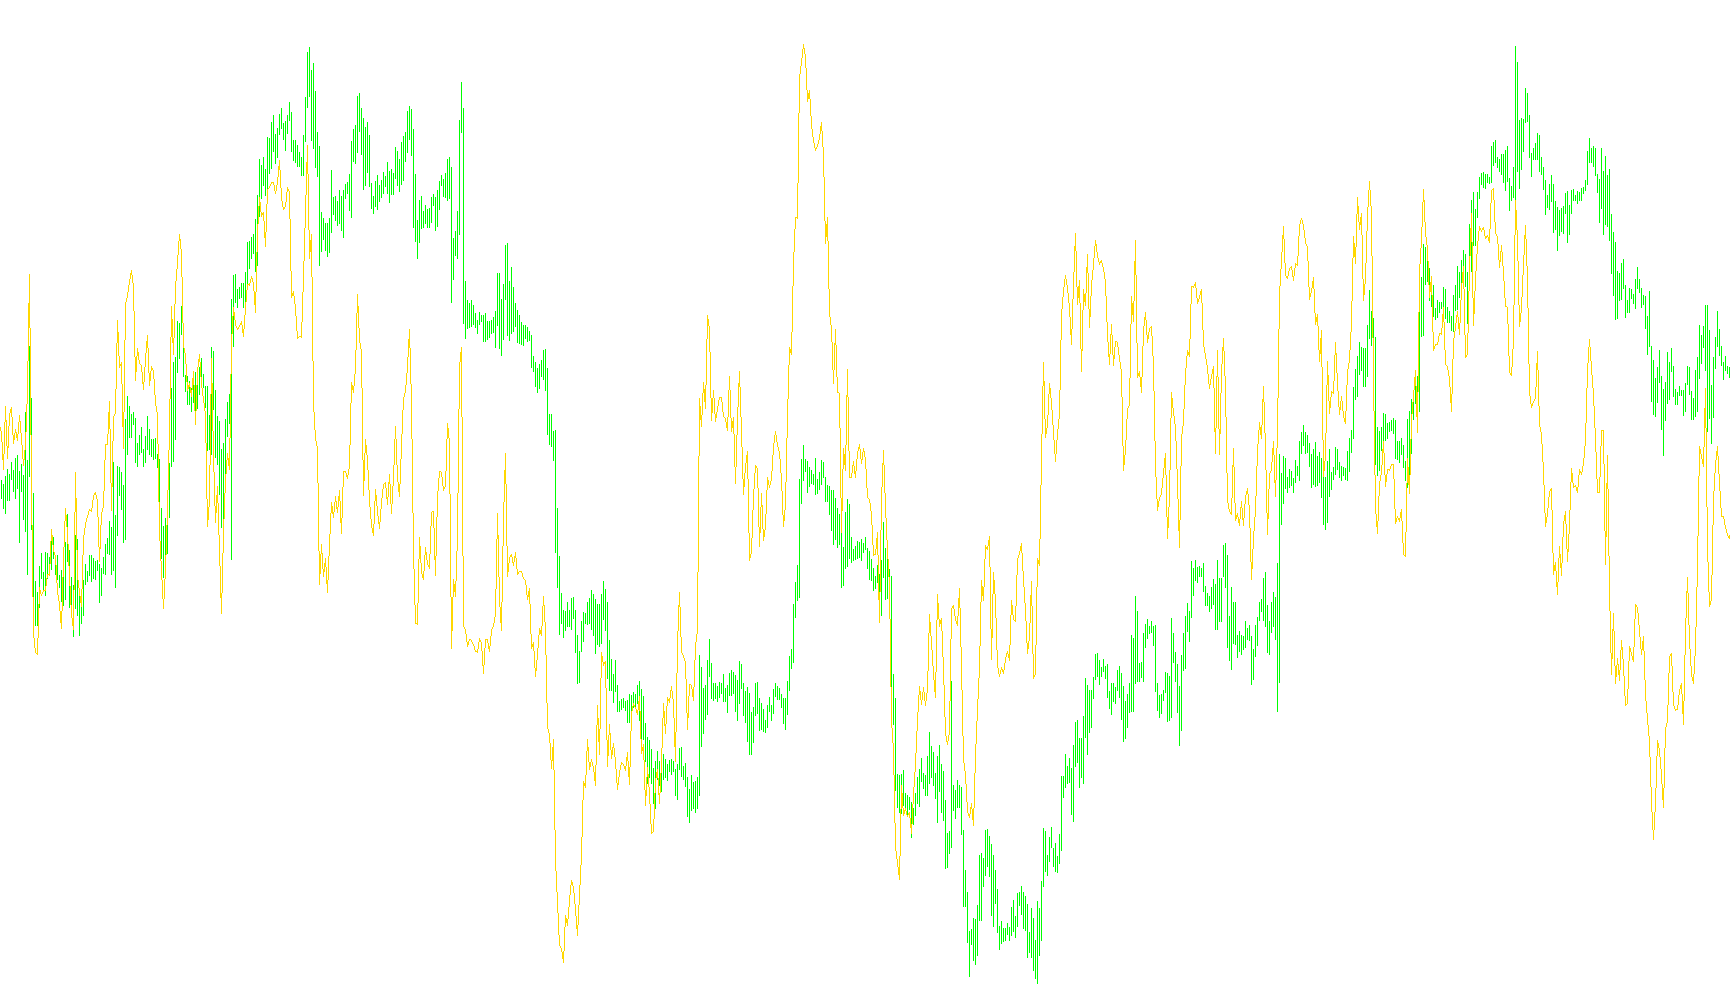
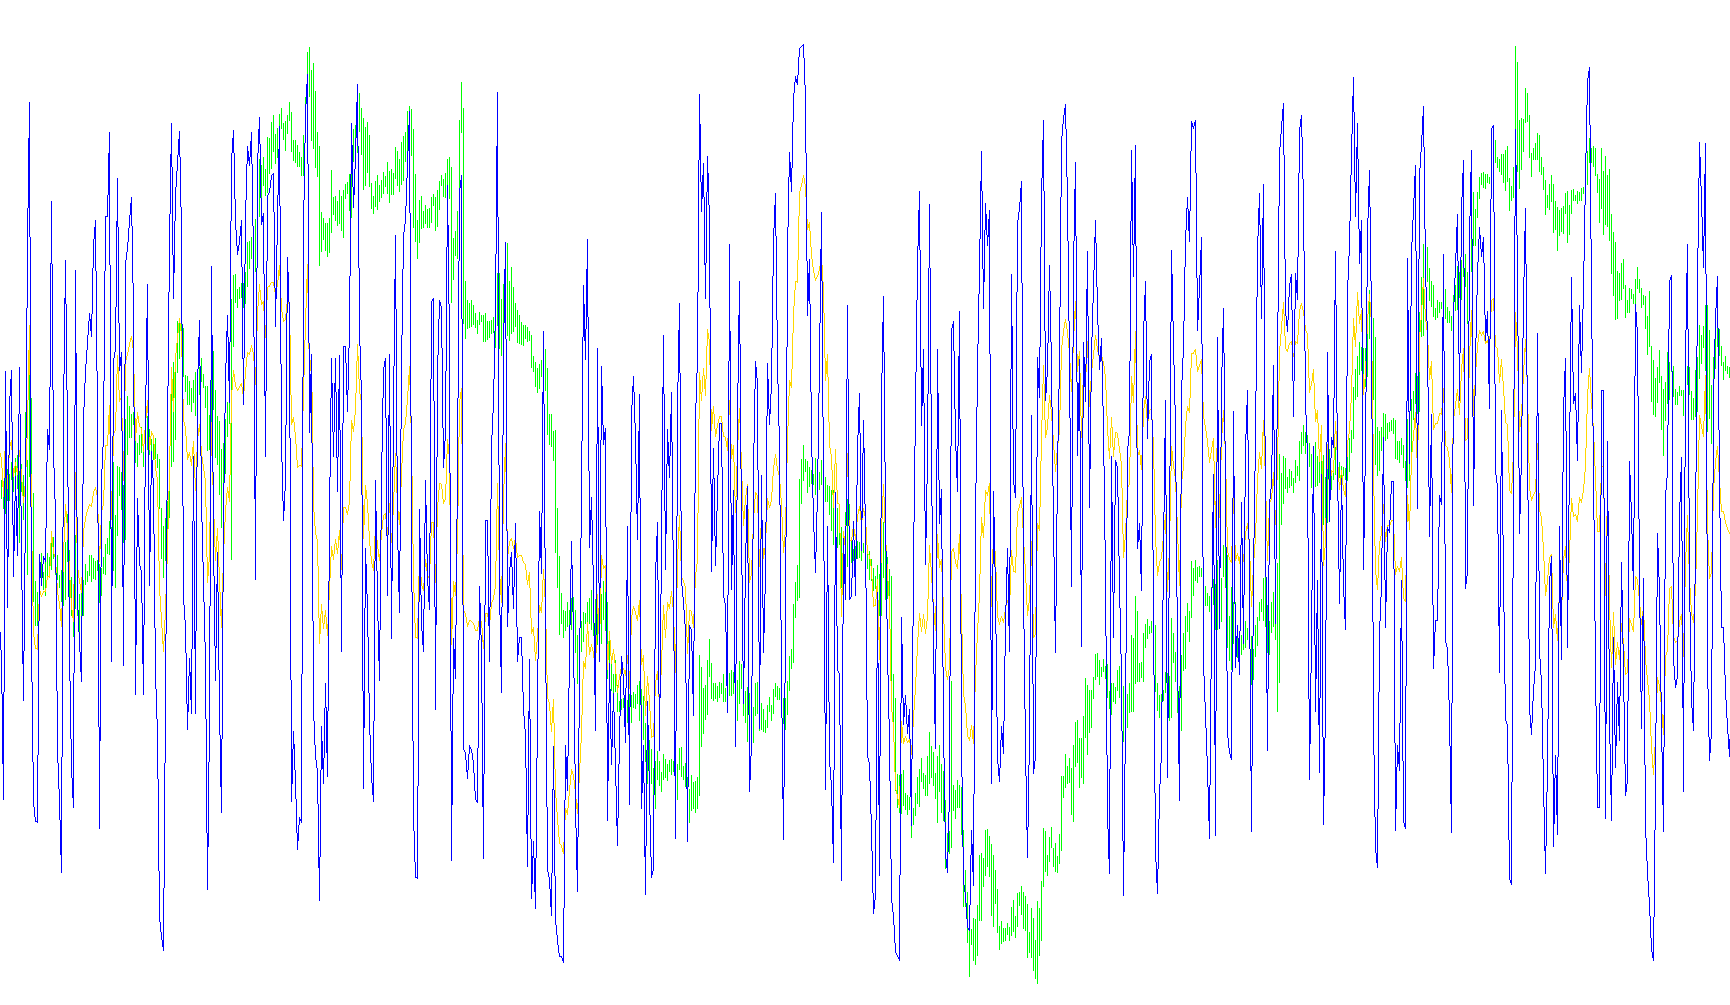
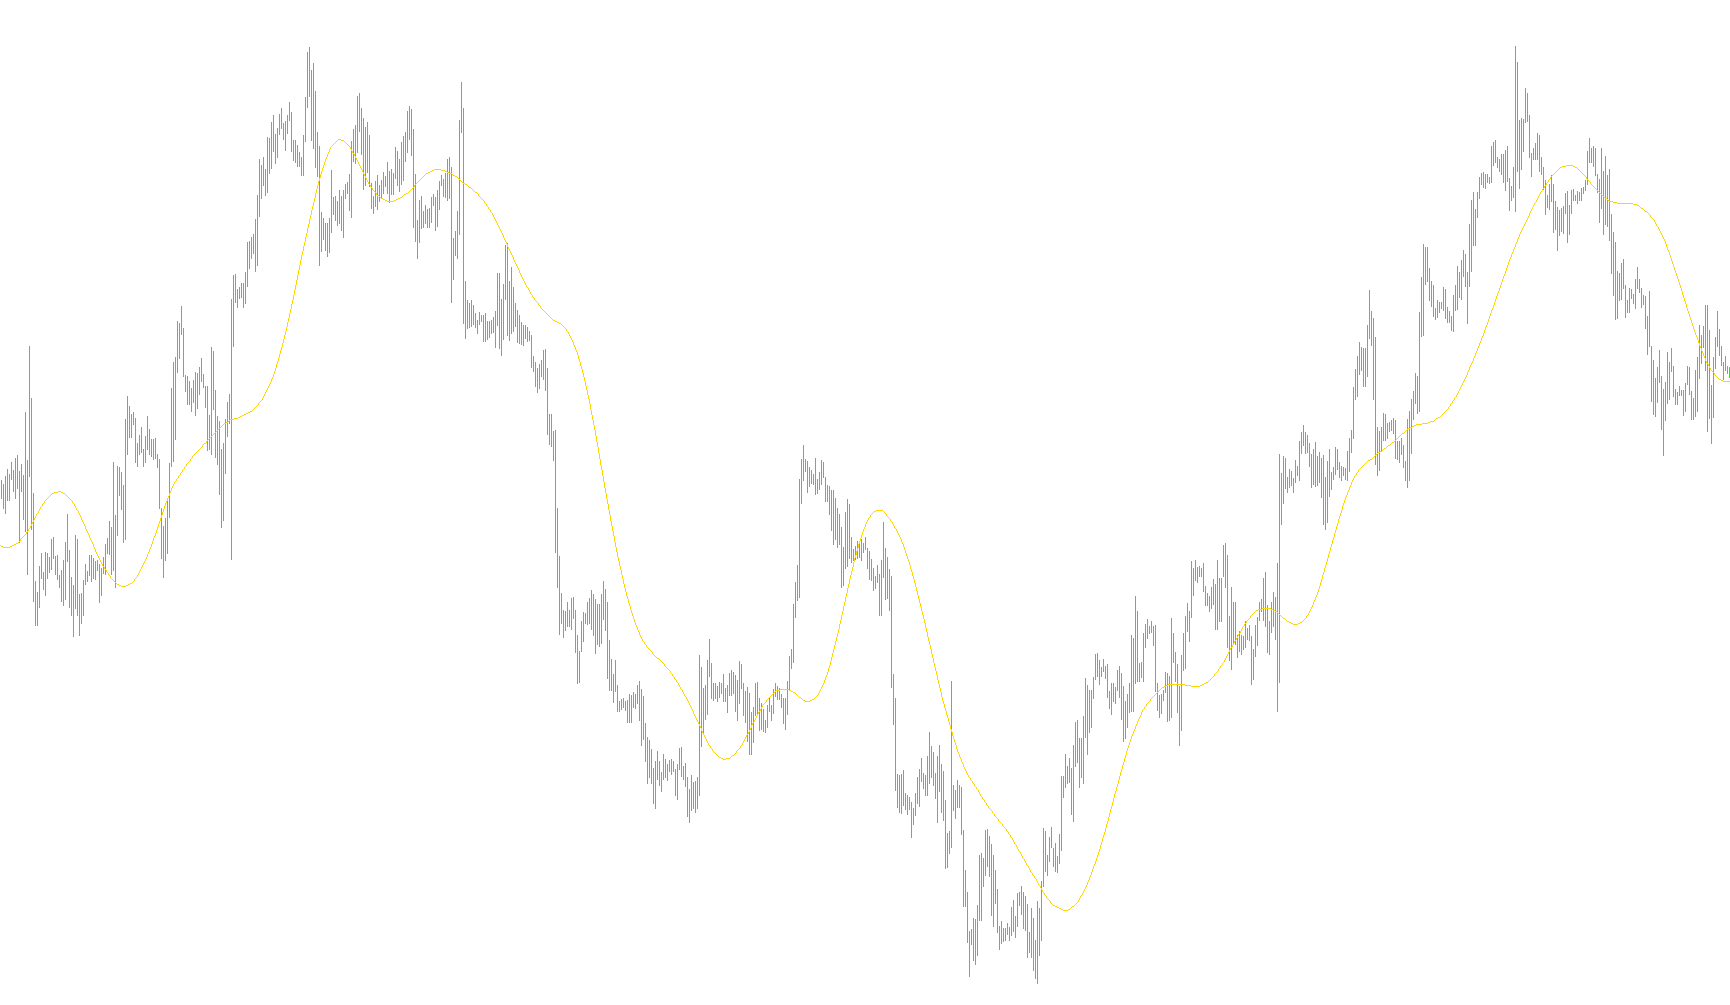
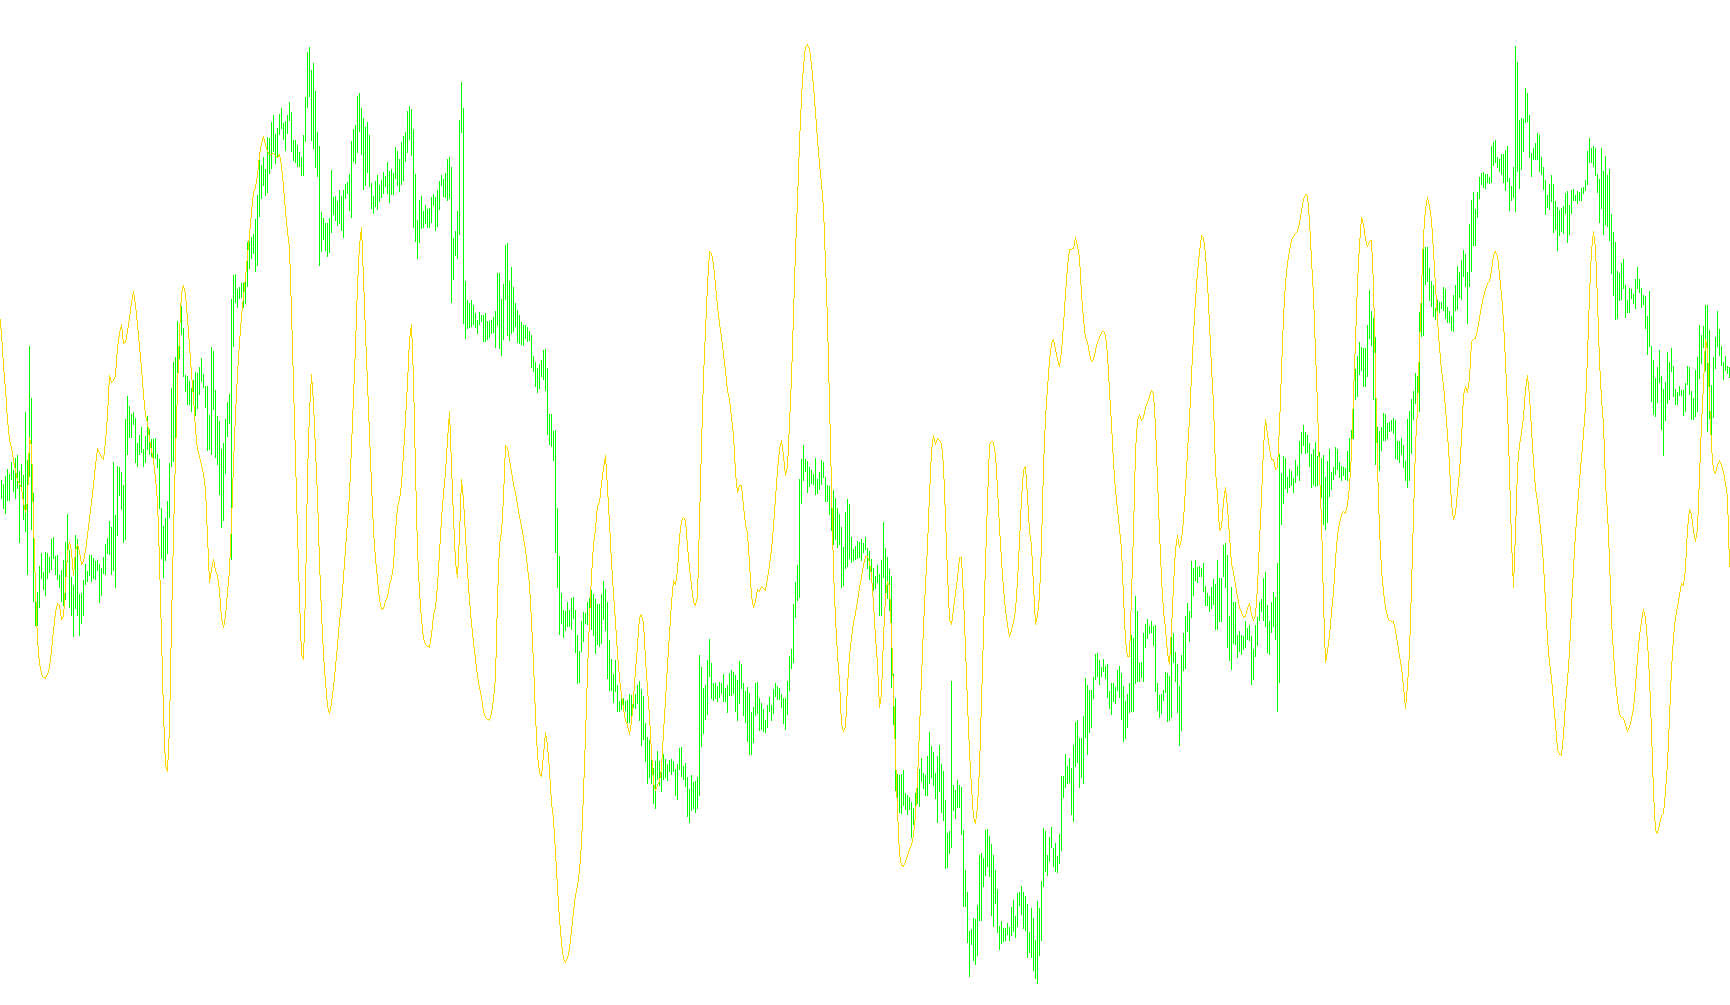
This indicator calculates a relative strength metric by applying an exponential smoothing technique to the ratio of cumulative upward and downward price fluctuations over a fixed lookback duration.
RSI_WithAlert
Indicator

RSI_WithAlert

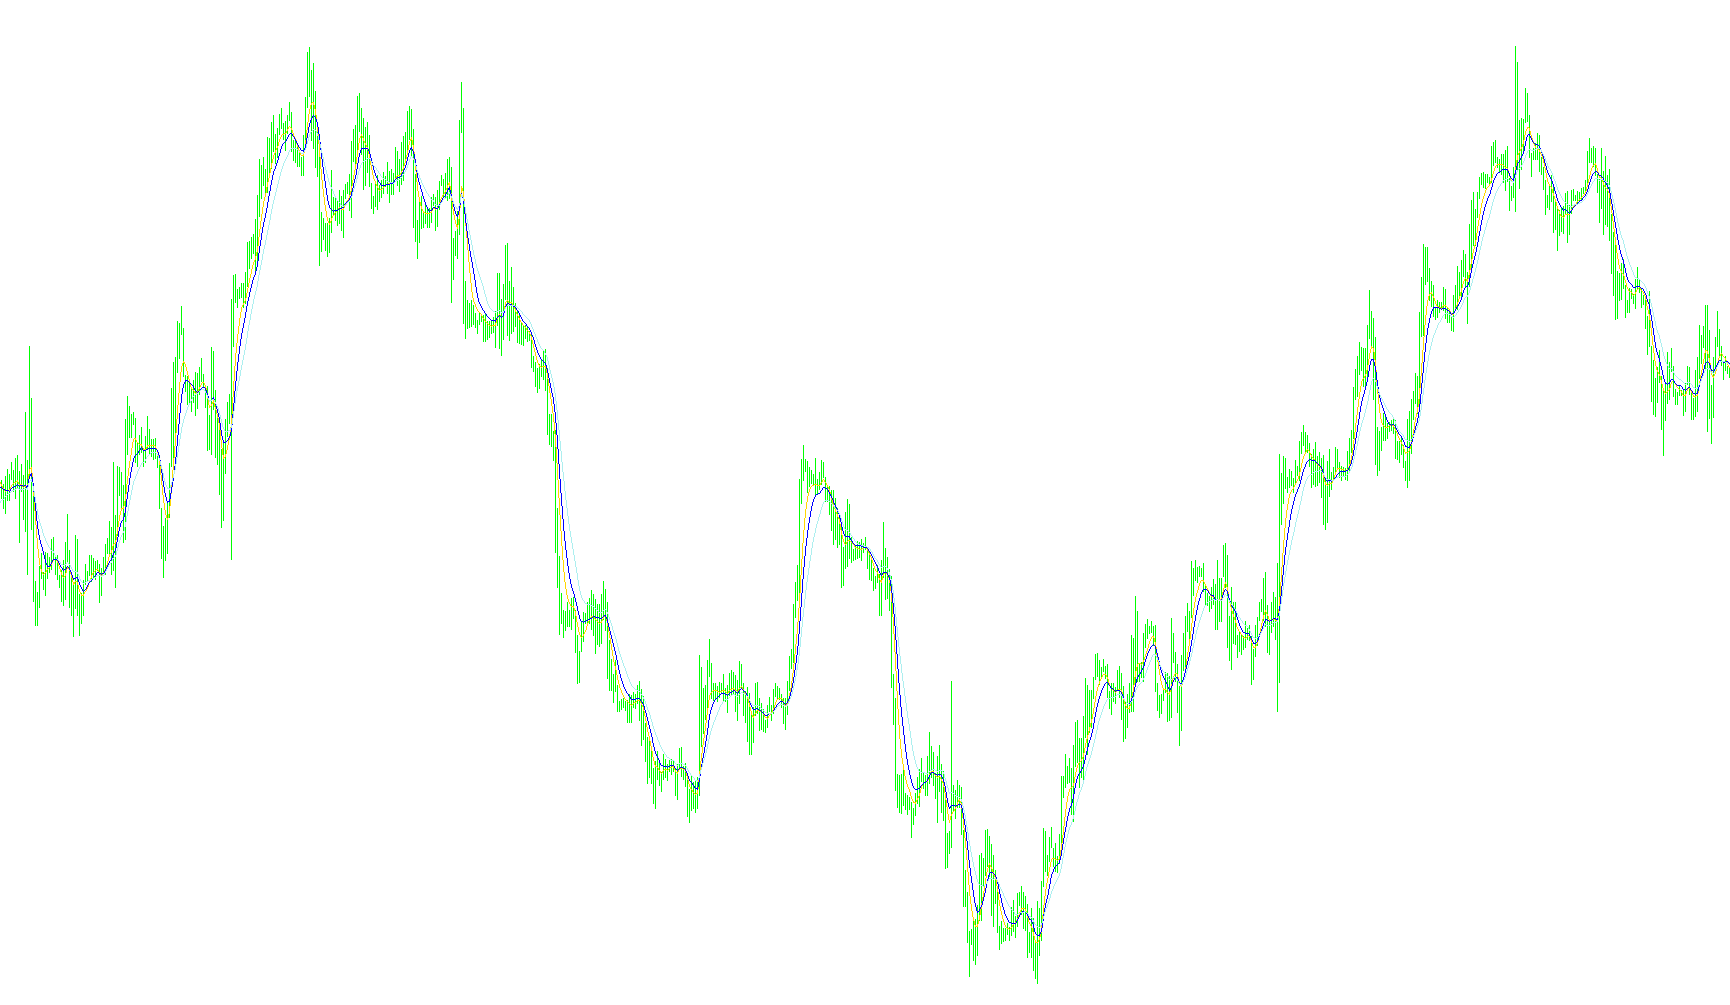
This indicator identifies dynamic price velocity shifts by triggering instantaneous alerts when the smoothed relative strength index crosses predefined bullish and bearish boundary levels.

RSI_X2
Indicator

RSI_X2

iRSI

This indicator visualizes the interplay between two Relative Strength Indices of different temporalities to identify momentum shifts and trend velocity.

Indicator

RSI_x2_mtf

iRSI
RSL1
Indicator

RSL1

iMA

This indicator visualizes price action momentum by mapping historical Exponential Moving Average trend shifts onto a vertical coordinate system based on the asset's extreme price range.

RSTL
Indicator

RSTL

This indicator calculates a smoothed price signal by applying a specific non-linear weighted coefficient array to a 99-period historical close price sequence.

RSTL_v1
Indicator

RSTL_v1

This indicator calculates a weighted sum of the previous ninety-nine closing prices using specific coefficients to identify cyclical momentum and structural equilibrium.

RSTL_v2
Indicator

RSTL_v2

This indicator calculates a high-precision moving average by applying a multi-point weighted sum of historical closing prices to filter noise and reveal underlying price trends.

rsx
Indicator

rsx

This indicator calculates a smoothed momentum oscillator by applying multiple layers of exponential moving averages to the absolute price range fluctuations.

RSX[1]
Indicator

RSX[1]

The indicator calculates a smoothed momentum value by applying multi-stage weighted moving averages to the absolute price variance, normalized into a bounded oscillator scale.

rsx_004
Indicator

rsx_004

This indicator calculates a multi-stage smoothed stochastic oscillator by applying successive weighted averages to price volatility to determine momentum equilibrium.

RSX_005
Indicator

RSX_005

This indicator calculates a smoothed relative strength index by applying multi-stage exponential smoothing and absolute value weighting to determine price momentum dynamics.

RSX_CD
Indicator

RSX_CD

iMAOnArray

This indicator calculates the differential between two Relative Strength Index (RSX) periods and applies an exponential moving average to generate a visual momentum shift histogram.

RSX_CD_v1
Indicator

RSX_CD_v1

iMAOnArray

This indicator calculates the delta between two RSX oscillators and applies an exponential moving average to generate a directional histogram based on momentum shifts.

RSX_in_Color
Indicator

RSX_in_Color

This indicator calculates a smoothed momentum value derived from price velocity to identify overextended market conditions across three distinct visual zones.

Indicator

RSX_MTF

Indicator

RSX_MTF_v1

Indicator

RSX_MTF_v2

rsx_v1
Indicator

rsx_v1

This indicator calculates a smoothed momentum value by applying successive weighted moving average filters to the price range and identifying overextended trends.

RSX_v2
Indicator

RSX_v2

This indicator calculates a smoothed momentum value by applying multiple stages of weighted smoothing and absolute difference processing to identify price velocity.

rsx_v3
Indicator

rsx_v3

This indicator calculates a multi-stage weighted moving average of price fluctuations to determine the relative strength and momentum of an asset on a 0-100 scale.

RuleOf9 Kantor Basket
Indicator

RuleOf9 Kantor Basket

This indicator aggregates real-time price fluctuations across eight major forex pairs to calculate a smoothed, multi-currency sentiment score that detects significant trend reversals through cumulative momentum shifts.

RuleOf9
Indicator

RuleOf9

This indicator calculates a cumulative sum of price deviations across multiple timeframes to identify structural trend exhaustion and potential reversals based on specific threshold triggers.

RVI indicator
Indicator

RVI indicator

This indicator quantifies relative price action by calculating the ratio between weighted sum of candle bodies and historical high-low ranges to identify momentum exhaustion.

RVI
Indicator

RVI

The logic calculates a momentum ratio by averaging body-to-range volatility across multiple periods to identify directional strength and smoothness via a weighted signal line.

RVI_v1
Indicator

RVI_v1

This indicator quantifies momentum by calculating a weighted ratio between the normalized price body progression and the total range volatility over a defined period.

RVI_v2
Indicator

RVI_v2

This indicator calculates a momentum ratio by comparing the weighted average of body-based price movements against total range fluctuations over a specified lookback period.

rvmFractalsLevel
Indicator

rvmFractalsLevel

This indicator identifies structural price extremes via recursive fractal analysis and automatically projects nested Fibonacci fans based on the most recent significant trend expansion.

rvmFractalsLevel_v1
Indicator

rvmFractalsLevel_v1

This indicator identifies structural local extrema to project automated Fibonacci fan zones and dynamic supply-demand boundary levels based on price rejection mechanics.

rvmFractalsLevel_v2
Indicator

rvmFractalsLevel_v2

This indicator dynamically projects multi-level Fibonacci projection fans by identifying local fractal extremes and calculating harmonic price subdivisions.

rvmFractalsLevel_v3
Indicator

rvmFractalsLevel_v3

This indicator identifies structural high and low fractal levels to project dynamic support/resistance zones and automatically plots synchronized Fibonacci fans based on price extremes.

rvmGann_sv2
Indicator

rvmGann_sv2

This indicator identifies structural trend shifts by monitoring sequential price extremes and tracking consecutive high or low price violations to pinpoint volatility pivots.

rvmGann_sv2_v1
Indicator

rvmGann_sv2_v1

This indicator identifies structural market shifts by monitoring consecutive local price extremes and tracking pivot points to visualize trend continuity.

rvmGann_sv6
Indicator

rvmGann_sv6

This indicator identifies sequential price extremes and projects linear trend paths based on historical structural break-outs.

rvmGann_sv7
Indicator

rvmGann_sv7

This indicator identifies structural market pivots and trend shifts by calculating extreme price sequences and tracking recursive price expansion to map significant highs and lows.

rvmGann_sv8
Indicator

rvmGann_sv8

This indicator identifies structural market pivots by tracking extreme price sequences and multi-bar volatility thresholds to map significant trend reversals.

rvmGann_sv8_n
Indicator

rvmGann_sv8_n

This indicator identifies structural market turning points by analyzing the sequential progression of highs and lows to detect significant price breakouts and trend reversals.

rvmGann_sv8_n_v1
Indicator

rvmGann_sv8_n_v1

This indicator identifies structural price pivot points by tracking sequential extreme breakouts and local high/low volatility thresholds.

RWI
Indicator

RWI

iATR

This indicator differentiates between structured directional movement and erratic price noise by quantifying the statistical variance of price displacement against ATR-scaled volatility.

RWM
Indicator

RWM

iWPR

This indicator utilizes triple exponential smoothing on the Williams Percent Range (WPR) to identify trend reversals and momentum extremes through specific threshold triggers.

ryan_jones_sm
Indicator

ryan_jones_sm

iMA

The indicator identifies reversal signals by evaluating the convergence of historical moving average shifts against specific price action boundaries from two distinct historical offsets.

RZI
Indicator

RZI

The algorithm calculates a cumulative progression of price extremes by incrementing or decrementing values based on consecutive relative peaks and troughs.

r_Gator
Indicator

r_Gator

iMA

This indicator calculates a multi-dimensional average by synthesizing twenty-eight distinct moving average variations across three different time periods to identify dominant price trends.

R_Volatility_I
Indicator

R_Volatility_I

iStdDev

This indicator quantifies relative price strength by calculating the ratio between high and low standard deviations smoothed via exponential moving averages.

s Indicator [i]
Indicator

s Indicator [i]

This tool identifies trend reversals by detecting extreme price action displacement within the lower or upper 20% velocity zones of preceding candles.

s Indicator [i]_v1
Indicator

s Indicator [i]_v1

Identifies reversal opportunities by detecting extreme price expansion between the open and close relative to a 20% volatility threshold or specific inside bar contraction patterns.

s-Downloader
Indicator

s-Downloader

This script automates the retrieval of historical price data by iterating through the 'Market Watch' list and simulating keyboard inputs to refresh chart history across multiple timeframes.

Indicator

s-gorizontali

s-ReConnect
Indicator

s-ReConnect

This script monitors server connectivity and automatically initiates account re-authentication by simulating keyboard inputs to the 'Favorite' Navigator window.

S-RoC
Indicator

S-RoC

iMA

This indicator quantifies the relative percentage change between two distinct exponential moving average values separated by a fixed period interval.