RPoint_v2
Download script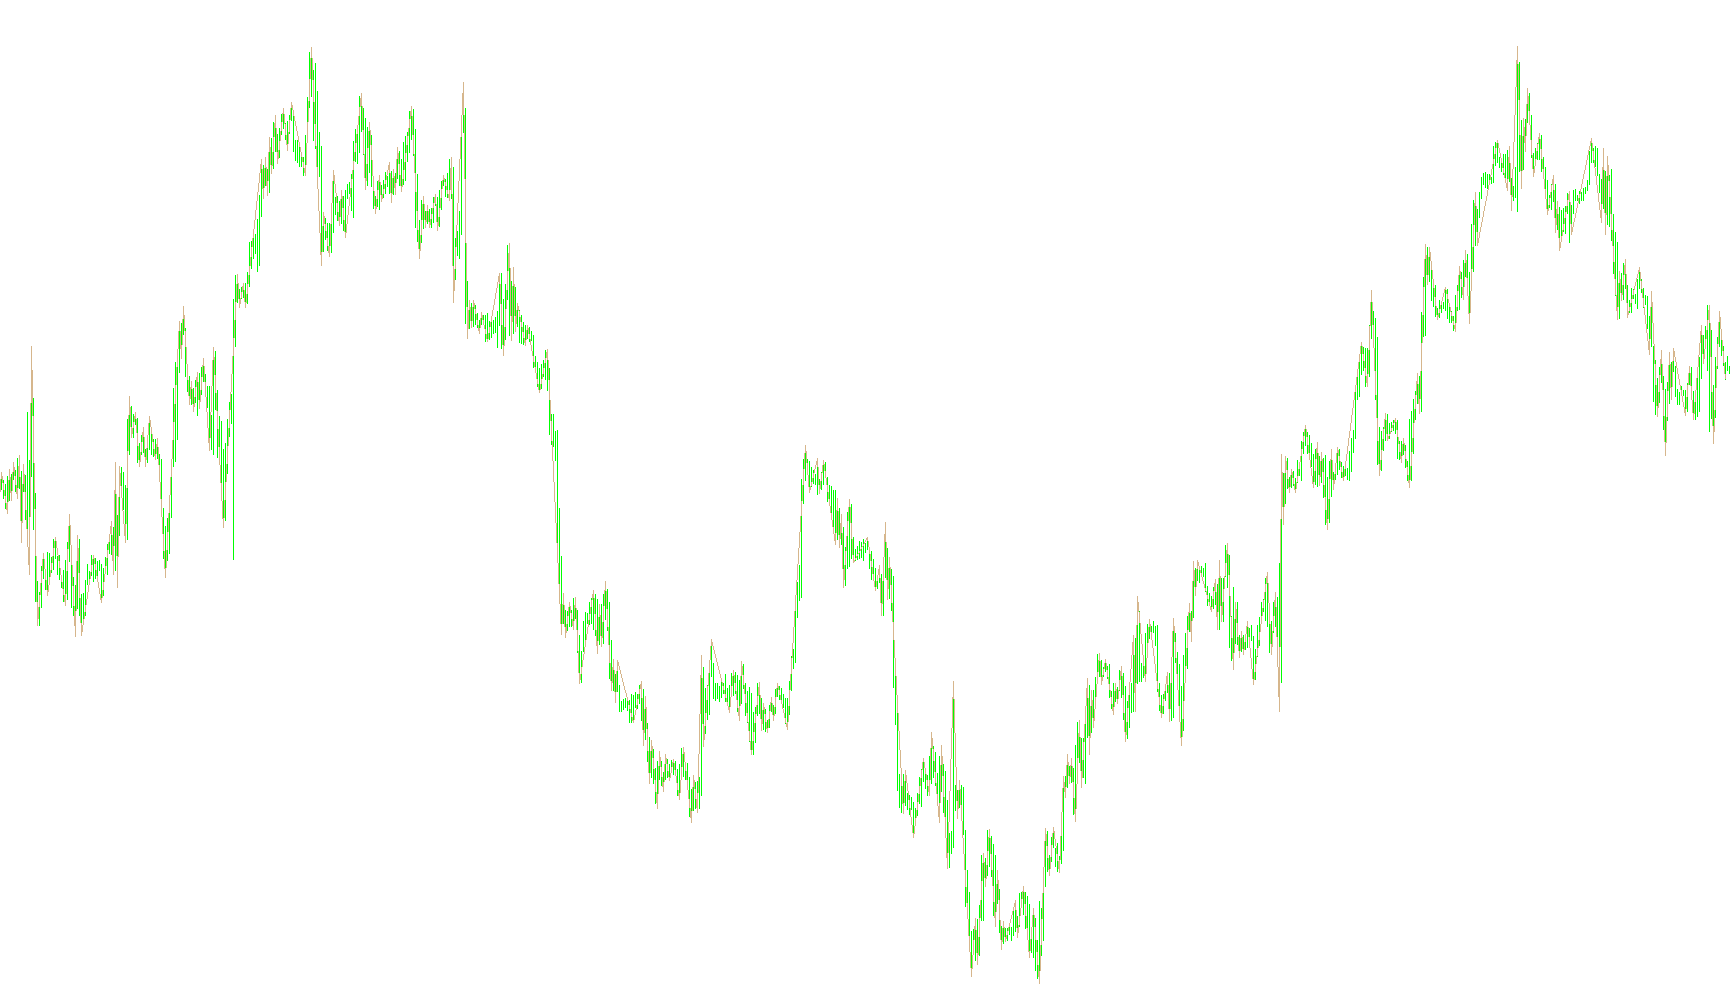
This indicator is designed to visually map out significant structural shifts in market price movements by identifying key "reversal points." Instead of just showing every minor fluctuation, it focuses on identifying when a sustained trend actually breaks and turns in the opposite direction.
Core Logic and Functionality
The script functions by monitoring the high and low prices of the market candles to determine the prevailing "trend" (either upward or downward). It works through the following logic:
1. Tracking Price Extremes The tool constantly keeps a record of the highest and lowest price points reached during a specific move. As new candles form, it compares them against these records. If the price creates a new high or low, the script updates its memory of those boundaries.
2. Trend Detection The indicator classifies the market into two primary states:
- Uptrend: When the price is moving toward higher peaks.
- Downtrend: When the price is moving toward lower troughs.
3. Identifying Reversals (The "Reversal Point") The most important feature of this script is how it decides a trend has actually changed. It uses a specific distance threshold, which you can customize as a "Reversal Point."
For example, if the market is in an uptrend, the script waits for the price to drop significantly far enough (based on your chosen point value) away from the previous high. If it drops past that specific safety margin, the script identifies this as a structural reversal rather than just a minor pull-back. It then marks this point on your chart.
4. Visual Feedback Once a reversal is confirmed, the script places a visual marker on the chart at the precise location where the trend shift was triggered. This allows you to see exactly where the momentum shifted from bullish to bearish (or vice versa), helping you visualize the "skeleton" of the price action.
Summary for the User
In simple terms, this tool acts as a filter for market noise. It ignores small wobbles in price and only highlights major structural shifts. By using your custom input, it tells you: "The trend was moving this way, but it has now moved far enough in the opposite direction that we should consider the trend broken."
//+------------------------------------------------------------------+
//|                                                       RPoint.mq4 |
//|                               Copyright © 2004, Poul_Trade_Forum |
//|                                                         Aborigen |
//|                                          http://forex.kbpauk.ru/ |
//+------------------------------------------------------------------+
#property copyright "Poul Trade Forum"
#property link      "http://forex.kbpauk.ru/"
#property indicator_chart_window
#property indicator_buffers 1
#property indicator_color1 Red
//---- input parameters
extern int ReversPoint=50;
//---- buffers
double RBuffer[];
int Trend=1,InTrend,ttime;
double Points,Last_High, Last_Low;
//+------------------------------------------------------------------+
//| Custom indicator initialization function                         |
//+------------------------------------------------------------------+
int init()
  {
   string short_name;
   Points=MarketInfo (Symbol(), MODE_POINT);
//---- indicator line
   SetIndexStyle(0,DRAW_SECTION,EMPTY,1,Tan);
   SetIndexBuffer(0,RBuffer);
   SetIndexEmptyValue(0,0);
//---- name for DataWindow and indicator subwindow label
   short_name="RPoint";
   IndicatorShortName(short_name);
   SetIndexLabel(0,short_name);
//----
   SetIndexDrawBegin(0,100);
//----
   return(0);
  }
//+------------------------------------------------------------------+
//| Custor indicator deinitialization function                       |
//+------------------------------------------------------------------+
int deinit()
  {
//---- TODO: add your code here
//----
   return(0);
  }
//+------------------------------------------------------------------+
//| Custom indicator iteration function                              |
//+------------------------------------------------------------------+
int start()
  {
   int    counted_bars=IndicatorCounted(),i,shift;
//---- TODO: add your code here
   i=(Bars-counted_bars)-1;
//----
   for(shift=i; shift>=0;shift--)
     {
      if (Time[shift]!=ttime) InTrend=InTrend+1;
      ttime=Time[shift];
      RBuffer[shift]=0;
      if (High[shift+1]>Last_High && Trend==1)  InTrend=1;
      if (Low[shift+1]<Last_Low   && Trend==0)   InTrend=1;
      if (High[shift+1]>Last_High) Last_High=High[shift+1];
      if (Low[shift+1]<Last_Low)   Last_Low=Low[shift+1];
//----
      if (Trend==1 && Low[shift+1]<Last_High-ReversPoint*Points && InTrend>1)
        {
         Trend=0;
         RBuffer[shift+InTrend]=High[shift+InTrend];
         Last_High=Low[shift+1];
         Last_Low=Low[shift+1];
         InTrend=1;
        }
      if (Trend==0 && High[shift+1]>Last_Low+ReversPoint*Points && InTrend>1)
        {
         Trend=1;
         RBuffer[shift+InTrend]=Low[shift+InTrend];
         Last_Low=High[shift+1];
         Last_High=High[shift+1];
         InTrend=1;
        }
      //----
     }
   return(0);
  }
//+------------------------------------------------------------------+
Comments