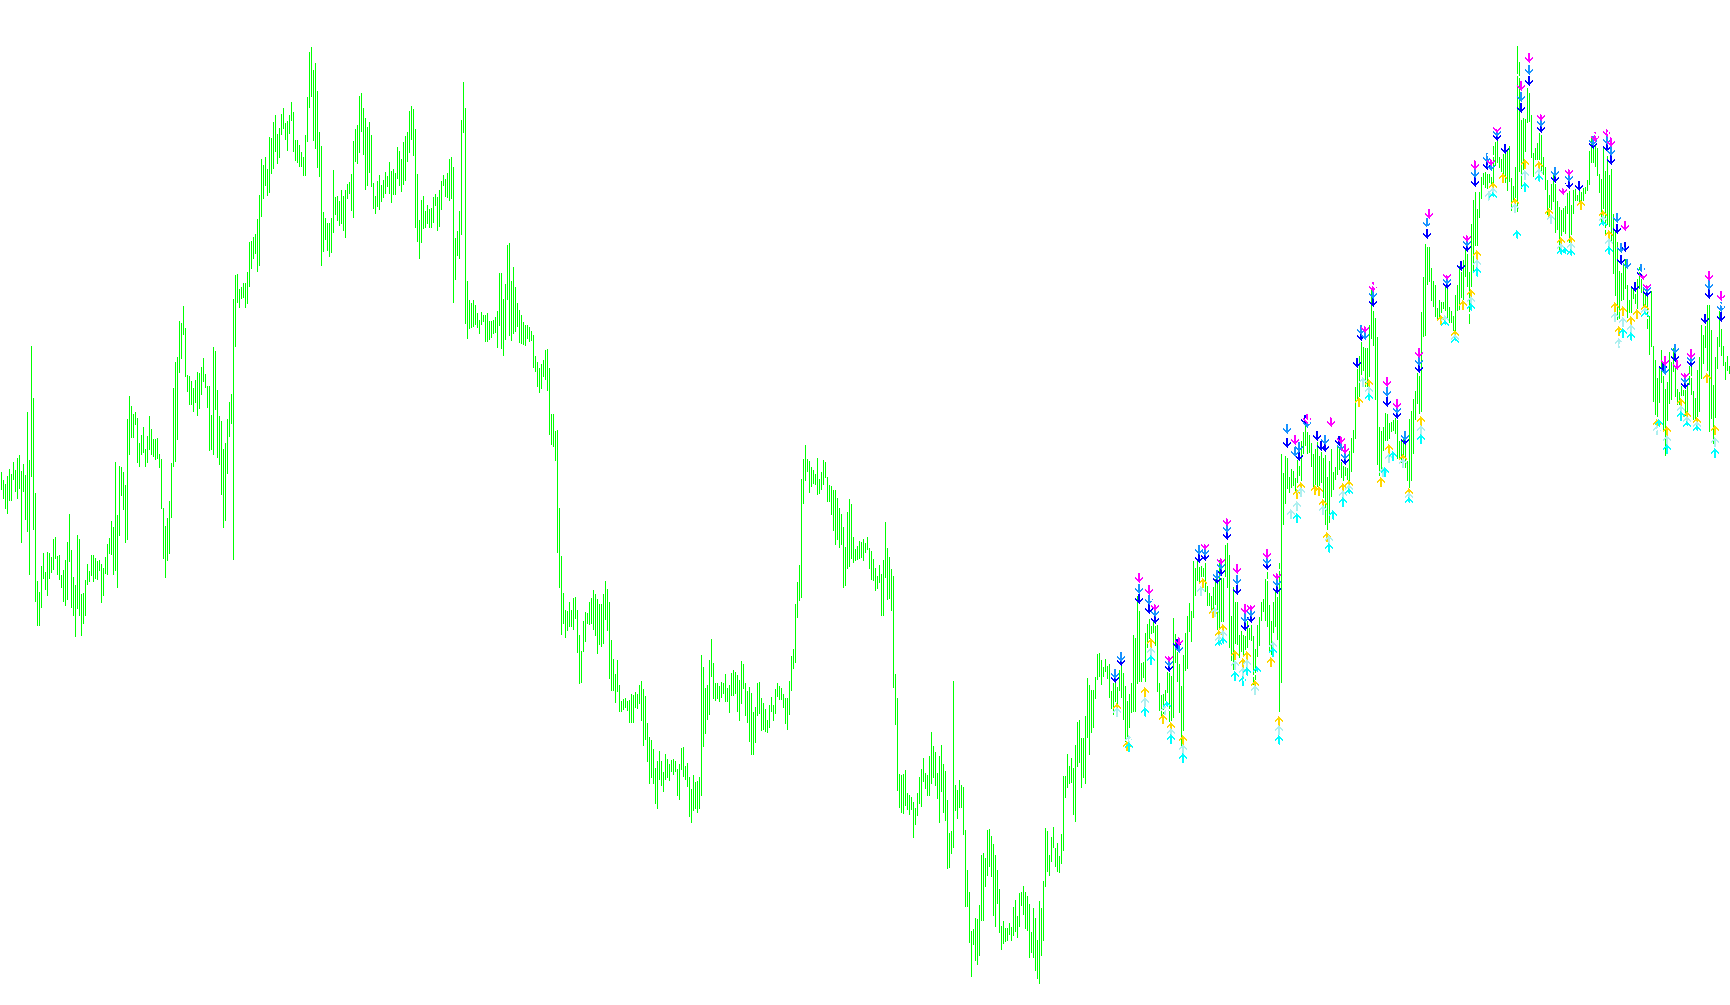
RSI_2SigMAs_mtf
Indicator

RSI_2SigMAs_mtf

iMAOnArrayiRSI

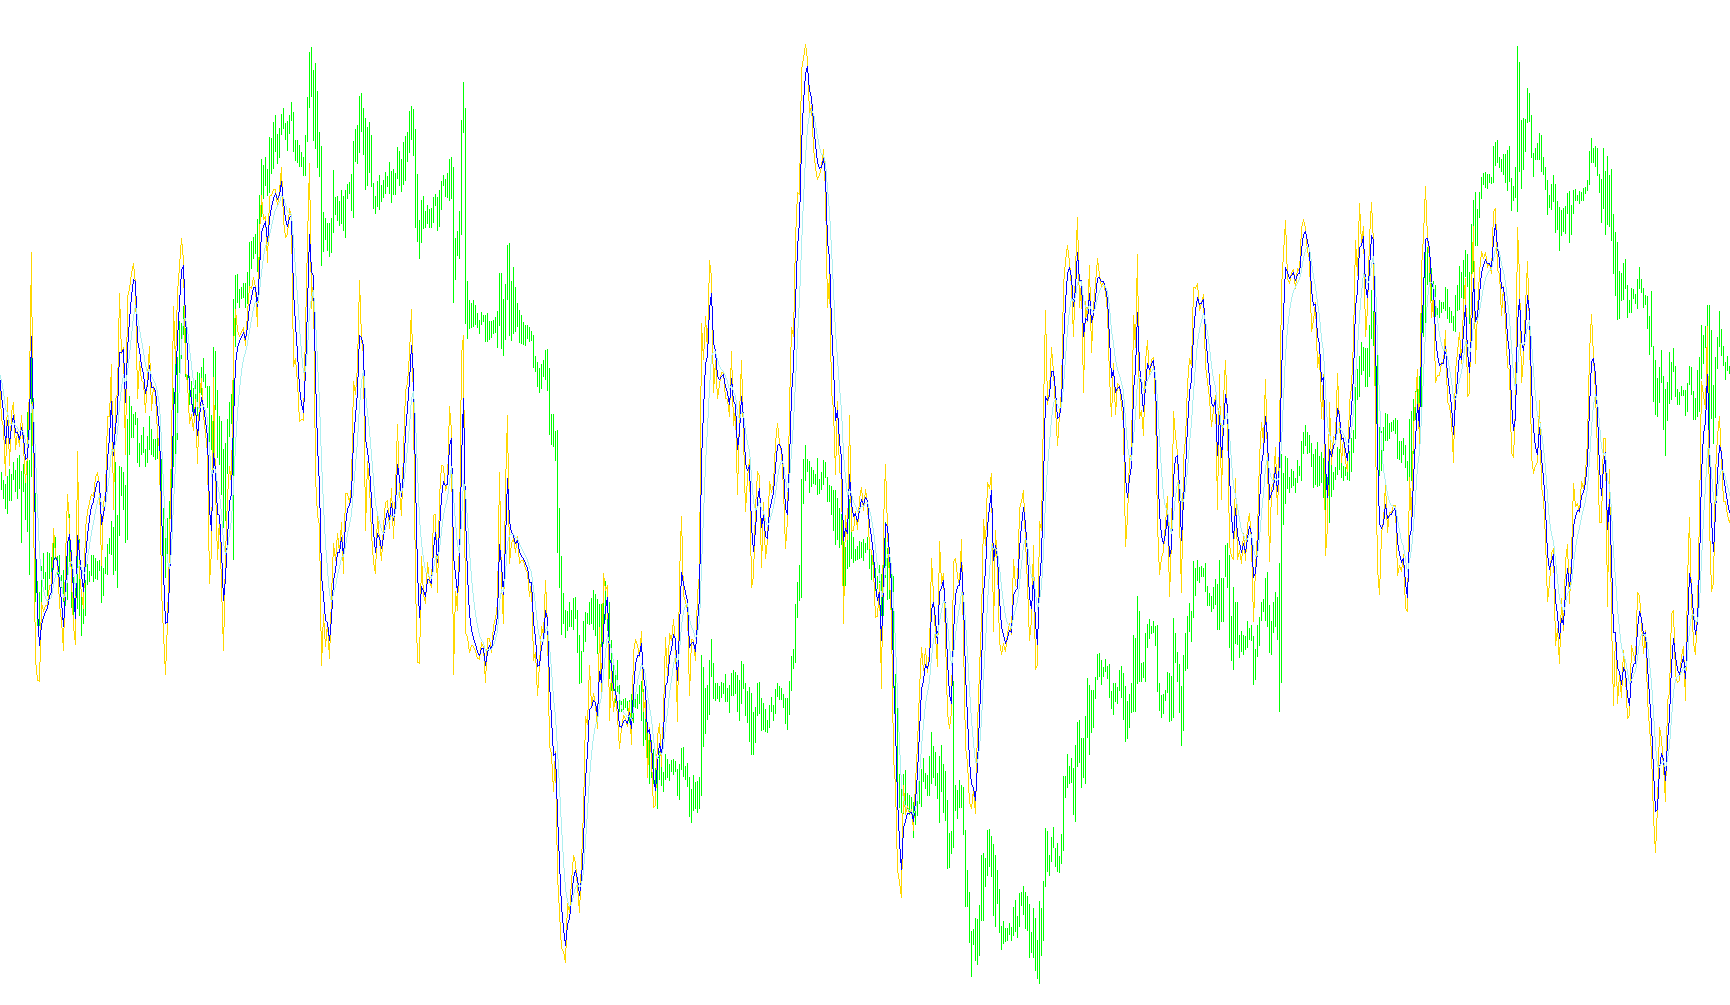
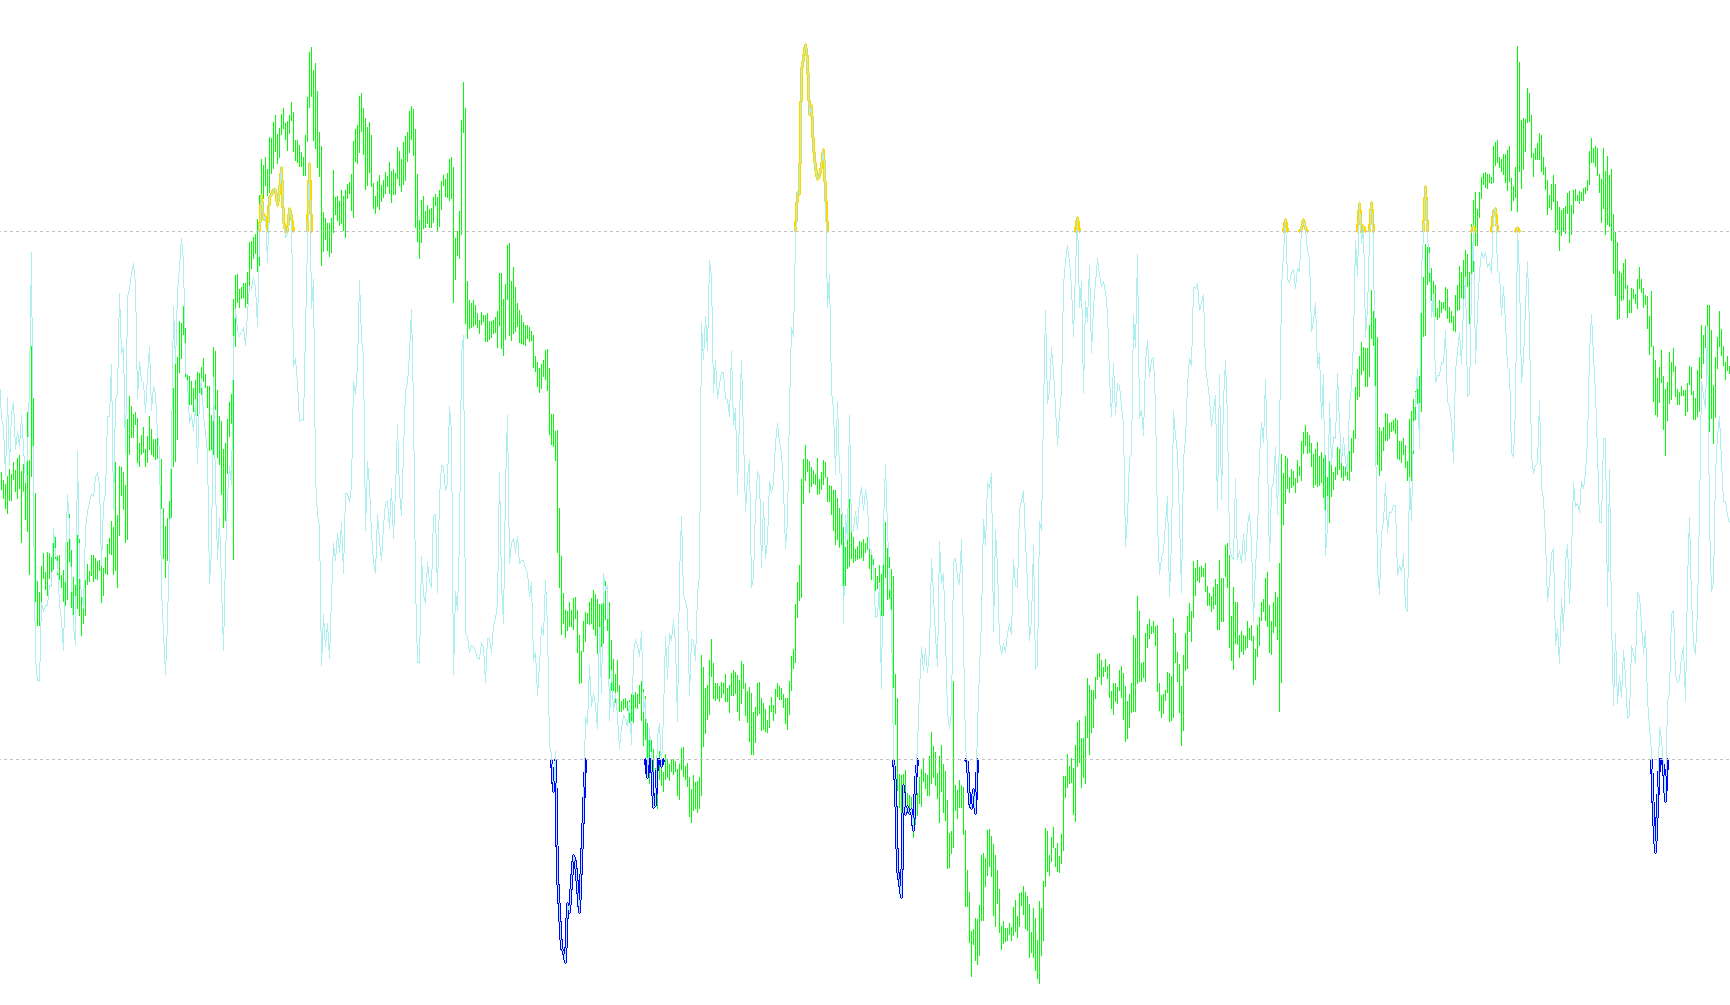
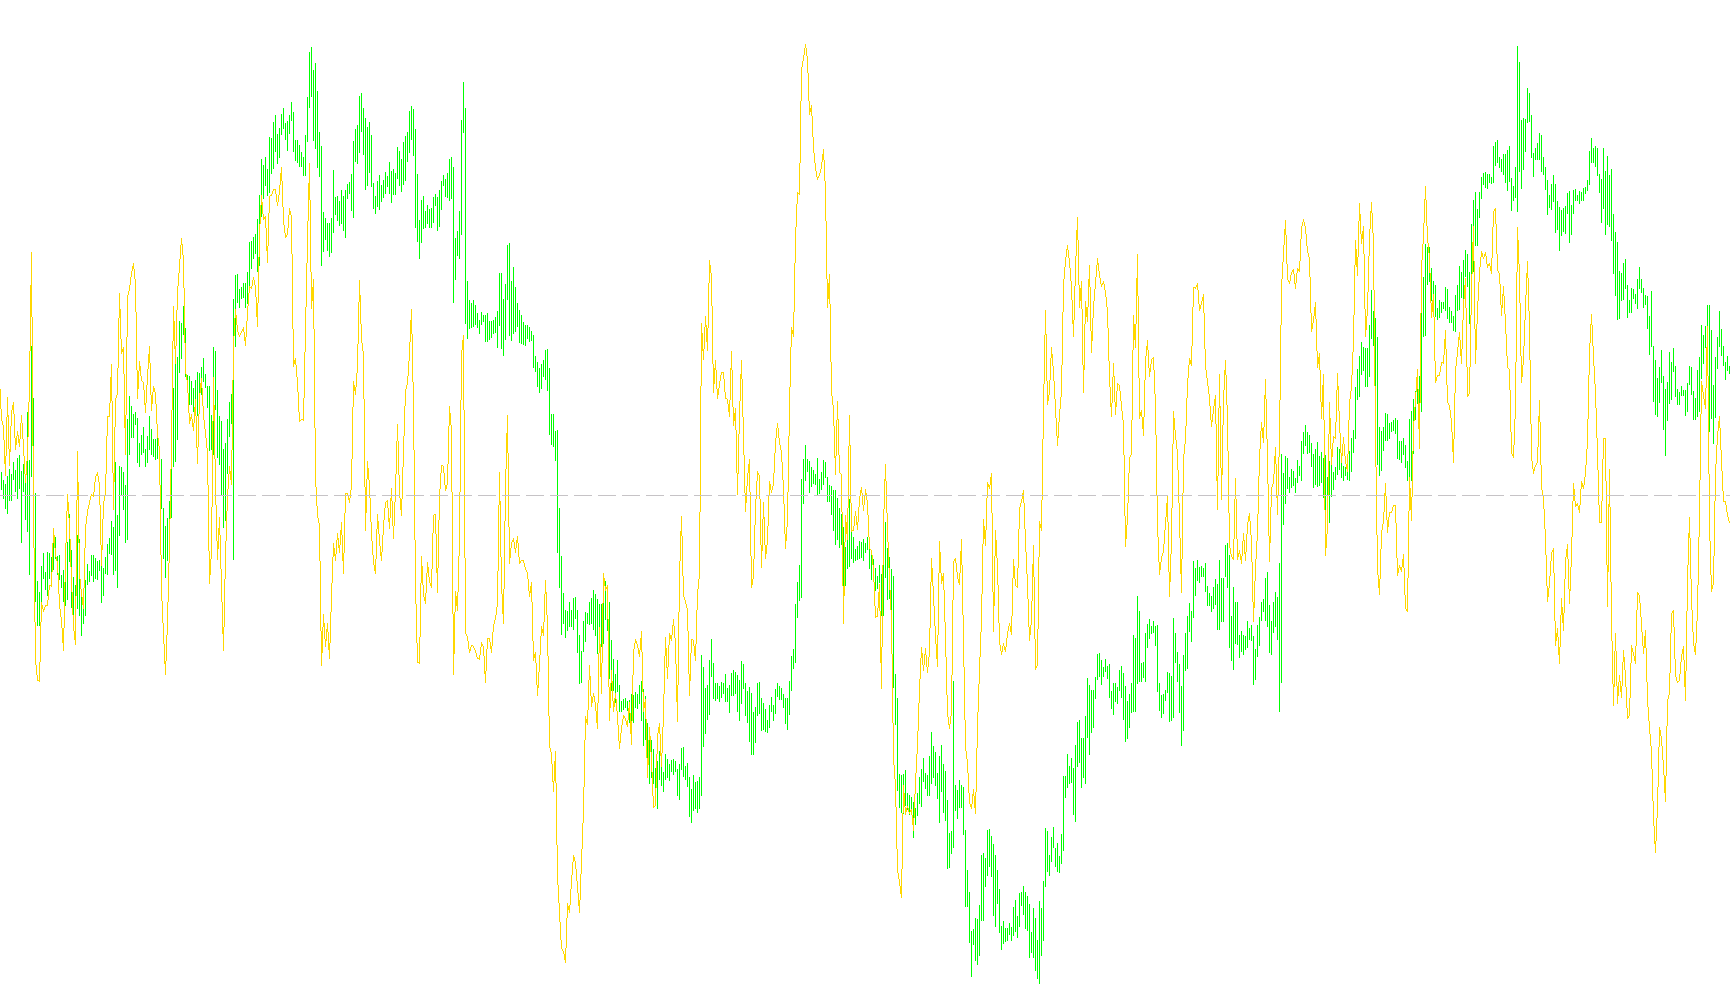
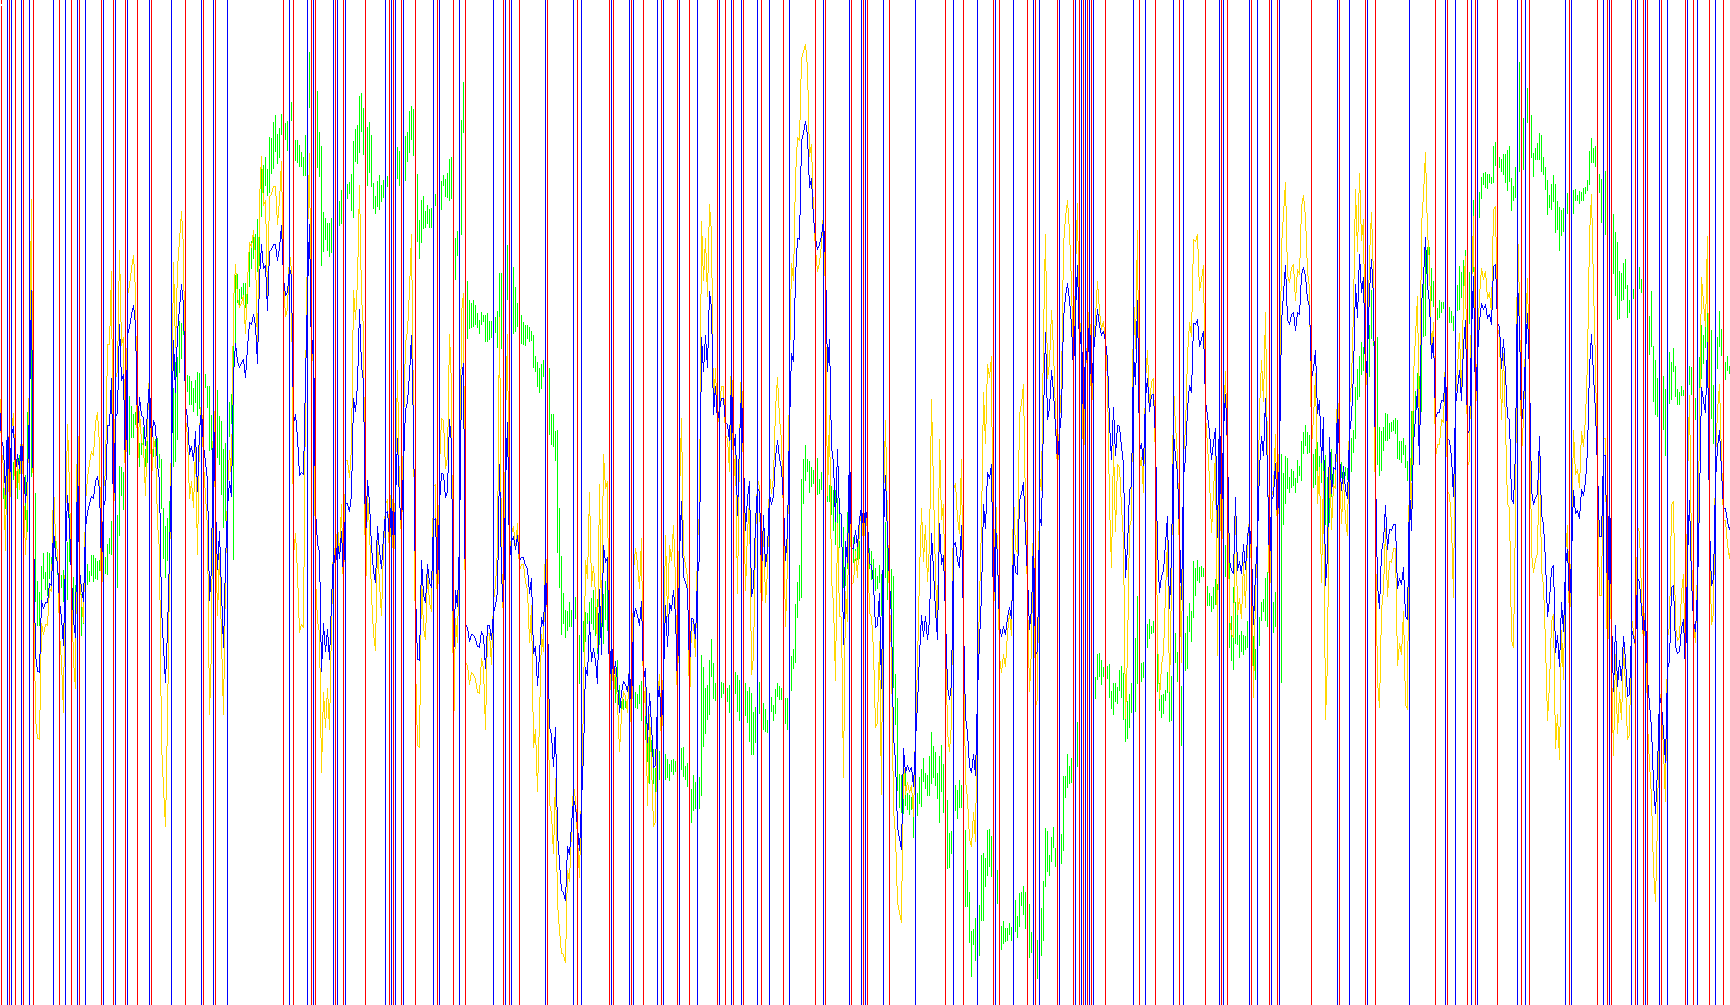
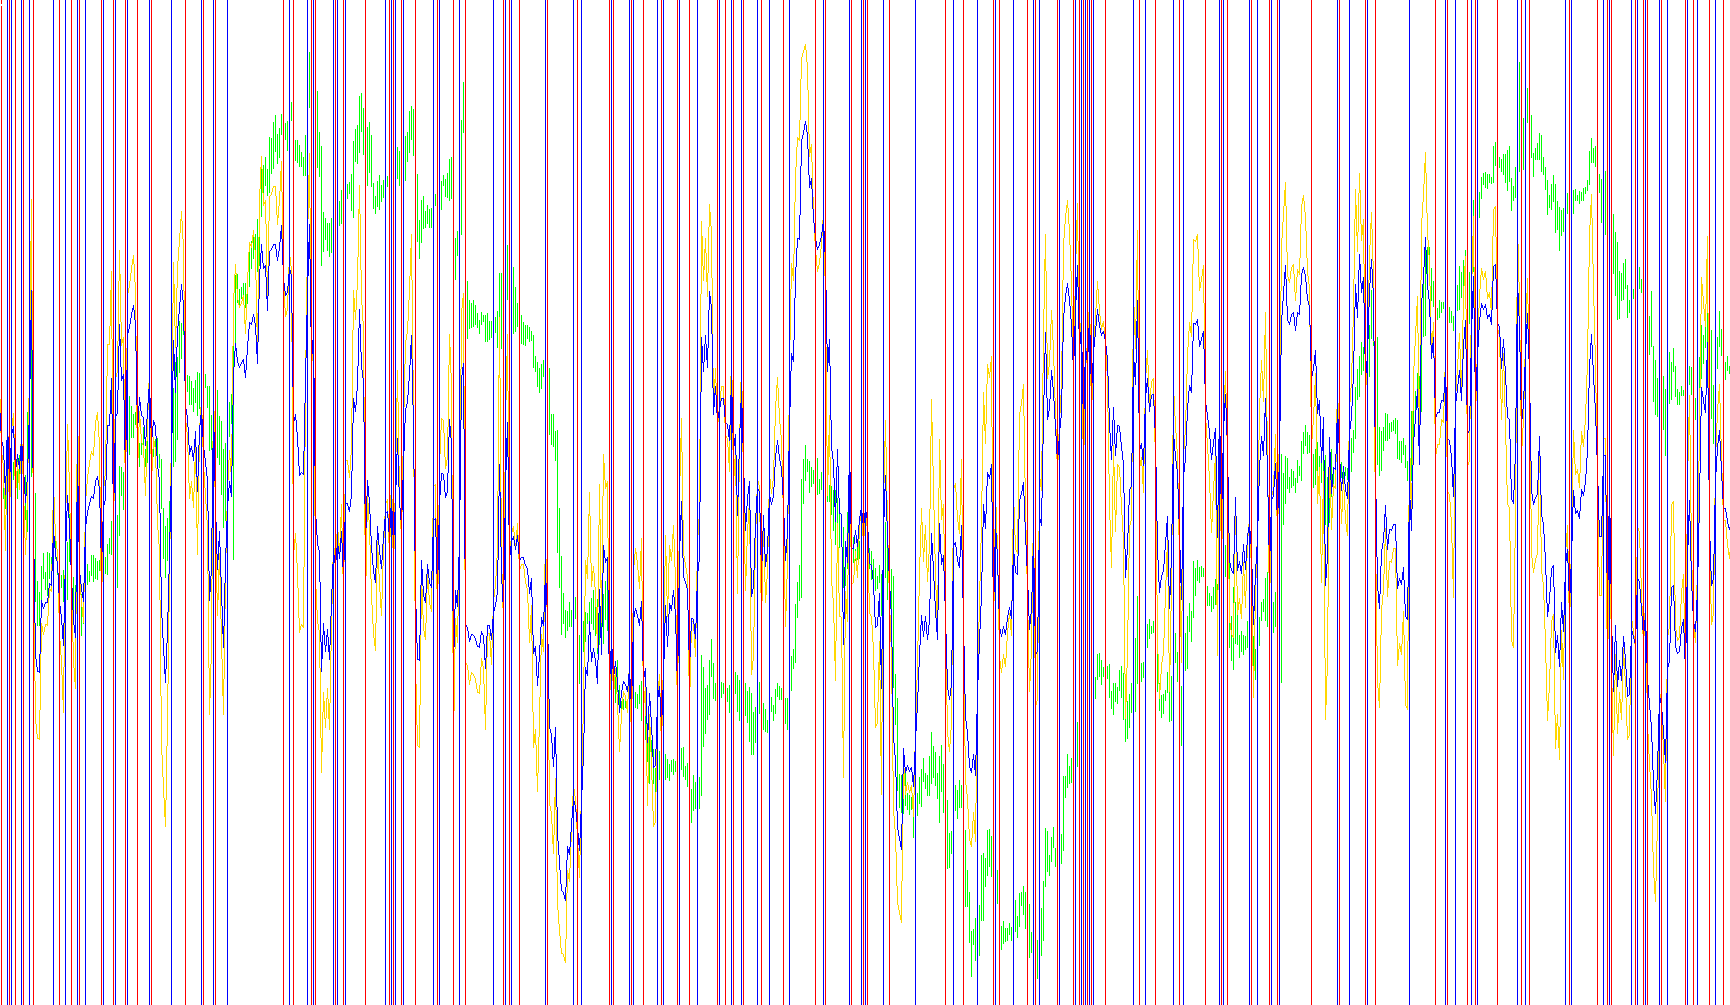
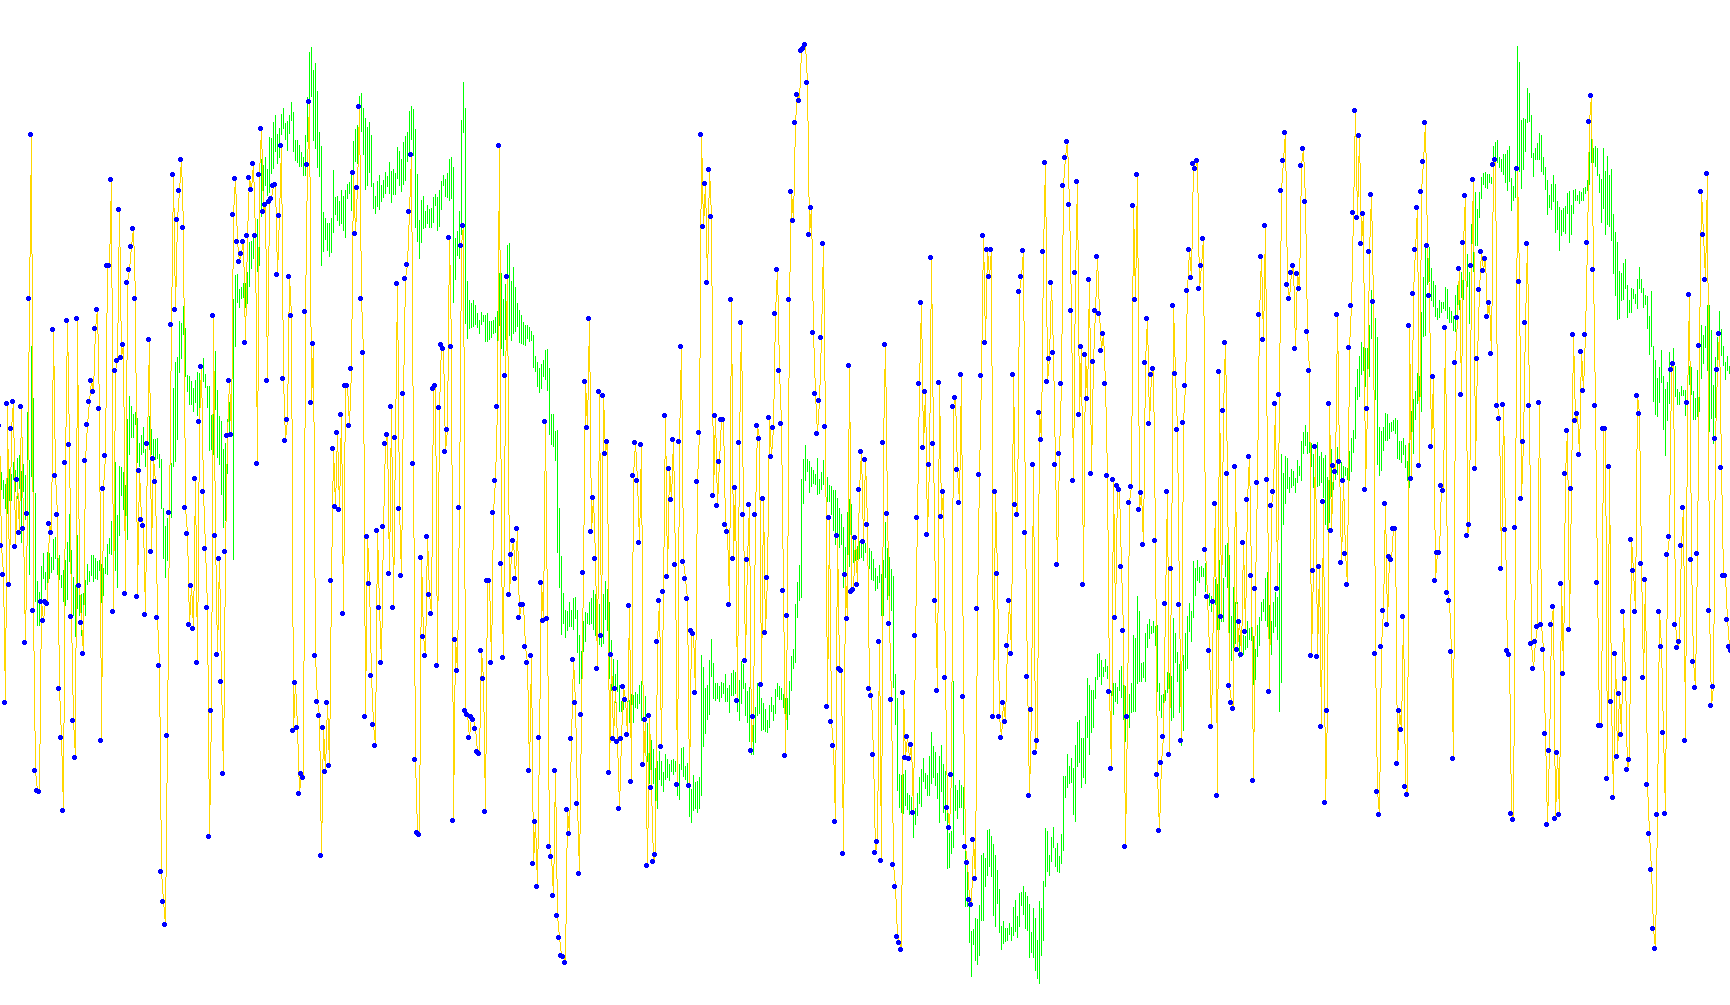
This indicator calculates a Relative Strength Index on a higher timeframe and applies dual moving average smoothing to visualize momentum trends across multiple intervals.
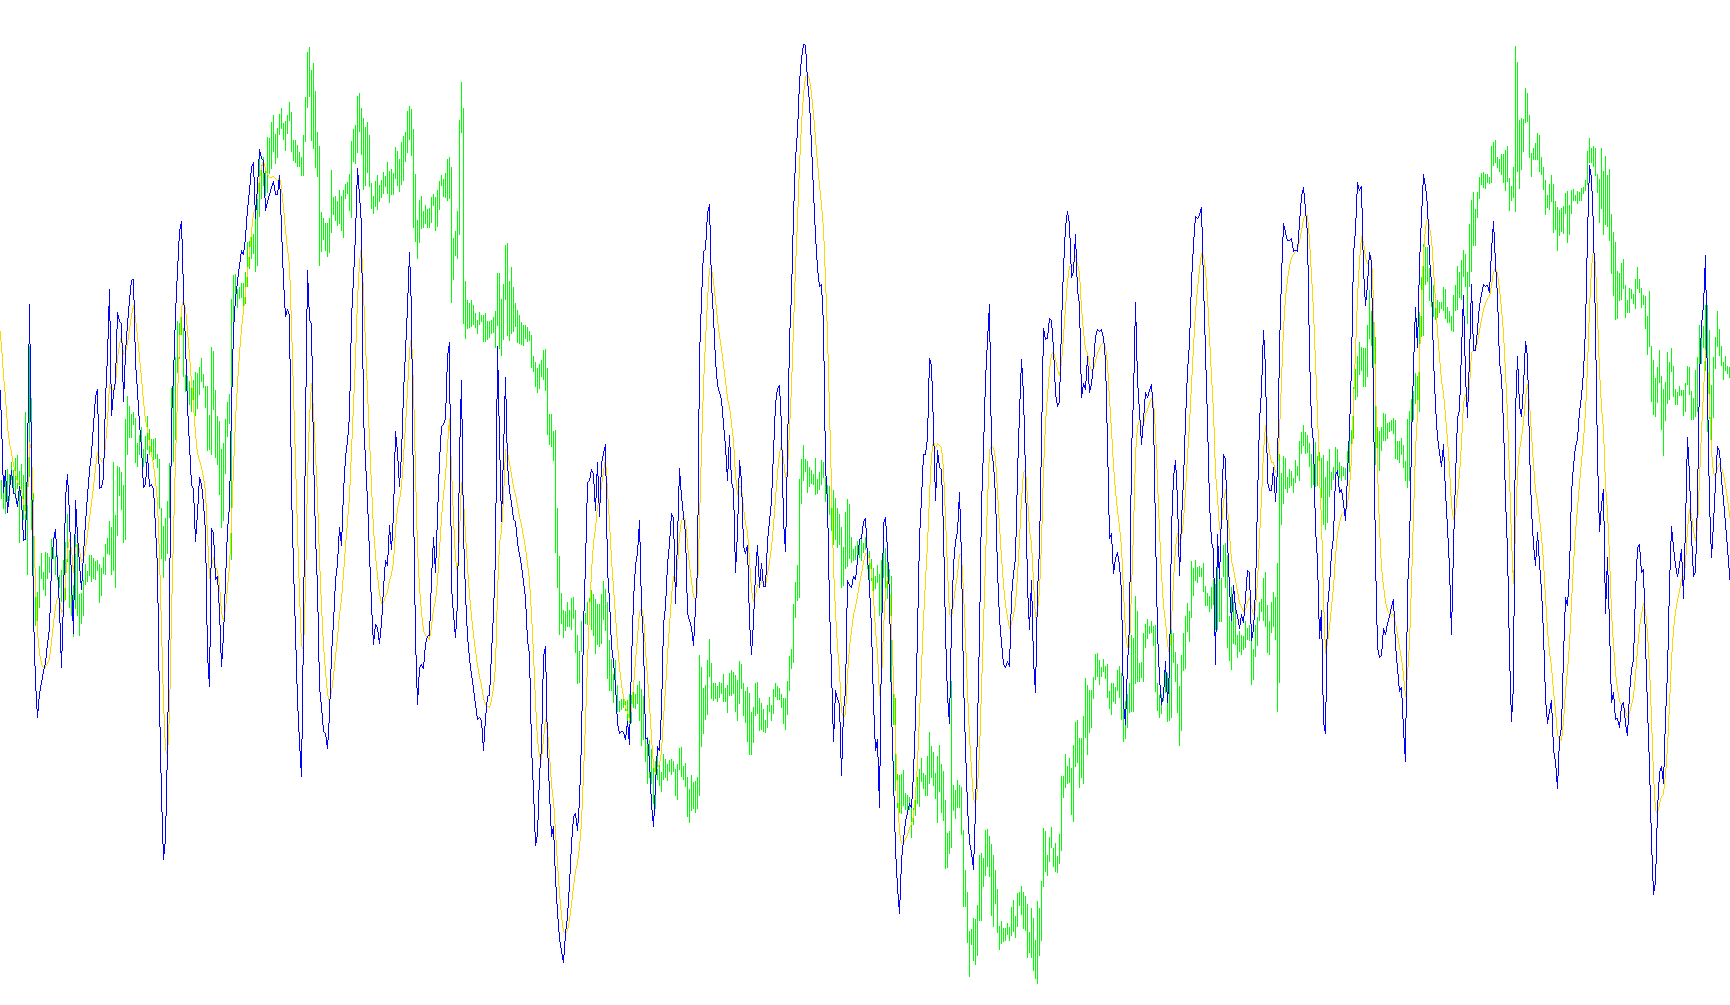
RSI_2SigMA_mtf
Indicator

RSI_2SigMA_mtf

iMAOnArrayiRSI

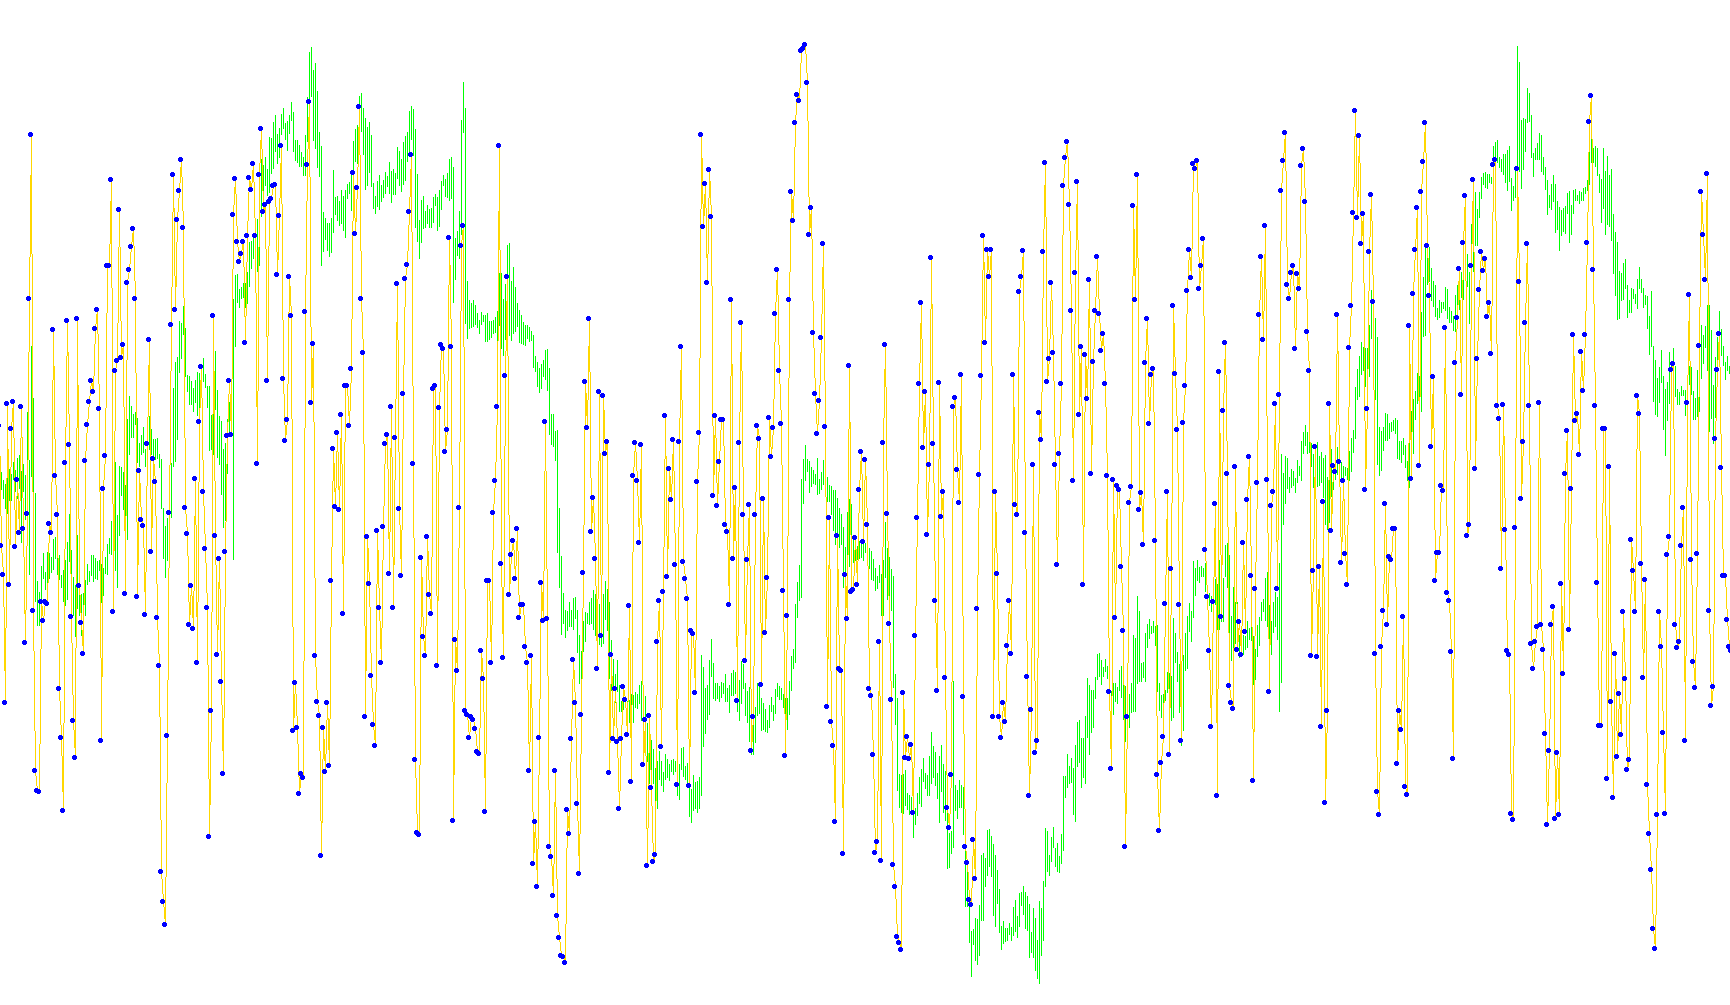
This indicator calculates a Relative Strength Index across specified higher timeframes and applies nested moving average smoothing to filter out noise and identify primary momentum shifts.

RSI_C
Indicator

RSI_C

iRSI

This indicator isolates and visualizes specific RSI price movements that exceed predefined upper and lower volatility boundaries.

RSI_channel_
Indicator

RSI_channel_

iRSI

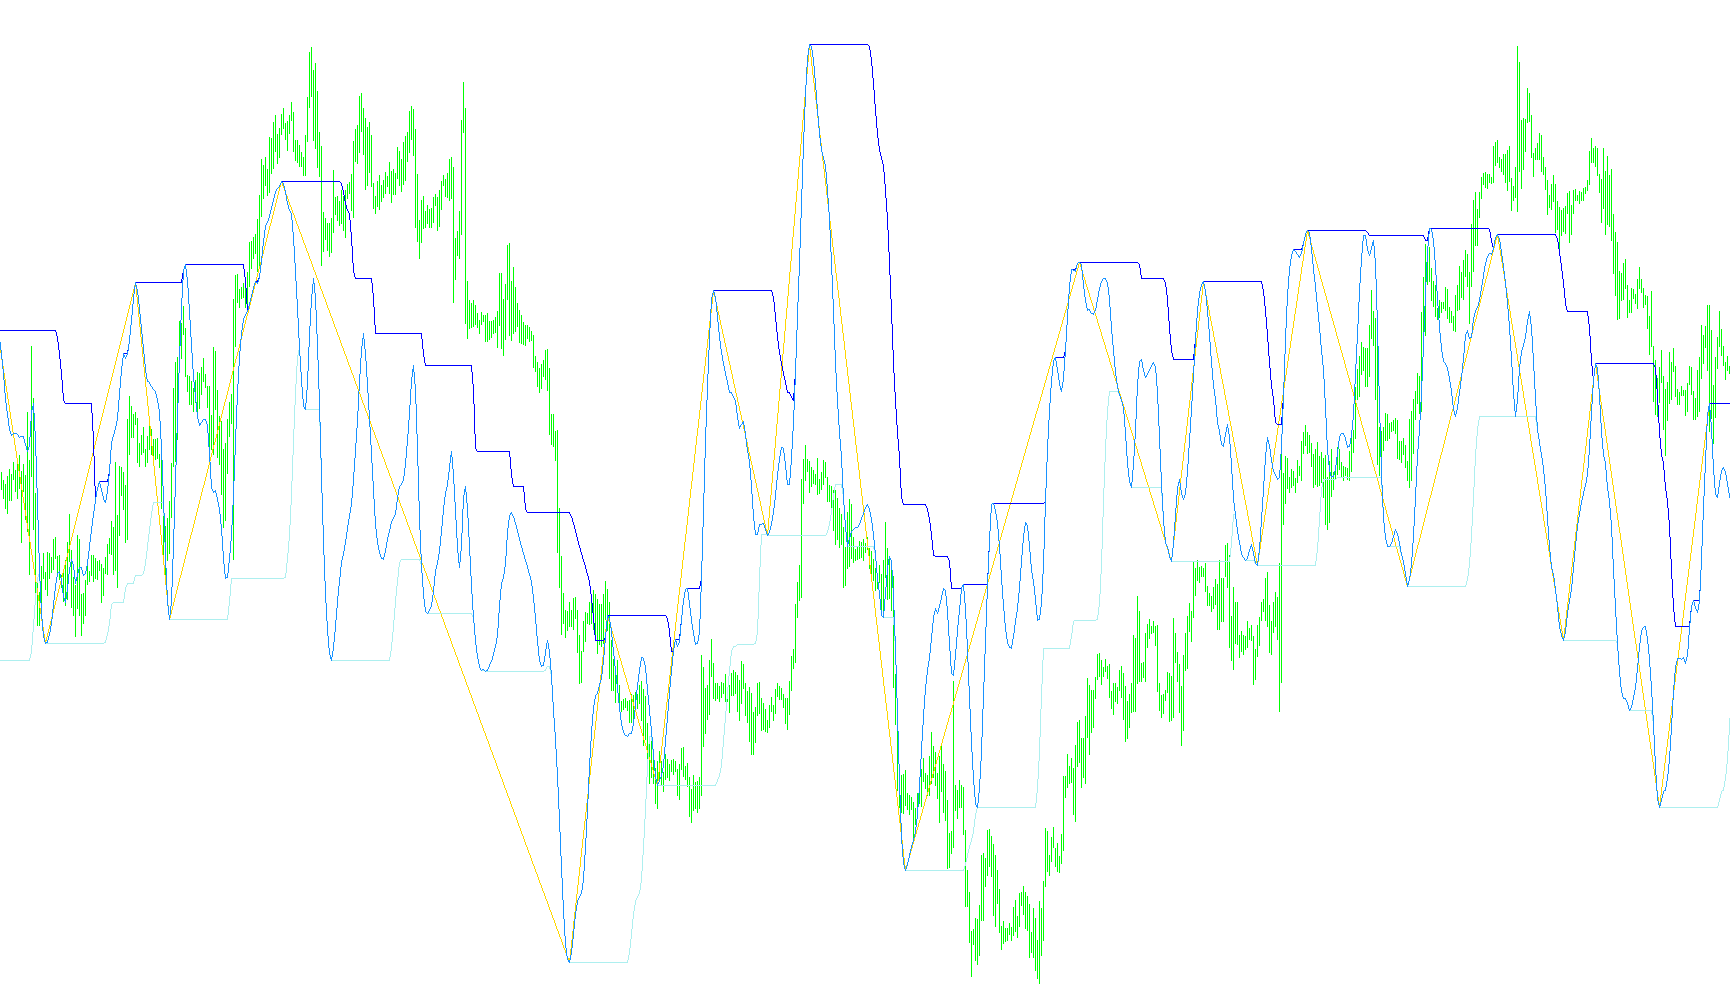
This indicator identifies trend extremes by applying a T3 smoothing filter to the Relative Strength Index and overlaying a dynamic volatility channel with integrated ZigZag structure identification.

RSI_channel_sig
Indicator

RSI_channel_sig

iATRiRSI

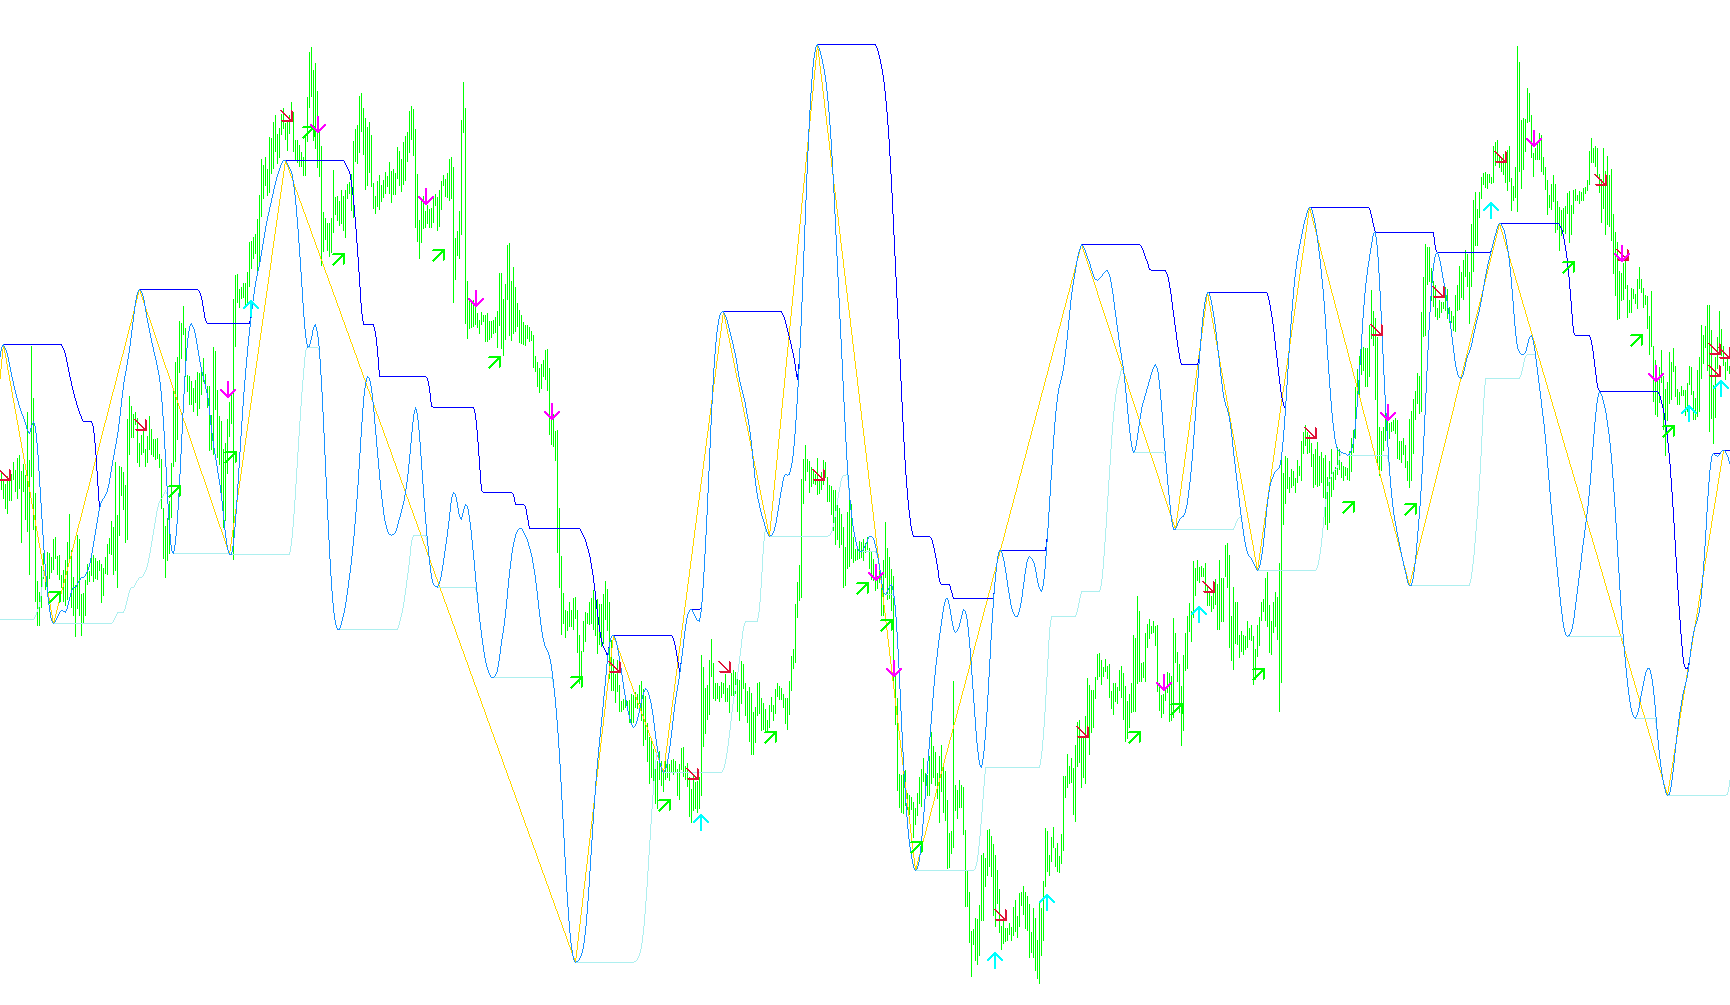
This indicator identifies trend reversals and momentum shifts by applying a T3 moving average filter to Relative Strength Index values within a dynamic high-low price channel.

RSI_channel_sig_2
Indicator

RSI_channel_sig_2

iATRiRSI

This indicator identifies momentum reversals by applying a T3 smoothing filter to the Relative Strength Index and detecting breaches of dynamically calculated high-low price channels.

RSI_CL
Indicator

RSI_CL

iRSI

This indicator monitors Relative Strength Index levels and dynamically renders colored horizontal line objects to visually flag persistent overbought or oversold conditions.

RSI_Coloured_Final
Indicator

RSI_Coloured_Final

iRSI

This indicator identifies and visualizes price momentum extremes by dynamically tracking and isolating instances where the Relative Strength Index penetrates pre-defined overbought and oversold boundaries.

RSI_Cross50_Alert
Indicator

RSI_Cross50_Alert

iRSI

The system triggers real-time notifications when the Relative Strength Index transitions through the neutral 50-level threshold, identifying shifts in market momentum.

Indicator

RSI_Crosses_Lib_Sample

iMAOnArrayiRSI
RSI_Crossing_50_plus_ATR_ver1.2_FXA0
Indicator

RSI_Crossing_50_plus_ATR_ver1.2_FXA0

iATRiRSI

This indicator identifies trend reversals and position additions by detecting RSI crossings at the 50 midline, using ATR-based volatility to project dynamic entry and stop-loss levels.

RSI_Cross_Alert
Indicator

RSI_Cross_Alert

iMAOnArrayiRSIiStochastic

This indicator identifies trend shifts by detecting bullish or bearish crossovers between two RSI oscillators with optional smoothing and Stochastic momentum verification.

RSI_Cross_Alert_Stoch
Indicator

RSI_Cross_Alert_Stoch

iMAOnArrayiRSIiStochastic

This indicator identifies bullish and bearish entries by detecting the intersection of two different RSI periods, with an optional Stochastic momentum filter for signal validation.

RSI_Del_WA__mtf
Indicator

RSI_Del_WA__mtf

iMAOnArrayiRSI

This indicator calculates the mathematical difference between two Relative Strength Index periods and applies a Simple Moving Average to visualize momentum velocity across multiple timeframes.

RSI_DeMarker_Super_Position
Indicator

RSI_DeMarker_Super_Position

iDeMarkeriMAOnArrayiRSI

This indicator synthesizes RSI and DeMarker oscillators into a unified super-position to detect price momentum shifts and divergence patterns via dual-weighted moving averages.

Indicator

RSI_Directions_Lib_Sample

iRSI
RSI_dots
Indicator

RSI_dots

This indicator visualizes relative strength momentum by calculating a smoothed moving average of price velocity over a user-defined period.

RSI_dots1
Indicator

RSI_dots1

This indicator visualizes momentum dynamics by plotting directional points based on a smoothed Relative Strength Index calculation.

Indicator

RSI_DynamicZone_RSI

iRSI
Indicator

RSI_DynamicZone_RSI_BzFLBL_mtf_20080806

iRSI
Indicator

RSI_DynZ_TDI_mtf

iMAOnArrayiRSI
Indicator

RSI_EMA_COL

iMAOnArrayiRSI
RSI_EMA_MTF
Indicator

RSI_EMA_MTF

iMAOnArrayiRSI

This indicator projects a smoothed moving average of the Relative Strength Index from a higher timeframe onto the current chart to identify long-term momentum trends.

Indicator

RSI_Extremums_Lib_Sample

iRSI
RSI_Filter_mtf
Indicator

RSI_Filter_mtf

iRSI

This indicator categorizes RSI values into four distinct behavioral states—strong bullish, bullish trend, bearish trend, and strong bearish—based on Fibonacci retracement levels across multiple timeframes.

RSI_Filter_vX2D2alert_mtf
Indicator

RSI_Filter_vX2D2alert_mtf

iRSI

This indicator identifies multi-timeframe trend regimes and momentum shifts by filtering RSI values into four distinct intensity zones with automated cross-level alerts.

RSI_Filter_vX2D2alert_mtf_003
Indicator

RSI_Filter_vX2D2alert_mtf_003

iRSI

This indicator analyzes relative strength across multiple timeframes to identify trend intensities, highlighting bullish and bearish momentum zones based on specific threshold breaches.

Indicator

RSI_Levels_Lib_Sample

iRSI
Indicator

RSI_Lib_Sample

iMAOnArrayiRSI
RSI_LiDo
Indicator

RSI_LiDo

iRSI

This indicator visualizes rapid-period Relative Strength Index fluctuations by overlaying specific signal dots onto a smoothed momentum line to highlight price velocity.

RSI_LiDo1
Indicator

RSI_LiDo1

iRSI

This indicator calculates high-frequency relative strength values using a customizable period and overlays visual markers to identify momentum shifts.

RSI_LiDo1_open
Indicator

RSI_LiDo1_open

iRSI

This indicator captures price momentum by plotting Relative Strength Index values with custom visual markers to identify overextended market conditions.

RSI_LiDo2
Indicator

RSI_LiDo2

iRSI

A high-sensitivity Relative Strength Index derivative that visualizes momentum shifts through precise price action mapping and dynamic plotting.

Rsi_Lido_SuperRsi_v1.92_Compatible2
Indicator

Rsi_Lido_SuperRsi_v1.92_Compatible2

iRSI

This indicator calculates Relative Strength Index values while utilizing global variables to maintain synchronized period settings across multiple charts and platform restarts.

RSI_MA_LevelSignal
Indicator

RSI_MA_LevelSignal

iMAiRSI

This indicator identifies bullish and bearish entries by detecting RSI oversold/overbought breakouts synchronized with EMA trend alignment and dynamic price range volatility.

RSI_mtf
Indicator

RSI_mtf

iRSI

This indicator calculates the relative strength of price velocity across specific higher timeframes to identify potential overbought or oversold conditions.

RSI_MTF1
Indicator

RSI_MTF1

iRSI

This indicator calculates and overlays the Relative Strength Index from a user-defined higher timeframe onto the current chart for multi-dimensional momentum analysis.

RSI_MultiBuySellAvg
Indicator

RSI_MultiBuySellAvg

iRSI

This indicator calculates and plots the arithmetic mean of Relative Strength Index (RSI) values across two distinct baskets of currency pairs to identify collective market momentum.

RSI_on_MA_2X2_mtf
Indicator

RSI_on_MA_2X2_mtf

iMAiRSIOnArray

This indicator calculates dual Relative Strength Index values derived from smoothed moving average data across multiple timeframes to identify momentum shifts.

Rsi_R2_Opt_Indicator
Indicator

Rsi_R2_Opt_Indicator

iMAiMAOnArrayiRSI

This indicator identifies directional momentum by verifying sequential RSI growth/decay against a moving average trend, optionally filtered by Hull Moving Average velocity.

Indicator

RSI_SelfAdjustRSI_v1.0FX5_mtf

iRSIiStdDevOnArray
RSI_SevenPairsBuy
Indicator

RSI_SevenPairsBuy

iRSI

This indicator calculates and plots the individual Relative Strength Index values for multiple currency pairs simultaneously while computing a unified arithmetic mean to identify collective momentum trends.

RSI_SevenPairsSell
Indicator

RSI_SevenPairsSell

iRSI

This indicator calculates the arithmetic mean of Relative Strength Index values across multiple synchronized currency pairs to identify collective market momentum.

RSI_Strike(AM)
Indicator

RSI_Strike(AM)

iRSI

This indicator identifies bullish and bearish market shifts by detecting concurrent crossovers across four distinct pairs of Relative Strength Index oscillators with varying timeframes.

RSI_Strike(AM)_SW
Indicator

RSI_Strike(AM)_SW

iMAiRSI

This indicator identifies momentum shifts by calculating moving average differences and flagging specific crossover events across a multi-layered RSI grid.

RSI_Tokman
Indicator

RSI_Tokman

iMAOnArrayiRSI

This indicator generates real-time alerts by monitoring the smoothed moving average of the Relative Strength Index to detect precise crossovers around the 50-level equilibrium.

RSI_to_File
Indicator

RSI_to_File

Iterates through a predefined list of currency pairs and multiple timeframes to archive historical price action and Relative Strength Index values into separate CSV files.

RSI_Trend
Indicator

RSI_Trend

iRSI

This indicator identifies directional market regimes by correlating RSI peak breaches with specific price-action floor and ceiling thresholds to distinguish between active trends and consolidated trading ranges.

Indicator

RSI_TrendRSI_Laguerre2SmzACS_MTF

RSI_TripleHull
Indicator

RSI_TripleHull

This indicator calculates a smoothed momentum value by applying three layers of Hull Moving Averages to price velocity and absolute volatility.