RoundPriceNE_big
Download script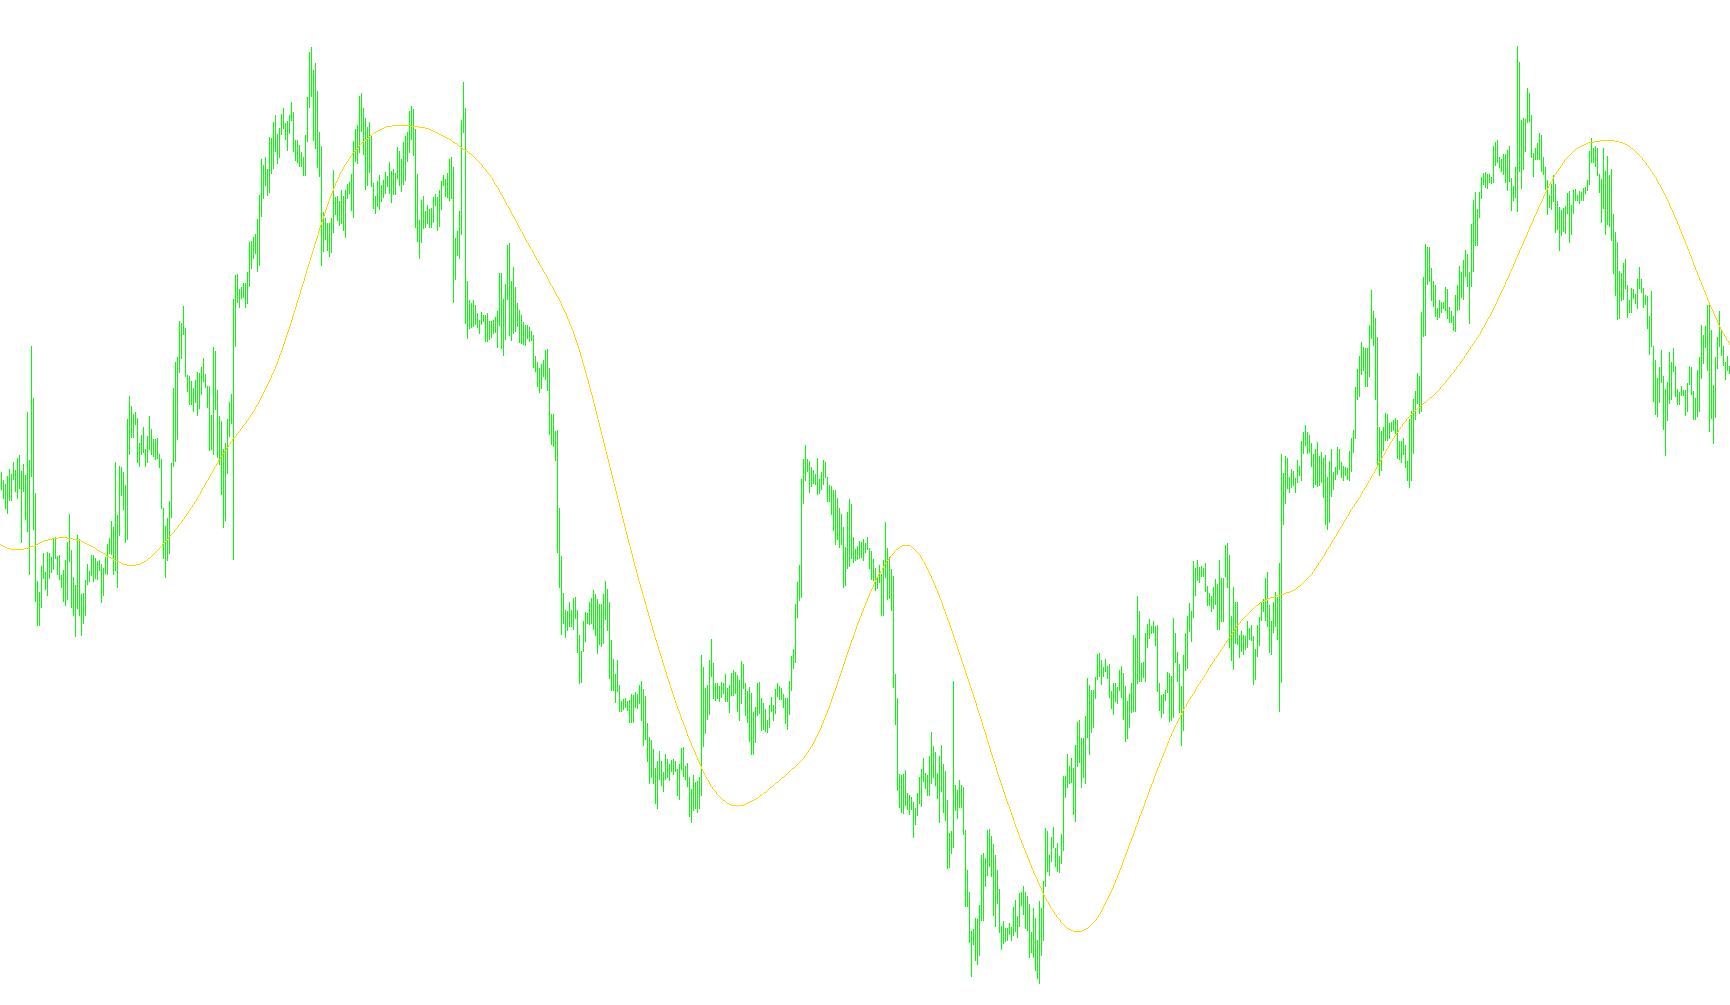
This technical tool is designed to provide a smoothed representation of price movement on your trading chart. Instead of showing the raw, jagged price fluctuations of the market, it processes data to reveal a more stable trend line, helping traders identify the underlying direction of the asset more clearly.
How the Logic Works
The script operates through a multi-stage calculation process that prioritizes "smoothing" over immediate reaction. Here is the step-by-step logic used to generate the line you see on your screen:
1. Data Input and Period Setting The tool begins by looking at the closing price of the assets over a specific timeframe (defined by the period setting). This establishes the "window" of historical data the script will consider when making its calculations.
2. The Smoothing Chain Rather than calculating a simple average, the logic uses a sophisticated "cascading" method. It takes the current price and runs it through six consecutive layers of processing. Think of this like a series of filters: each layer takes the result of the previous one and blends it with the new data. This heavy layering is what allows the resulting line to appear so fluid and less reactive to "noise" or minor, insignificant price spikes.
3. Mathematical Weighting The script utilizes a specific weighting system (based on a dedicated coefficient). This ensures that as the data moves through the filters, it maintains a mathematical balance between old information and new information. It calculates specific constants to ensure that the final output remains consistent with the overall trend of the market.
4. Final Output Generation Once the price has passed through all six layers of smoothing and the weighted calculations are applied, the final result is plotted on your chart as a gold line.
Summary for Traders
The primary goal of this logic is trend clarification. By filtering out the "static" of the market through multiple mathematical layers, it aims to provide a visual representation of where the price is actually heading, making it easier to distinguish between temporary volatility and sustained momentum.
//+------------------------------------------------------------------+
//|                                                        SmCCI.mq4 |
//|                      Copyright © 2006, MetaQuotes Software Corp. |
//|                                        http://www.metaquotes.net |
//+------------------------------------------------------------------+
#property copyright "Copyright © 2006, MetaQuotes Software Corp."
#property link      "http://www.metaquotes.net"

#property indicator_chart_window
#property indicator_buffers 1
#property indicator_color1 Gold

//---- input parameters


extern int t3_period=96;
extern double b=0.7;


//---- buffers
double ExtMapBuffer1[];

//+------------------------------------------------------------------+
//| Custom indicator initialization function                         |
//+------------------------------------------------------------------+
int init()
  {
//---- indicators
   SetIndexStyle(0,DRAW_LINE);
   SetIndexBuffer(0,ExtMapBuffer1);
//----
   return(0);
  }
//+------------------------------------------------------------------+
//| Custom indicator iteration function                              |
//+------------------------------------------------------------------+
int start()
  {
   double e1, e2, e3, e4, e5, e6, c1, c2, c3, c4, n, w1, w2, b2, b3;
   double dpo, t3;

   b2=b*b;
   b3=b2*b;
   c1=-b3;
   c2=(3*(b2+b3));
   c3=-3*(2*b2+b+b3);
   c4=(1+3*b+b3+3*b2);
   n=t3_period;

   if (n<1) n=1;
   n = 1 + 0.5*(n-1);
   w1 = 2 / (n + 1);
   w2 = 1 - w1;


   for(int i=Bars; i>=0; i--)

   {

      dpo=Close[i];

      e1 = w1*dpo + w2*e1;
      e2 = w1*e1 + w2*e2;
      e3 = w1*e2 + w2*e3;
      e4 = w1*e3 + w2*e4;
      e5 = w1*e4 + w2*e5;
      e6 = w1*e5 + w2*e6;

      t3 = c1*e6 + c2*e5 + c3*e4 + c4*e3;
      ExtMapBuffer1[i]=t3;
   }

   return(0);
  }
//+------------------------------------------------------------------+
Comments