RPoint-m_v2
Download script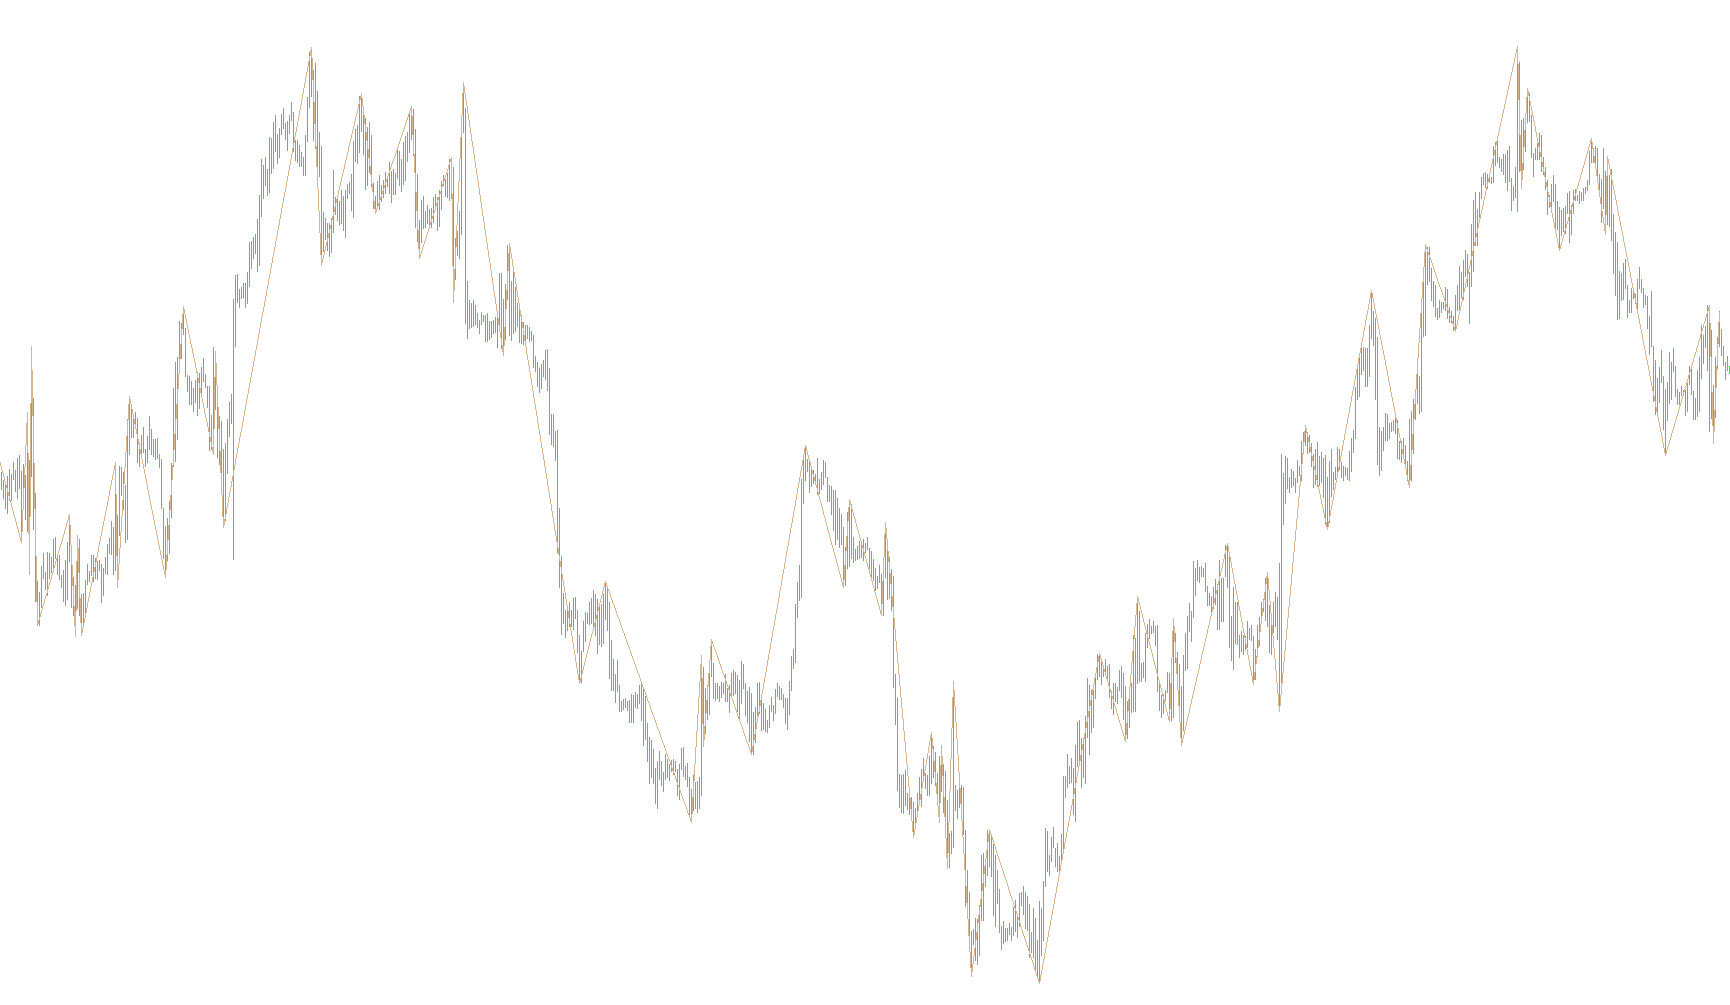
Overview of RPoint v2 Logic
The RPoint v2 script is a technical analysis tool designed to identify and visualize specific structural turning points in price action. Its primary goal is to track the "peaks" and "troughs" of a market trend by identifying significant highs and lows, while automatically filtering out minor price fluctuations that don't represent a true change in direction.
Key Functional Components
1. Trend Detection & Switching
The tool operates on a dual-state logic: it is either tracking an upward trend or a downward trend.
- In an Upward Trend: The script focuses on identifying the highest price reached. It remains in this state until the price drops significantly below that high point.
- In a Downward Trend: The script focuses on identifying the lowest price reached. It remains in this state until the price rises significantly above that low point.
2. The Reversal Threshold (Sensitivity)
A core feature of this script is the ReversPoint parameter. This acts as a buffer or "safety zone." Instead of triggering a trend change the moment the price moves slightly in the opposite direction, the script requires the price to move a specific distance (defined by the user) beyond the previous peak or trough before it officially acknowledges a reversal. This helps eliminate "market noise"—small, insignificant wiggles in the price that often mislead traders.
3. Dynamic Plotting
The indicator dynamically updates the chart to show the current significant price levels:
- When a new high is established during an uptrend, the script marks that point.
- If a reversal occurs and a new low is set, the script clears previous markings from the old trend to keep the chart clean and focused on the current price structure.
- The visual output provides a clear line or "section" showing these key structural levels.
4. Automated Alerts
To provide real-time awareness, the script includes an audible notification system. When the logic detects a confirmed reversal—meaning the price has broken the threshold and the trend has officially flipped—the script can trigger a sound alert. This allows traders to stay informed of major market shifts without needing to watch the screen constantly.
Summary for Traders
In simple terms, RPoint v2 acts as an automated "structure mapper." It looks at the price history, ignores minor volatility, and only highlights major peaks and valleys. By defining a specific distance required for a reversal, it helps traders identify when a trend has truly shifted, providing a clearer picture of the market's primary direction.
//+------------------------------------------------------------------+
//|                                                    RPoint v2.mq4 |
//|                          Copyright © 2004-2008, Poul_Trade_Forum |
//|                                                Aborigen & Kharko |
//|                                          http://forex.kbpauk.ru/ |
//+------------------------------------------------------------------+
#property copyright "Aborigen & Kharko"
#property indicator_chart_window
#property indicator_buffers 1
#property indicator_color1 Red
//---- input parameters
extern int ReversPoint=20;
extern bool Sound=true;
//---- buffers
double RBuffer[];
int Trend=1,InTrend,ttime;
double Points,Last_High, Last_Low=100000;
datetime LastTimeHigh=0,LastTimeLow=0;
//+------------------------------------------------------------------+
//| Custom indicator initialization function                         |
//+------------------------------------------------------------------+
int init()
  {
   string short_name;
   if(Digits==5 || Digits==3)
      ReversPoint*=10;
   Points=MarketInfo (Symbol(), MODE_POINT);
//---- indicator line
   SetIndexStyle(0,DRAW_SECTION,EMPTY,1,Tan);
   SetIndexBuffer(0,RBuffer);
   SetIndexEmptyValue(0,0);
//---- name for DataWindow and indicator subwindow label
   short_name="RPoint v2";
   IndicatorShortName(short_name);
   SetIndexLabel(0,short_name);
//----
   SetIndexDrawBegin(0,100);
//----
   return(0);
  }
//+------------------------------------------------------------------+
//| Custor indicator deinitialization function                       |
//+------------------------------------------------------------------+
int deinit()
  {
//---- TODO: add your code here
//----
   return(0);
  }
//+------------------------------------------------------------------+
//| Custom indicator iteration function                              |
//+------------------------------------------------------------------+
int start()
  {
   int    counted_bars=IndicatorCounted(),i,shift,index;
   static int count=0;
//---- TODO: add your code here
   if(counted_bars>0) counted_bars--;
   i=Bars-counted_bars;
//----
   for(shift=i; shift>=0;shift--)
   {
      if (Trend==1)
      {
         if (High[shift]>Last_High)
         {
            if(LastTimeHigh!=0)
            {
               index=iBarShift(NULL,0,LastTimeHigh);
               RBuffer[index]=0;
            }
            Last_High=High[shift];
            RBuffer[shift]=Last_High;
            LastTimeHigh=Time[shift];
         }
         if (Low[shift]<Last_High-ReversPoint*Points && LastTimeHigh<Time[shift])
         {
            Trend=0;
            LastTimeHigh=0;
            Last_High=0;
            LastTimeLow=Time[shift];
            RBuffer[shift]=Low[shift];
            if(Sound && shift==0 && Last_Low==0)
               PlaySound("alert2.wav");
            Last_Low=RBuffer[shift];
         }
      }
      if (Trend==0)
      {
         if (Low[shift]<Last_Low)
         {
            if(LastTimeLow!=0)
            {
               index=iBarShift(NULL,0,LastTimeLow);
               RBuffer[index]=0;
            }
            Last_Low=Low[shift];
            RBuffer[shift]=Last_Low;
            LastTimeLow=Time[shift];
         }
         if (High[shift]>Last_Low+ReversPoint*Points && LastTimeLow<Time[shift])
         {
            Trend=1;
            LastTimeLow=0;
            Last_Low=100000;
            LastTimeHigh=Time[shift];
            RBuffer[shift]=High[shift];
            if(Sound && shift==0 && Last_High==0)
               PlaySound("alert2.wav");
            Last_High=RBuffer[shift];
         }
      }
      //----
     }
   return(0);
  }
//+------------------------------------------------------------------+
Comments