RoundPrice-Ext
Download script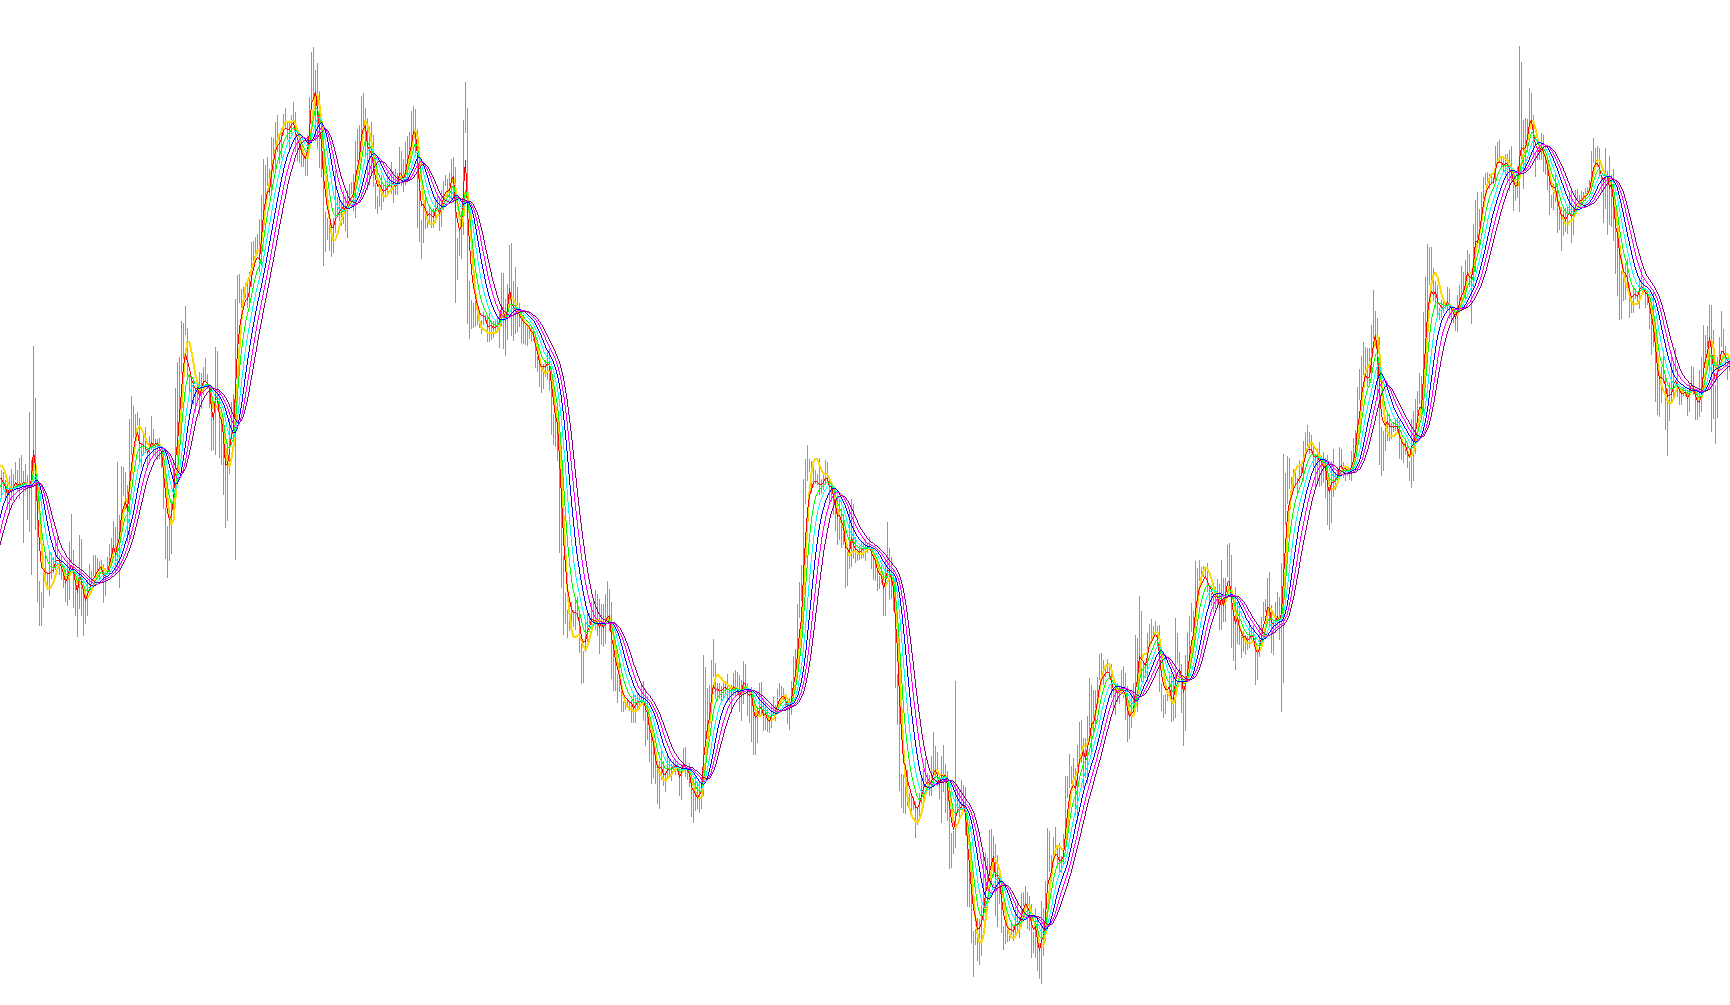
This script is a specialized technical analysis tool designed to identify smoothed price trends and significant price levels on a trading chart. Instead of simply tracking the raw, jagged movement of market prices, it uses a multi-layered mathematical approach to filter out "noise"—the small, rapid fluctuations that can often mislead traders.
Core Logic and Functionality
1. Multi-Stage Smoothing (The Filtering Process) The script operates by taking the current closing price and passing it through a series of successive filters. Imagine pouring water through six different types of sieves in a row; each sieve catches slightly different debris, resulting in a much cleaner flow at the bottom.
In this script, the price is processed six times consecutively. Each layer calculates a weighted average based on the previous results. By the time the data reaches the final stage, it represents a highly refined version of the price action, stripped of erratic spikes and minor volatility.
2. Weighted Calculations The tool utilizes specific mathematical weights (determined by the user-defined "period" and "smoothing factor"). These weights ensure that the indicator gives appropriate importance to recent price movements while still maintaining a connection to historical data. This balance allows the line on your chart to feel responsive enough to follow the market, but stable enough to be reliable for analysis.
3. Trend Identification The final output is a smooth, continuous line displayed on the main chart. Because this line represents a heavily processed "echo" of the price, it serves as an excellent tool for:
- Identifying Direction: Determining the underlying trend of an asset regardless of short-term fluctuations.
- Support and Resistance: Observing where the smoothed line levels out can help identify areas where the market is likely to pause or reverse.
- Visual Clarity: Providing a clear visual "path" for the price, making it easier for traders to see the broader market structure at a glance.
Key User Adjustments
The script provides two main inputs that allow you to customize how it behaves:
- Period: This controls the "length" of the calculation. A higher number will result in a smoother, slower line that ignores more market noise, while a lower number will make the line react faster to price changes.
- Smoothing Factor (b): This adjusts the intensity of the mathematical filtering, allowing you to fine-tune how aggressively the script "flattens" the price curves.
//+------------------------------------------------------------------+
//|                                               RoundPrice-Ext.mq4 |
//|                                                       MetaQuotes |
//|                 http://forum.alpari-idc.ru/viewtopic.php?t=48186 |
//+------------------------------------------------------------------+
#property copyright "MetaQuotes"
#property link      "http://forum.alpari-idc.ru/viewtopic.php?t=48186"

#property indicator_chart_window
#property indicator_buffers 7
#property indicator_color1 Gold

//---- input parameters
extern double    t3_period=8.0;
extern double    b=0.7;

//---- buffers
double ExtMapBuffer1[];

double e1Buffer[];
double e2Buffer[];
double e3Buffer[];
double e4Buffer[];
double e5Buffer[];
double e6Buffer[];

double c1,c2,c3,c4,n,w1,w2,b2,b3;
double dpo,t3;

//+------------------------------------------------------------------+
//| Custom indicator initialization function                         |
//+------------------------------------------------------------------+
int init()
  {
     string short_name;
//---- indicators
   IndicatorBuffers(7);

   SetIndexStyle(0,DRAW_LINE,STYLE_SOLID,2);
   SetIndexBuffer(0,ExtMapBuffer1);

/*   SetIndexStyle(1,DRAW_LINE,STYLE_DOT,1,Red);
   SetIndexStyle(2,DRAW_LINE,STYLE_DOT,1,Lime);
   SetIndexStyle(3,DRAW_LINE,STYLE_DOT,1,Aqua);
   SetIndexStyle(4,DRAW_LINE,STYLE_DOT,1,Blue);
   SetIndexStyle(5,DRAW_LINE,STYLE_DOT,1,Magenta);
   SetIndexStyle(6,DRAW_LINE,STYLE_DOT,1,Purple);
*/
   SetIndexStyle(1,DRAW_LINE,STYLE_SOLID,1,Red);
   SetIndexStyle(2,DRAW_LINE,STYLE_SOLID,1,Lime);
   SetIndexStyle(3,DRAW_LINE,STYLE_SOLID,1,Aqua);
   SetIndexStyle(4,DRAW_LINE,STYLE_SOLID,1,Blue);
   SetIndexStyle(5,DRAW_LINE,STYLE_SOLID,1,Magenta);
   SetIndexStyle(6,DRAW_LINE,STYLE_SOLID,1,Purple);


   SetIndexBuffer(1,e1Buffer);
   SetIndexBuffer(2,e2Buffer);
   SetIndexBuffer(3,e3Buffer);
   SetIndexBuffer(4,e4Buffer);
   SetIndexBuffer(5,e5Buffer);
   SetIndexBuffer(6,e6Buffer);

   SetIndexEmptyValue(0,0.0);
   SetIndexEmptyValue(1,0.0);
   SetIndexEmptyValue(2,0.0);
   SetIndexEmptyValue(3,0.0);
   SetIndexEmptyValue(4,0.0);
   SetIndexEmptyValue(5,0.0);
   SetIndexEmptyValue(6,0.0);
//   SetIndexEmptyValue(7,0.0);

   //---- name for DataWindow and indicator subwindow label
   short_name="RoundPrice-Ext("+t3_period+")";
   IndicatorShortName(short_name);
   SetIndexLabel(0,short_name);

   //----
   b2=b*b;
   b3=b2*b;
   c1=-b3;
   c2=(3*(b2+b3));
   c3=-3*(2*b2+b+b3);
   c4=(1+3*b+b3+3*b2);
   n=t3_period;

   if(n<1) n=1;
   n = 1 + 0.5*(n-1);
   w1 = 2 / (n + 1);
   w2 = 1 - w1;

//----
   return(0);
  }
//+------------------------------------------------------------------+
//| Custom indicator deinitialization function                       |
//+------------------------------------------------------------------+
int deinit()
  {
//----

//----
   return(0);
  }
//+------------------------------------------------------------------+
//| Custom indicator iteration function                              |
//+------------------------------------------------------------------+
int start()
  {
   int    counted_bars=IndicatorCounted();
   int shift,limit;
   if (counted_bars==0) limit=Bars;
   if (counted_bars>=0) limit=Bars-counted_bars;
   limit--;

   for (shift=limit;shift>=0;shift--)
      {//Begin

      dpo=Close[shift];
      e1Buffer[shift] = w1*dpo + w2*e1Buffer[shift+1];
      e2Buffer[shift] = w1*e1Buffer[shift] + w2*e2Buffer[shift+1];
      e3Buffer[shift] = w1*e2Buffer[shift] + w2*e3Buffer[shift+1];
      e4Buffer[shift] = w1*e3Buffer[shift] + w2*e4Buffer[shift+1];
      e5Buffer[shift] = w1*e4Buffer[shift] + w2*e5Buffer[shift+1];
      e6Buffer[shift] = w1*e5Buffer[shift] + w2*e6Buffer[shift+1];

      t3 = c1*e6Buffer[shift] + c2*e5Buffer[shift] + c3*e4Buffer[shift] + c4*e3Buffer[shift];

      if (t3==0) t3=0.0001;

      ExtMapBuffer1[shift]=t3;
   }
   return(0);
  }
//+------------------------------------------------------------------+
Comments