ROC2_VG
Download script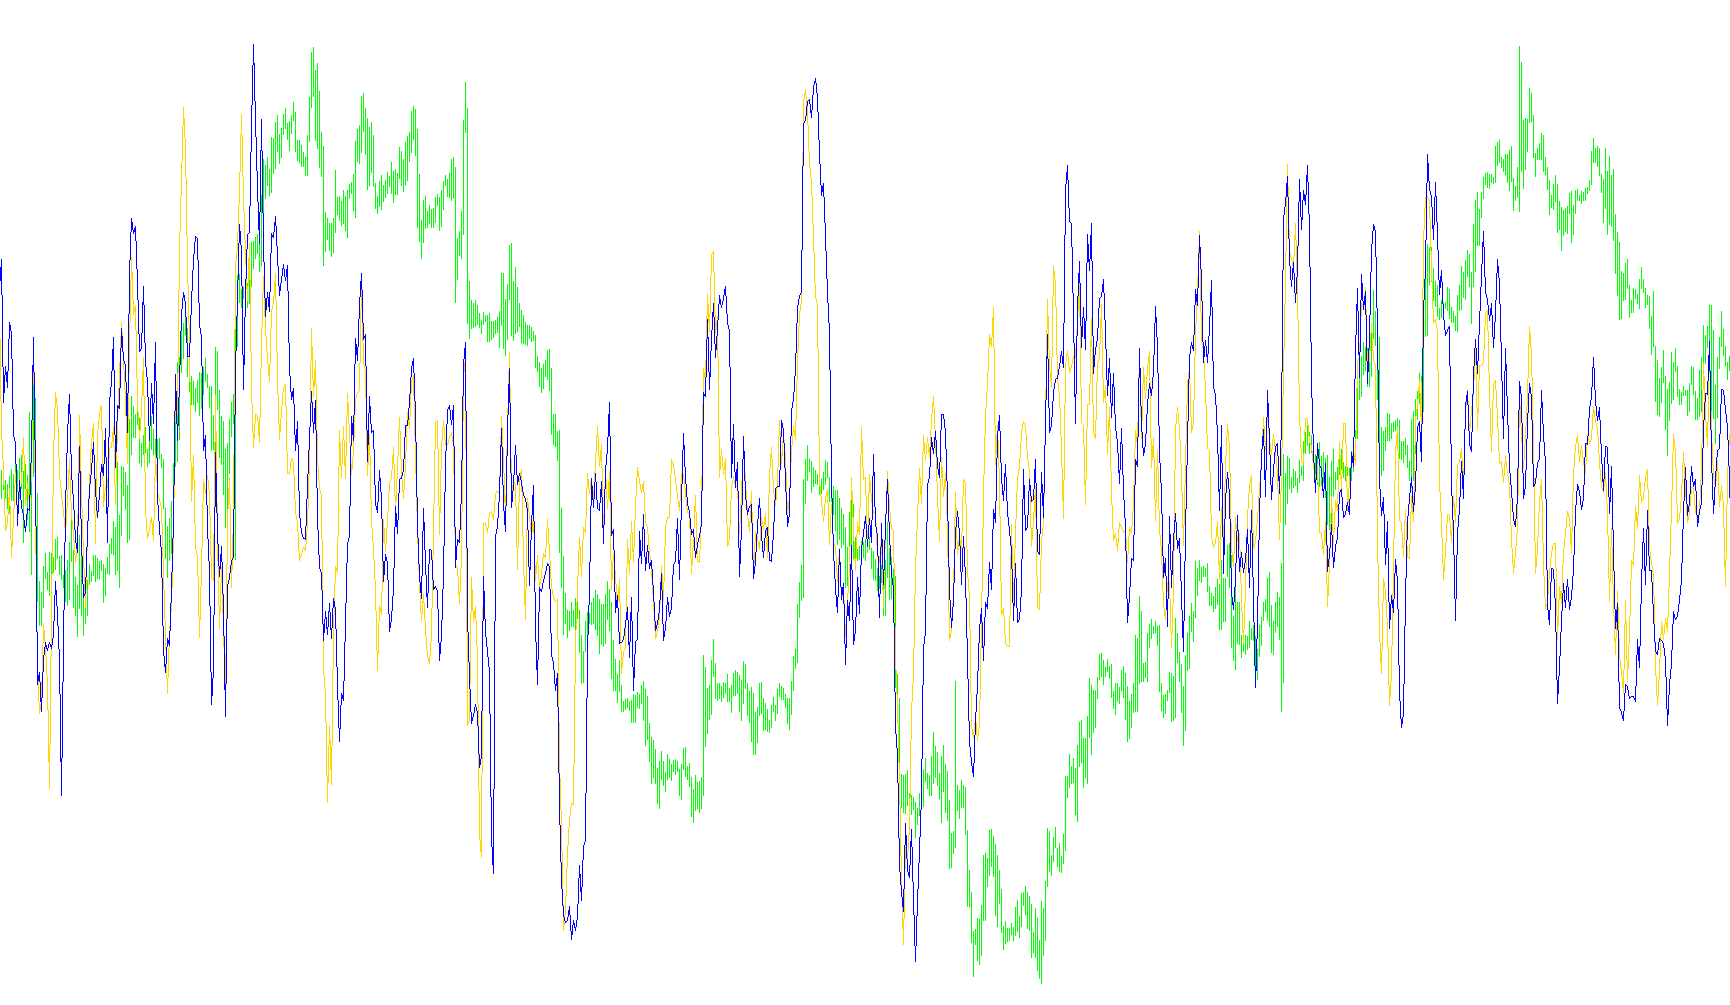
This technical indicator is designed to analyze and visualize price momentum by tracking the speed and direction of price movements over two different time horizons simultaneously. By plotting these two distinct sets of data on your chart, it allows for a clearer understanding of how rapidly an asset's value is changing relative to its past performance.
Core Functionality
The script operates by calculating "Rate-of-Change" (ROC) metrics. It examines the current price of an asset and compares it to the price at a specific interval in the past. By doing this for two different intervals at once, the indicator helps traders identify whether a price trend is accelerating, decelerating, or losing steam.
Key Components
The logic is broken down into several customizable components:
- Dual Time Periods: The tool uses two independent timeframes (defined by the user). For example, one calculation might look at short-term fluctuations (e.g., 8 bars), while the other looks at longer-term trends (e.g., 14 bars).
- Versatile Calculation Modes: The script is highly flexible in how it measures change. Depending on your settings, it can calculate movement in several ways:
- Momentum: Simple difference between current and past prices.
- Percentage Change: Shows the rate of change as a percentage (e.g., a 2% increase).
- Relative Change: Provides a decimal representation of price growth.
- Ratio: Shows the direct ratio between the current price and the historical price.
- Visual Feedback: The results are displayed in a separate window beneath your main price chart. It uses two distinct lines (colored Red and Blue) to represent the different timeframes, allowing you to see if short-term momentum is aligning with or diverging from the long-term trend.
How it Works for the User
When you apply this script, it continuously scans historical data to populate the indicator lines. It automatically handles the math required to determine the difference between prices across your chosen periods.
By observing where these two lines sit in relation to each other and the "zero" level (the baseline), traders can gain insights into market volatility and strength. If both lines are moving in the same direction, it suggests a strong trend; if they begin to move in opposite directions or flatten out, it may indicate a potential shift in market sentiment.
/*-----------------------------+
|			       |
| Shared by www.Aptrafx.com    |
|			       |
+------------------------------*/

//+------------------------------------------------------------------+
//|                                                      ROC2_VG.mq4 |
//|                        Copyright © 2006, Vladislav Goshkov (VG). |
//|                                                      4vg@mail.ru |
//+------------------------------------------------------------------+
#property copyright "Vladislav Goshkov"
#property link      "4vg@mail.ru"

#property indicator_separate_window
#property indicator_buffers 2
#property indicator_color1  Red
#property indicator_color2  Blue
#property indicator_level1  0.005
#property indicator_level2  0.002
#property indicator_level3  0.00
#property indicator_level4  -0.002
#property indicator_level5  -0.005

//---- input parameters
extern int ROCPeriod1  = 8;
extern int ROCPeriod2  = 14;
extern int ROCType1    = 0;
extern int ROCType2    = 0;
//---- buffers
double Buffer1[];
double Buffer2[];
//+------------------------------------------------------------------+
//| Custom indicator initialization function                         |
//+------------------------------------------------------------------+
int init()  {
   string short_name;
//---- indicator line
   SetIndexStyle(0,DRAW_LINE);
   SetIndexBuffer(0,Buffer1);
   SetIndexStyle(1,DRAW_LINE);
   SetIndexBuffer(1,Buffer2);
//---- name for DataWindow and indicator subwindow label
   string Type1="",Type2="";
   switch(ROCType1){
     case 1 : Type1="MOM";     break;
     case 2 : Type1="ROC";     break;
     case 3 : Type1="ROCP";    break;
     case 4 : Type1="ROCR";    break;
     case 5 : Type1="ROCR100"; break;
     default: Type1="ROCP";    break;
     }

   switch(ROCType2){
     case 1 : Type2="MOM";     break;
     case 2 : Type2="ROC";     break;
     case 3 : Type2="ROCP";    break;
     case 4 : Type2="ROCR";    break;
     case 5 : Type2="ROCR100"; break;
     default: Type2="ROCP";    break;
     }
   short_name="ROC2_VG( "+Type1+" = "+ROCPeriod1+" and "+Type2+" = "+ROCPeriod2+")";
   IndicatorShortName(short_name);
   SetIndexLabel(0,short_name);
//----
   SetIndexDrawBegin(0,MathMax(ROCPeriod1,ROCPeriod2));
//----
   return(0);
  }
//+------------------------------------------------------------------+
//| Rate-Of-Change (ROC)                                             |
//+------------------------------------------------------------------+
int start(){
int i,counted_bars=IndicatorCounted();
double price=0.0, prevPrice = 0.0;
//----
   if(Bars<=MathMax(ROCPeriod1,ROCPeriod2)) return(0);
//---- initial zero
   if(counted_bars<1){
      for(i=1;i<=ROCPeriod1;i++) Buffer1[Bars-i]=0.0;
      for(i=1;i<=ROCPeriod2;i++) Buffer2[Bars-i]=0.0;
      }
//----
   i=Bars-ROCPeriod1-1;
   if(counted_bars>=ROCPeriod1) i=Bars-counted_bars-1;
   while(i>=0){
      price     = Close[i];
      prevPrice = Close[i+ROCPeriod1];
      switch(ROCType1){
         case 1 : Buffer1[i]= (price - prevPrice);         break; //"MOM"
         case 2 : Buffer1[i]= ((price/prevPrice)-1)*100;   break; //"ROC"
         case 3 : Buffer1[i]= (price-prevPrice)/prevPrice; break; //"ROCP"
         case 4 : Buffer1[i]= (price/prevPrice);           break; //"ROCR"
         case 5 : Buffer1[i]= (price/prevPrice)*100;       break; //"ROCR100"
         default: Buffer1[i]= (price-prevPrice)/prevPrice; break;
         }
      i--;
     }
//----
   i=Bars-ROCPeriod2-1;
   if(counted_bars>=ROCPeriod2) i=Bars-counted_bars-1;
   while(i>=0){
      price     = Close[i];
      prevPrice = Close[i+ROCPeriod2];
      switch(ROCType2){
         case 1 : Buffer2[i]= (price - prevPrice);         break; //"MOM"
         case 2 : Buffer2[i]= ((price/prevPrice)-1)*100;   break; //"ROC"
         case 3 : Buffer2[i]= (price-prevPrice)/prevPrice; break; //"ROCP"
         case 4 : Buffer2[i]= (price/prevPrice);           break; //"ROCR"
         case 5 : Buffer2[i]= (price/prevPrice)*100;       break; //"ROCR100"
         default: Buffer2[i]= (price-prevPrice)/prevPrice; break;
         }
      i--;
     }
   return(0);
  }
//+------------------------------------------------------------------+
Comments