RSI-3TF
Download script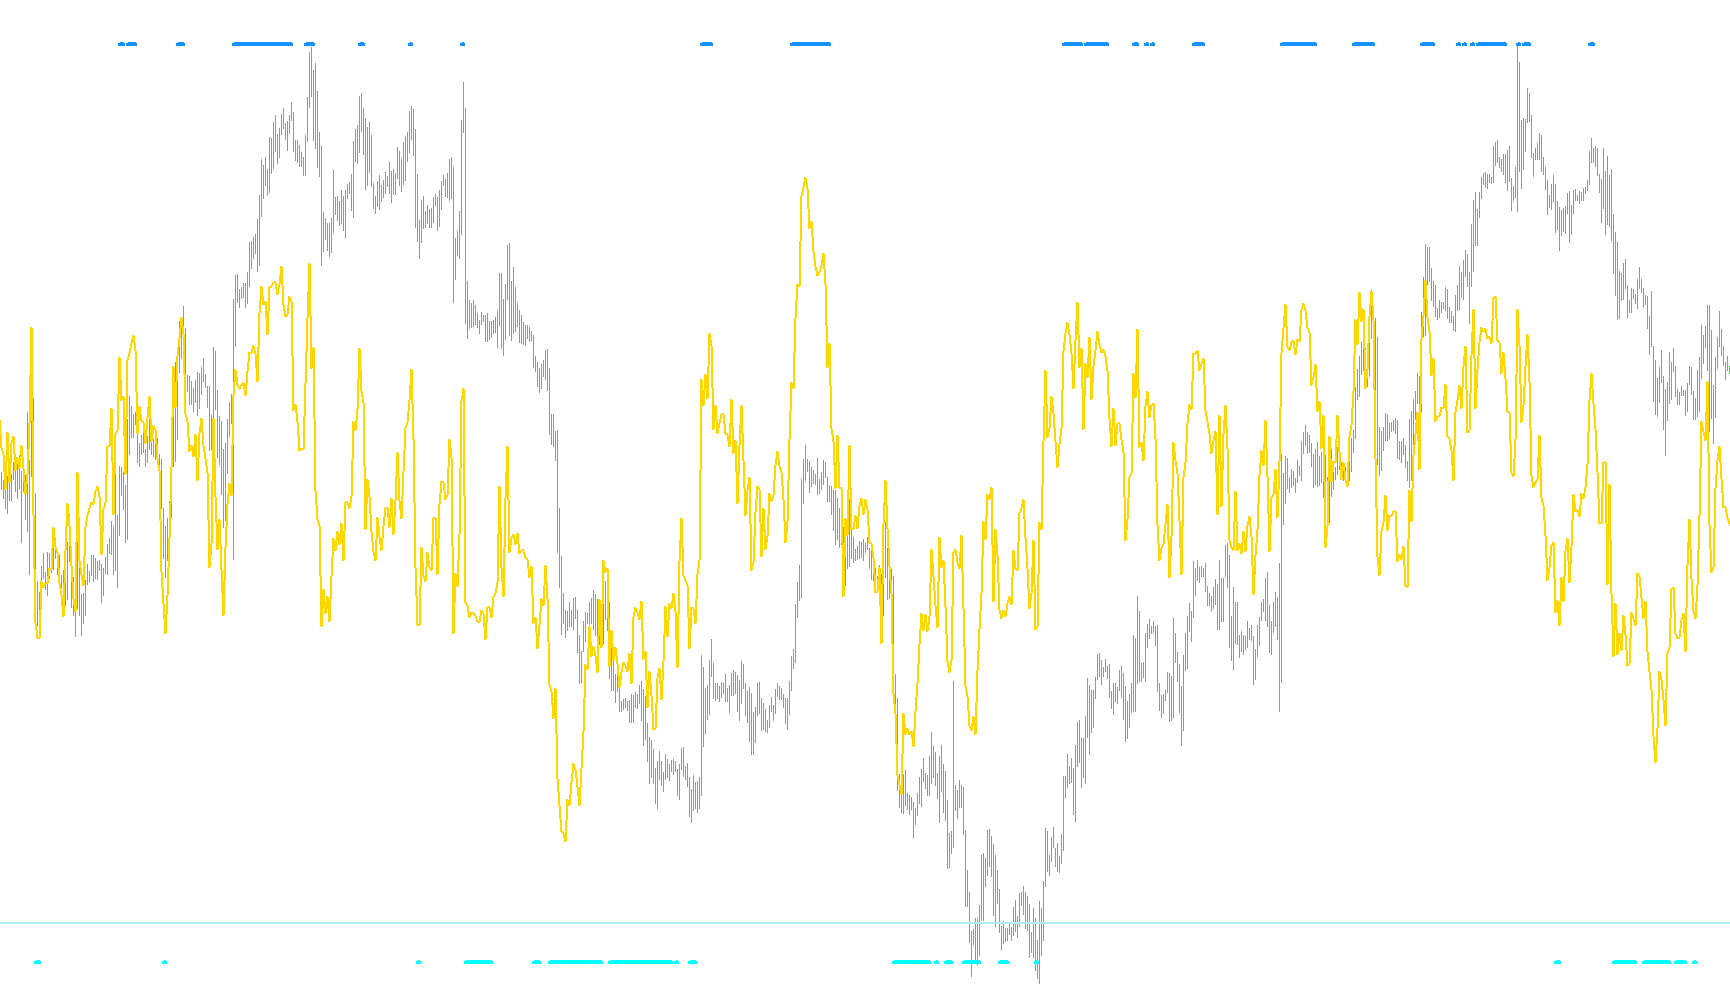
This technical indicator is designed to help traders analyze market momentum by combining multiple layers of Relative Strength Index (RSI) data across different timeframes. Instead of looking at a single price movement, this tool synchronizes "short-term" and "long-term" perspectives to provide a more comprehensive view of market health.
Core Functionality
The script performs three primary actions simultaneously:
1. Dual Timeframe Analysis The indicator does not rely solely on the chart you are currently viewing. It automatically calculates RSI values for two different timeframes (for example, it can track a 30-minute timeframe and a 60-minute timeframe at once). This allows you to see if a move is happening quickly in the moment or if it has deeper momentum over a longer period.
2. Multi-Layered Momentum Tracking It calculates two distinct types of RSI data:
- Primary RSI: A standard calculation based on your current chart's movement.
- Secondary Timeframe RSIs: Values pulled from higher timeframes to identify broader trends.
3. Dynamic Threshold Monitoring The script establishes specific "Upper" and "Lower" boundaries for both timeframes. Rather than just showing a line, it monitors when the market momentum exceeds these defined levels (overbought or oversold conditions). When these thresholds are breached on the secondary timeframes, the indicator highlights those specific points visually.
How It Works for the User
When you apply this to your trading platform, the logic flows as follows:
- Data Smoothing: The script uses a "smoothed moving average" approach. This means it filters out minor price "noise" to ensure that the resulting lines represent actual trend shifts rather than erratic price jumps.
- Visual Feedback: It populates several lines and markers on your screen. By looking at these, you can quickly identify if the market is becoming overextended in the short term while still maintaining a steady trend in the long term.
- Decision Support: By aligning multiple timeframes into one visual window, the logic aims to help traders avoid "fakeouts"—situations where a price looks like it's moving in one direction on a small chart, but the larger timeframe data suggests otherwise.
In summary, this script acts as a multi-lens surveillance tool, scanning different layers of time and momentum to give you a clearer picture of where the market is headed.
//+------------------------------------------------------------------+
//|                                                      RSI-3TF.mq4 |
//|                      Copyright © 2004, MetaQuotes Software Corp. |
//|                                       http://www.metaquotes.net/ |
//|                                                                  |
//|                   04.10.2005 Ìîäåðíèçàöèÿ Êèì Èãîðü Â. aka KimIV |
//|                                              http://www.kimiv.ru |
//+------------------------------------------------------------------+
#property copyright "Copyright © 2004, MetaQuotes Software Corp."
#property link      "http://www.metaquotes.net/"

#property indicator_separate_window
#property indicator_minimum 0
#property indicator_maximum 100
#property indicator_buffers 5
#property indicator_color1 Yellow
#property indicator_color2 Red
#property indicator_color3 DodgerBlue
#property indicator_color4 Magenta
#property indicator_color5 Green

//------- Âíåøíèå ïàðàìåòðû èíäèêàòîðà -------------------------------
extern int RSI_Period_0 = 14;
extern int RSI_Period_1 = 14;
extern int TF_1         = 30;
extern int UP_Level_1   = 60;
extern int DN_Level_1   = 40;
extern int TF_2         = 60;
extern int RSI_Period_2 = 14;
extern int UP_Level_2   = 60;
extern int DN_Level_2   = 40;

//------- Áóôåðû èíäèêàòîðà ------------------------------------------
double RSIBuffer[];
double UP_Lev_1[];
double DN_Lev_1[];
double UP_Lev_2[];
double DN_Lev_2[];
double PosBuffer[];
double NegBuffer[];

//+------------------------------------------------------------------+
//| Custom indicator initialization function                         |
//+------------------------------------------------------------------+
void init() {
  string short_name;
  //---- 2 additional buffers are used for counting.
  IndicatorBuffers(7);
  SetIndexBuffer(5,PosBuffer);
  SetIndexBuffer(6,NegBuffer);
  //---- indicator line
  SetIndexStyle(0,DRAW_LINE,STYLE_SOLID,2);
  SetIndexBuffer(0,RSIBuffer);
  SetIndexStyle(1,DRAW_LINE,STYLE_SOLID,2);
  SetIndexBuffer(1,UP_Lev_1);
  SetIndexStyle(2,DRAW_LINE,STYLE_SOLID,2);
  SetIndexBuffer(2,DN_Lev_1);
  SetIndexStyle(3,DRAW_LINE,STYLE_SOLID,4);
  SetIndexBuffer(3,UP_Lev_2);
  SetIndexStyle(4,DRAW_LINE,STYLE_SOLID,4);
  SetIndexBuffer(4,DN_Lev_2);
  //---- name for DataWindow and indicator subwindow label
  short_name="RSI("+RSI_Period_0+")";
  IndicatorShortName(short_name);
  SetIndexLabel(0,short_name);
  short_name="RSI("+RSI_Period_1+")";
  SetIndexLabel(1,short_name);
  SetIndexLabel(2,short_name);
  short_name="RSI("+RSI_Period_2+")";
  SetIndexLabel(3,short_name);
  SetIndexLabel(4,short_name);

  SetIndexDrawBegin(0,RSI_Period_0);
  SetIndexDrawBegin(1,RSI_Period_1);
  SetIndexDrawBegin(2,RSI_Period_1);
  SetIndexDrawBegin(3,RSI_Period_2);
  SetIndexDrawBegin(4,RSI_Period_2);
}

//+------------------------------------------------------------------+
//| Relative Strength Index                                          |
//+------------------------------------------------------------------+
void start() {
  double rel, negative, positive;
  double rsi1, rsi2;
  int    i, counted_bars=IndicatorCounted();
  int    nb1, nb2;

  if(Bars<=RSI_Period_0) return(0);
  //---- initial zero
  if(counted_bars<1)
      for(i=1;i<=RSI_Period_0;i++) RSIBuffer[Bars-i]=0.0;
  //----
  i=Bars-RSI_Period_0-1;
  if (counted_bars>=RSI_Period_0) i=Bars-counted_bars-1;
  while (i>=0) {
    double sumn=0.0,sump=0.0;
    if (i==Bars-RSI_Period_0-1) {
      int k=Bars-2;
      //---- initial accumulation
      while (k>=i) {
        rel=Close[k]-Close[k+1];
        if (rel>0) sump+=rel;
        else       sumn-=rel;
        k--;
      }
      positive=sump/RSI_Period_0;
      negative=sumn/RSI_Period_0;
    } else {
      //---- smoothed moving average
      rel=Close[i]-Close[i+1];
      if (rel>0) sump=rel;
      else       sumn=-rel;
      positive=(PosBuffer[i+1]*(RSI_Period_0-1)+sump)/RSI_Period_0;
      negative=(NegBuffer[i+1]*(RSI_Period_0-1)+sumn)/RSI_Period_0;
    }
    PosBuffer[i]=positive;
    NegBuffer[i]=negative;
    if (negative==0.0) RSIBuffer[i]=0.0;
    else RSIBuffer[i]=100.0-100.0/(1+positive/negative);

    nb1=iBarShift(NULL, TF_1, Time[i], False);
    nb2=iBarShift(NULL, TF_2, Time[i], False);

    rsi1=iRSI(NULL, TF_1, RSI_Period_1, PRICE_CLOSE, nb1);
    rsi2=iRSI(NULL, TF_2, RSI_Period_2, PRICE_CLOSE, nb2);

    UP_Lev_1[i]=EMPTY_VALUE;
    DN_Lev_1[i]=EMPTY_VALUE;
    UP_Lev_2[i]=EMPTY_VALUE;
    DN_Lev_2[i]=EMPTY_VALUE;

    if (rsi1>=UP_Level_1) UP_Lev_1[i]=94;
    if (rsi1<=DN_Level_1) DN_Lev_1[i]=6;
    if (rsi2>=UP_Level_2) UP_Lev_2[i]=98;
    if (rsi2<=DN_Level_2) DN_Lev_2[i]=2;

    i--;
  }
}
//+------------------------------------------------------------------+
Comments