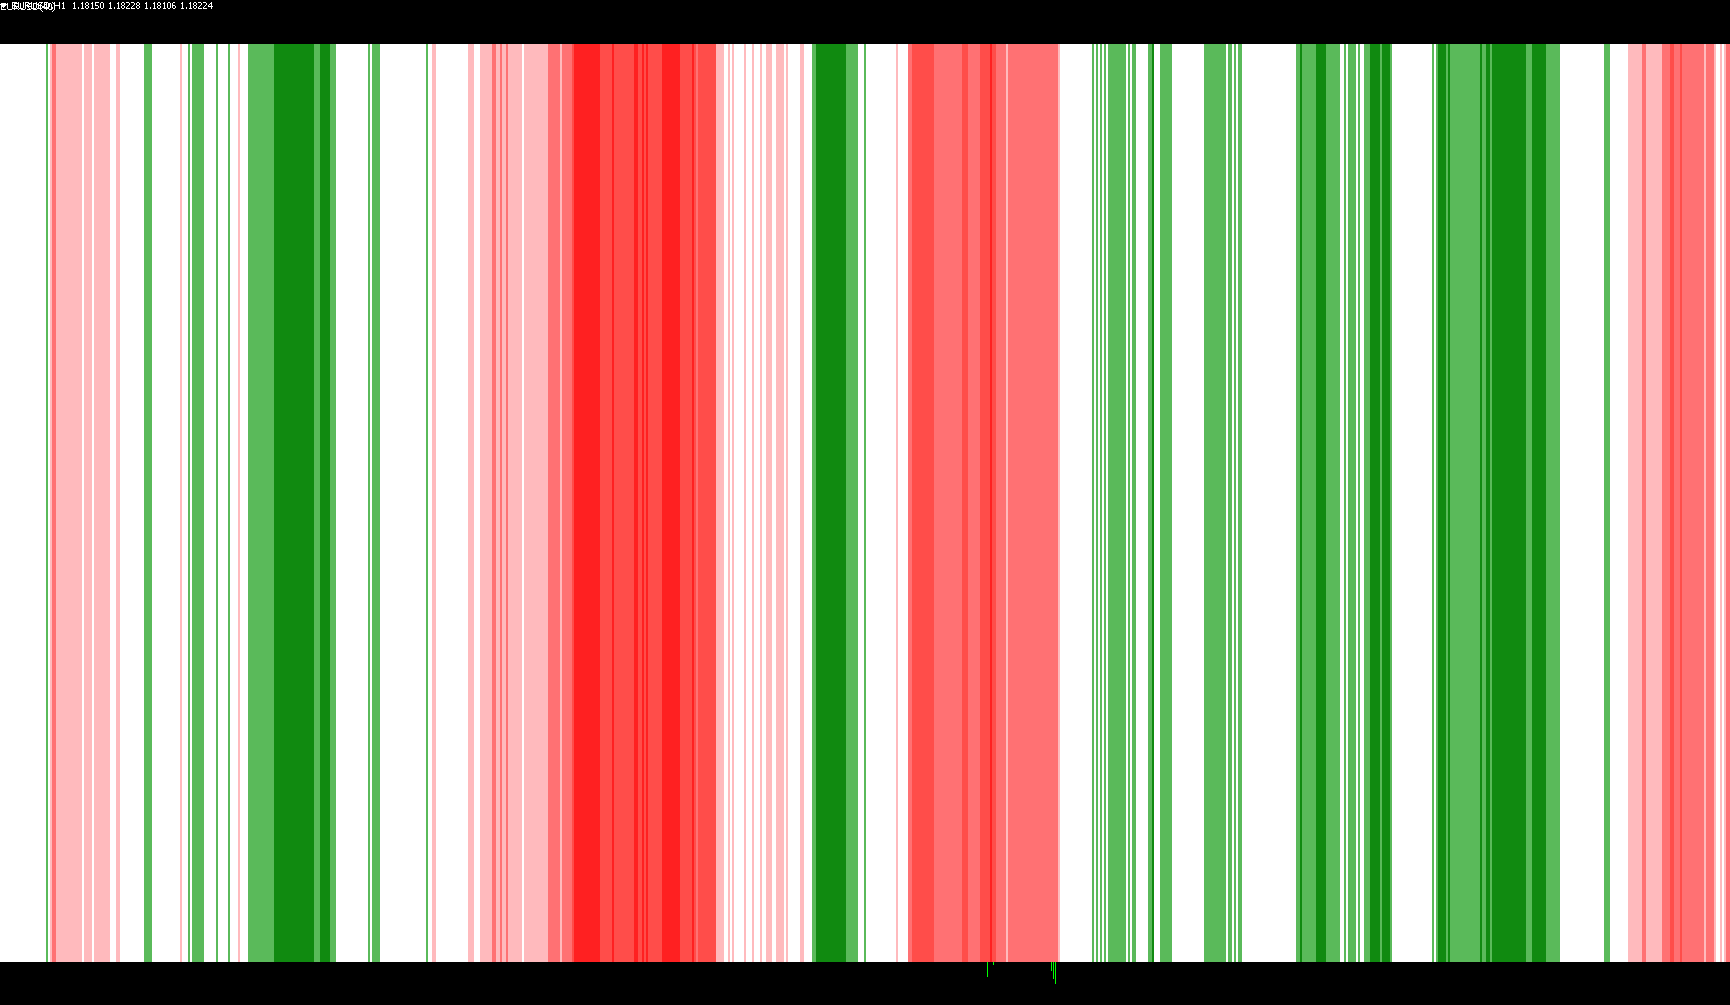
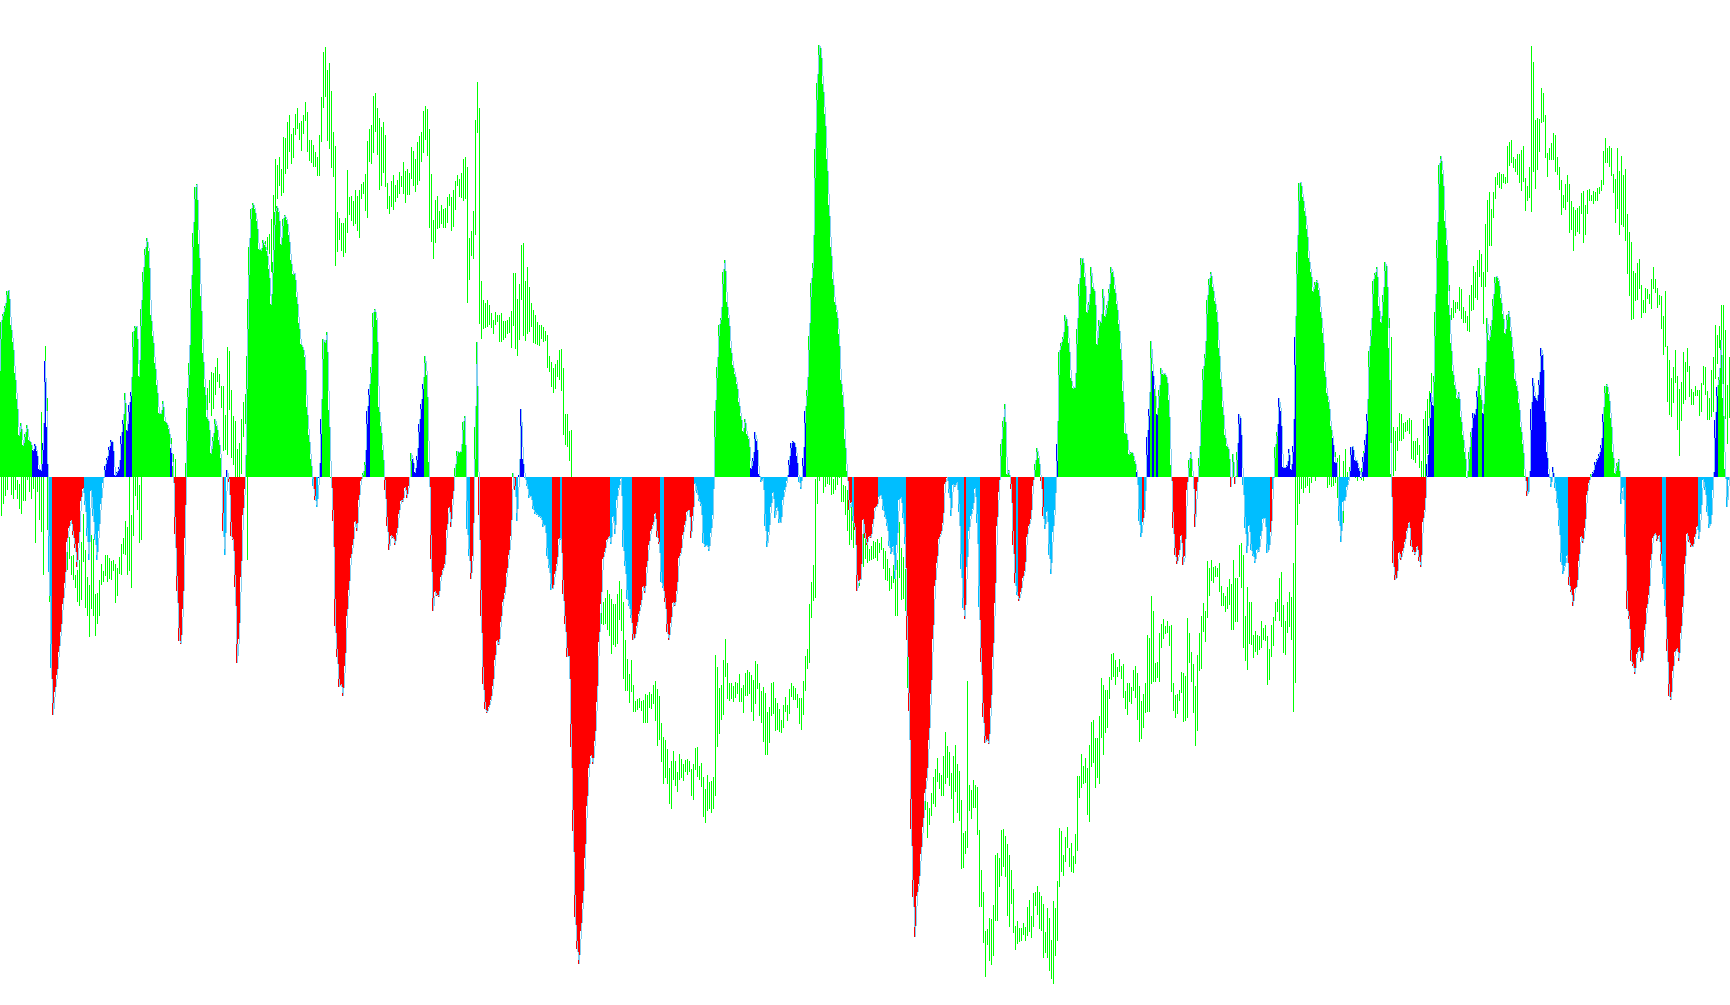
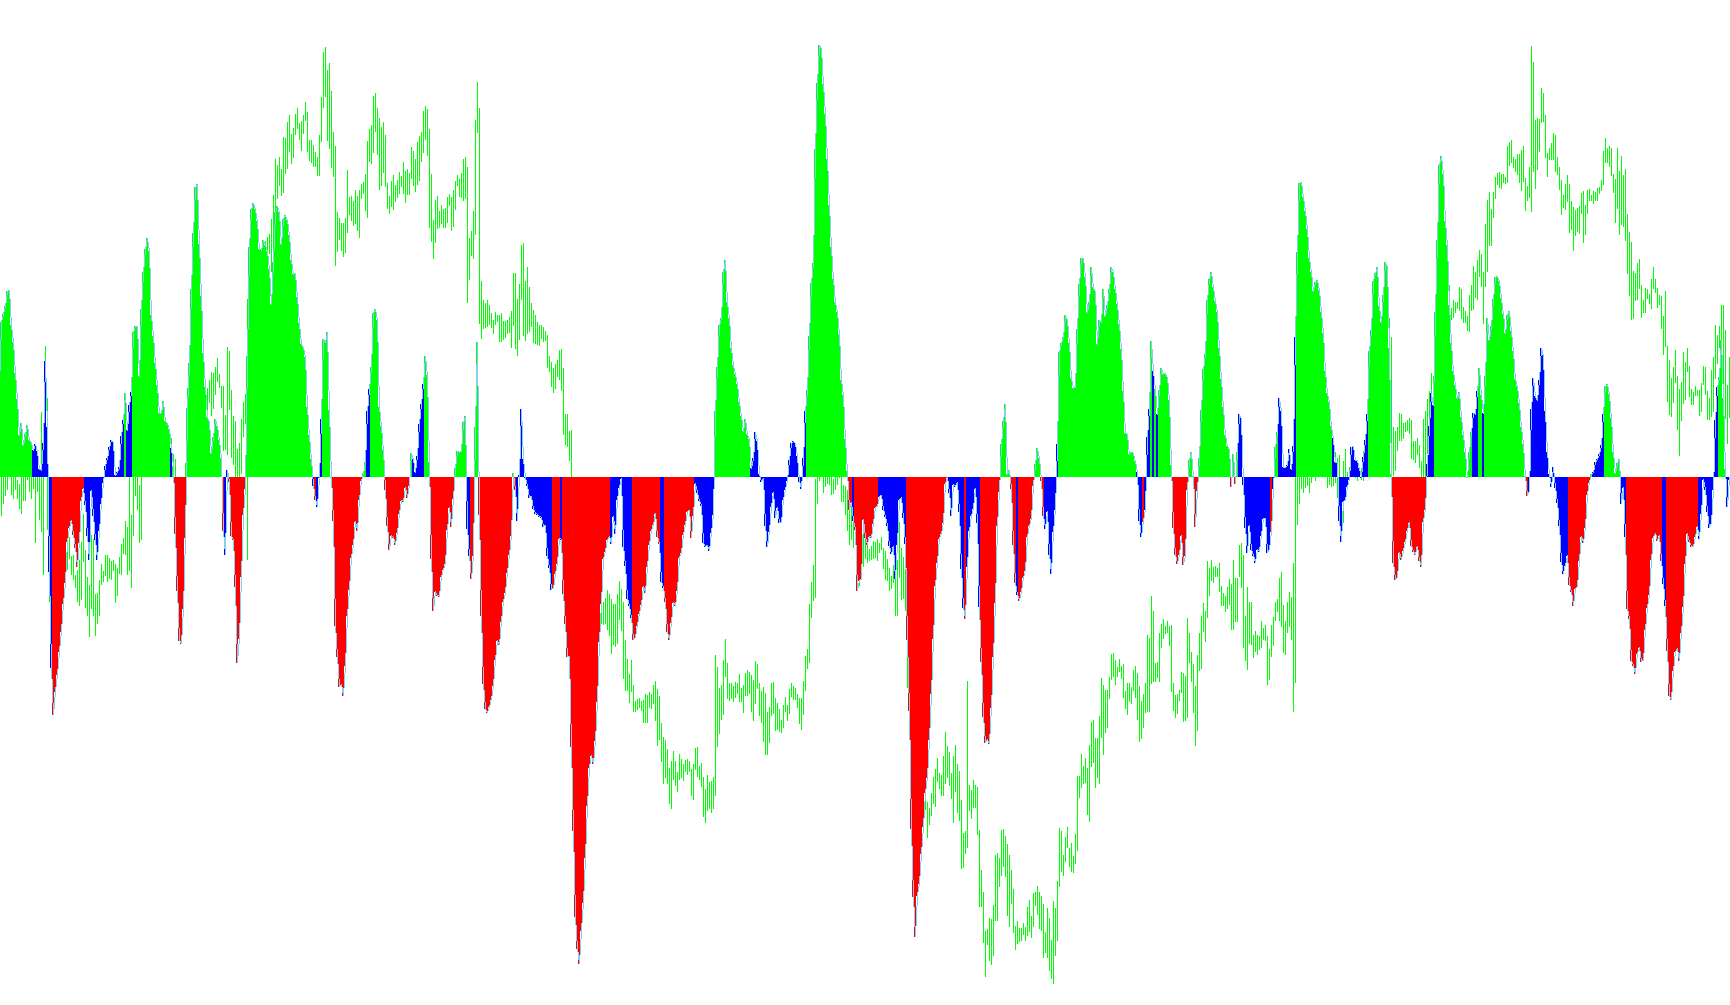
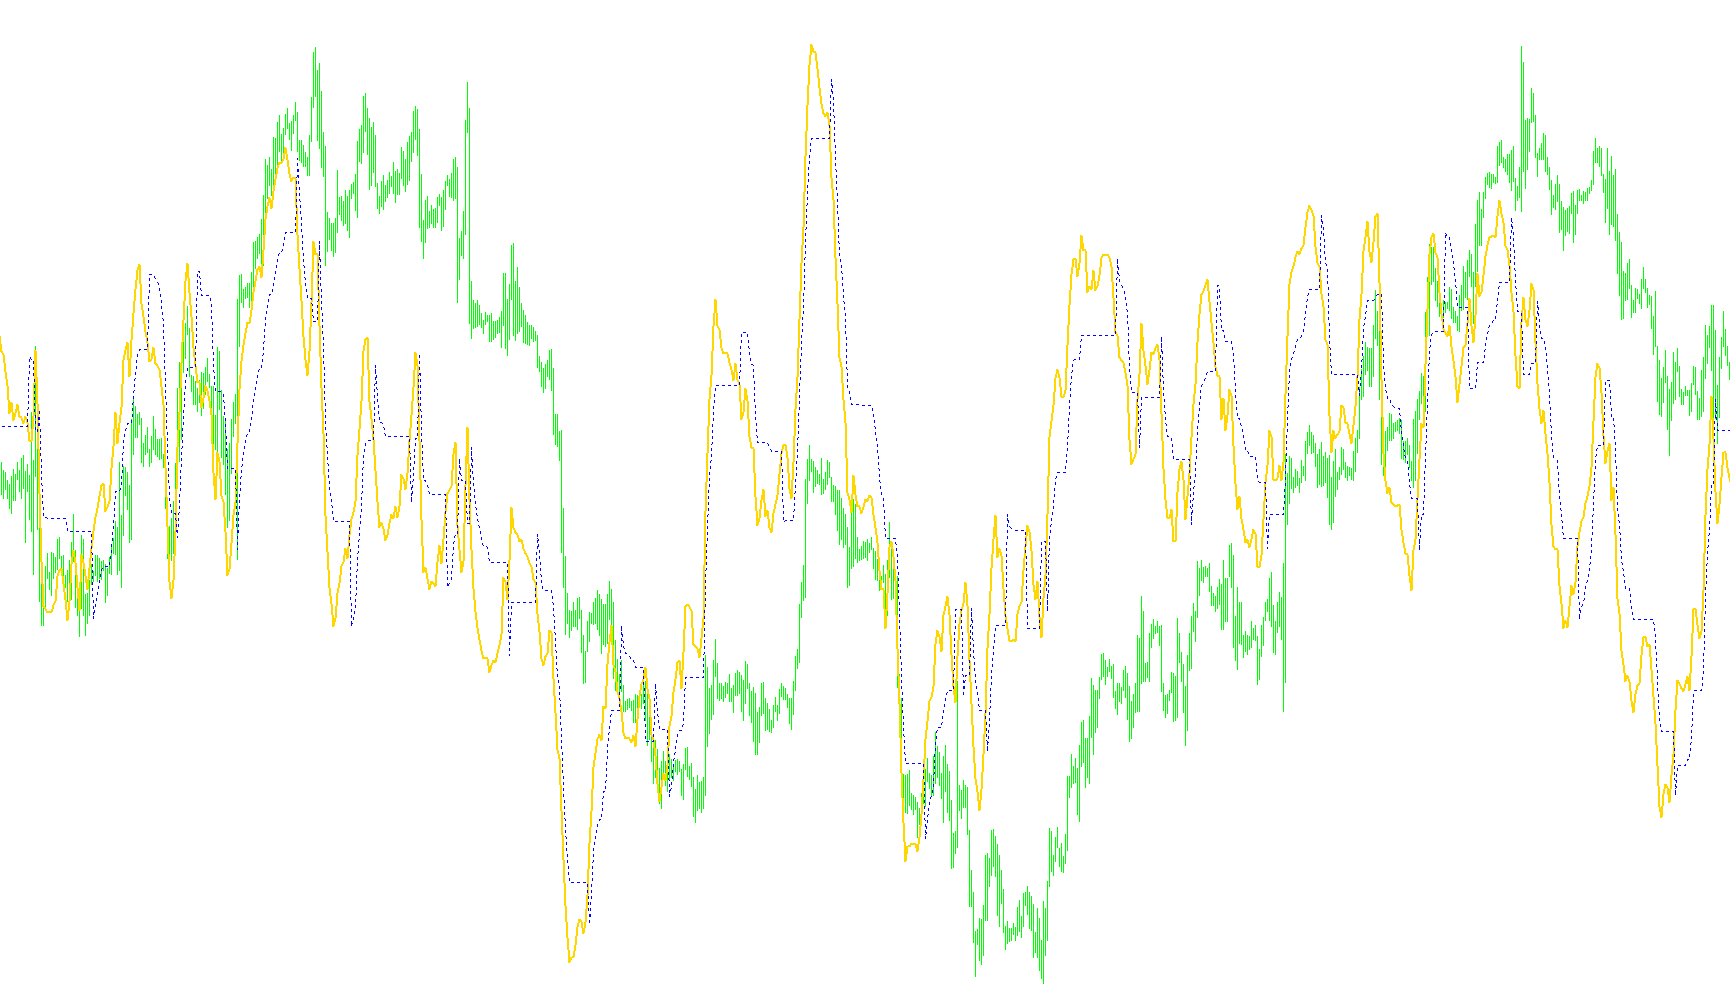
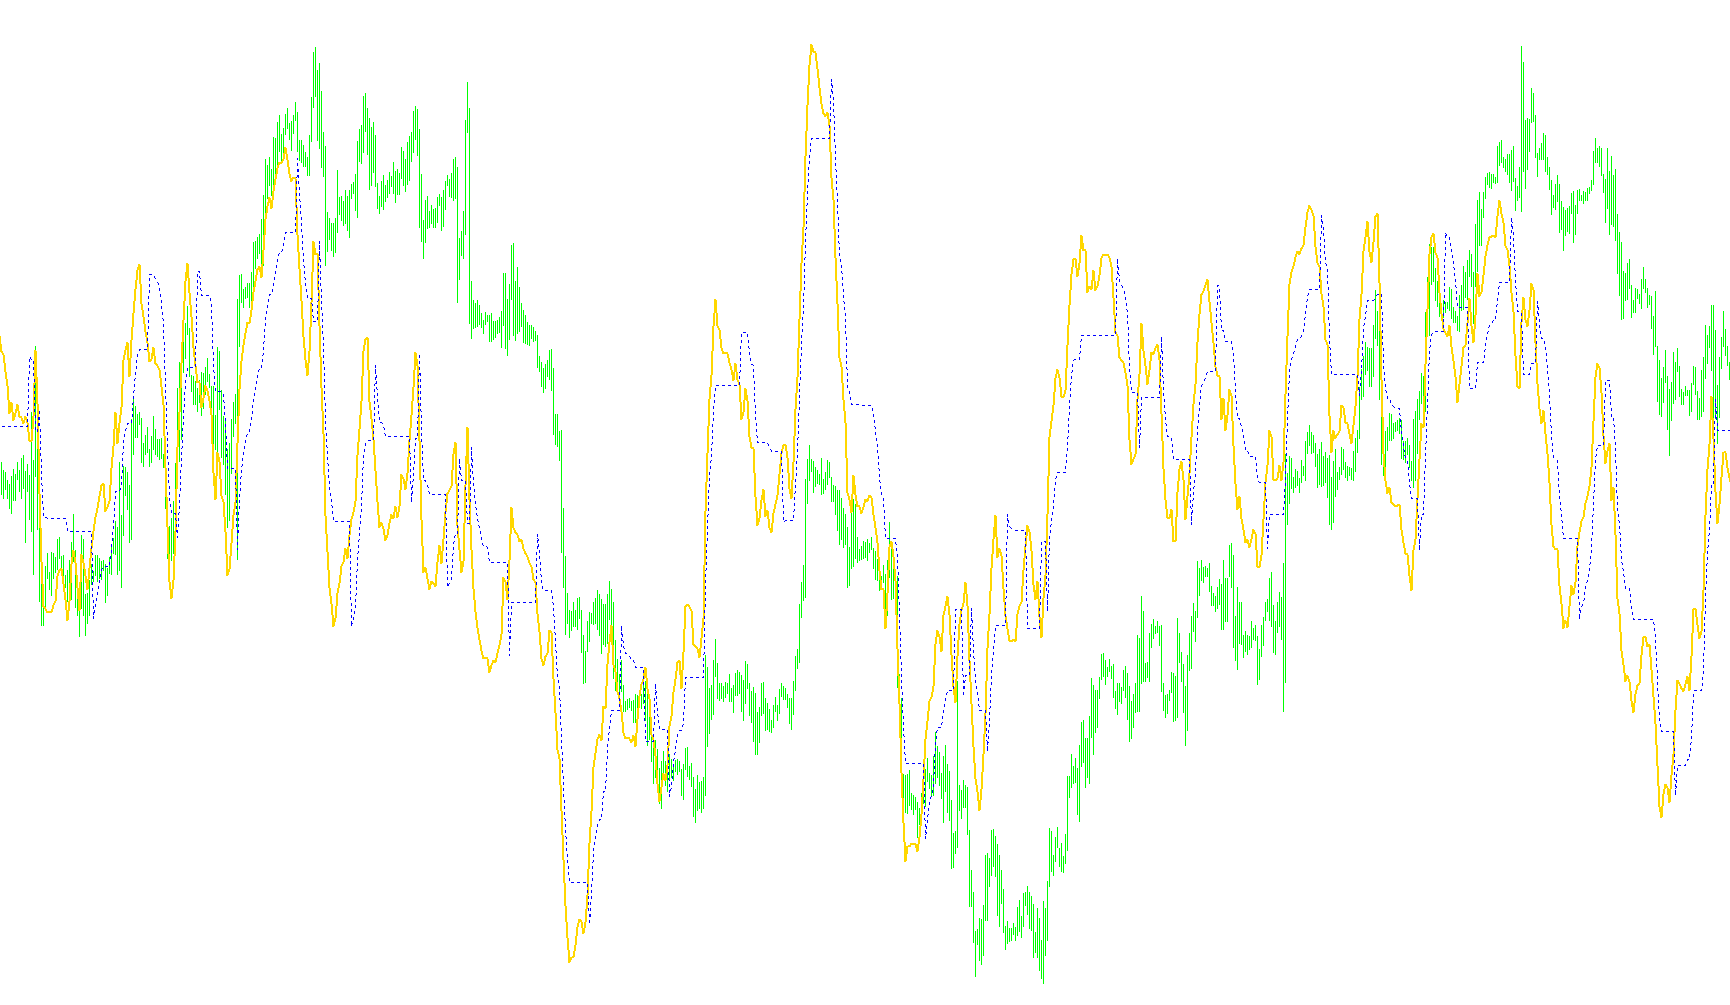
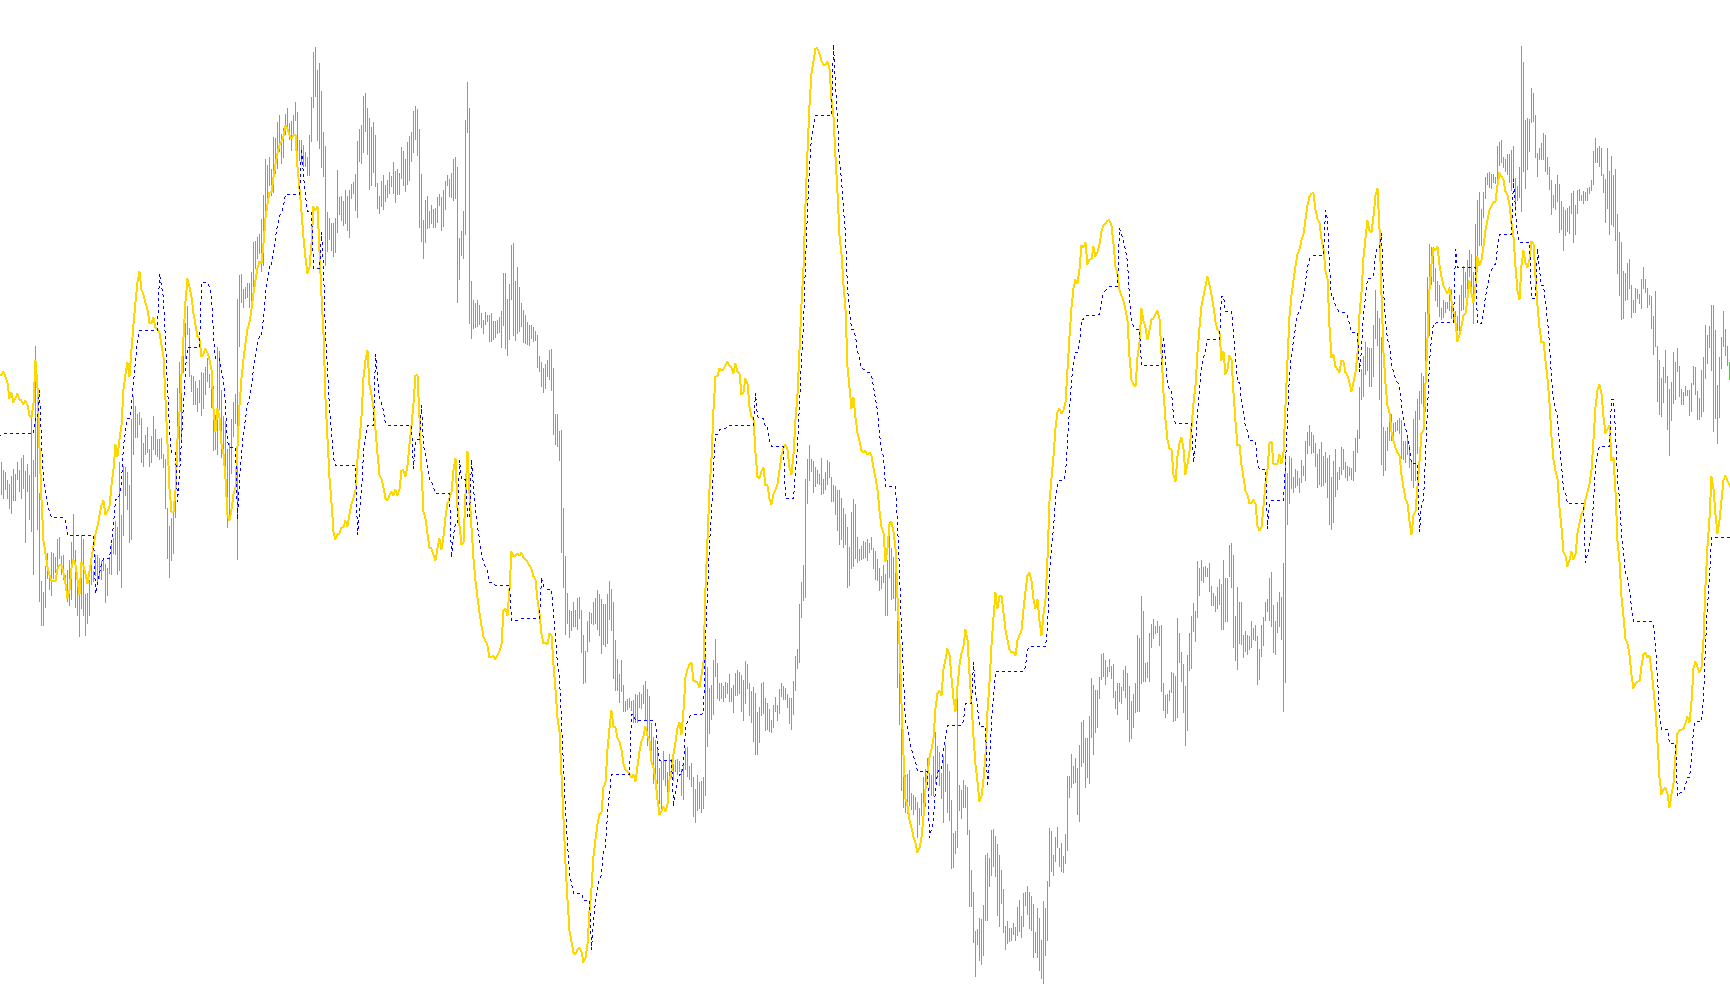
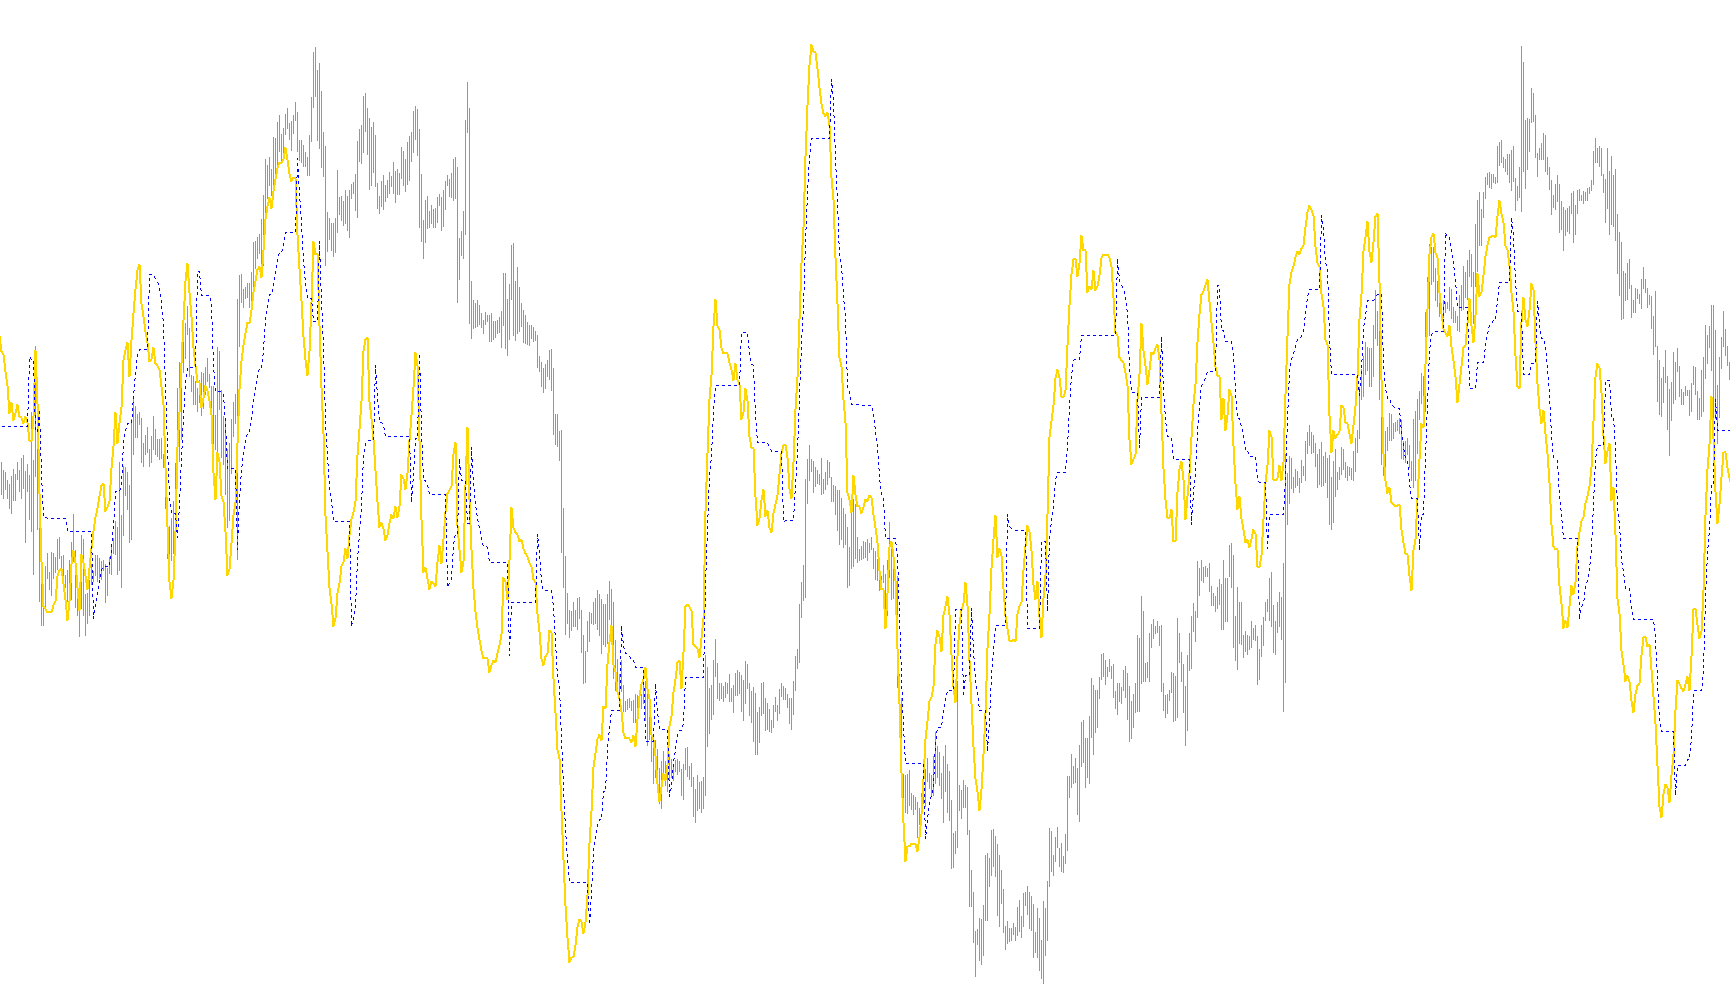
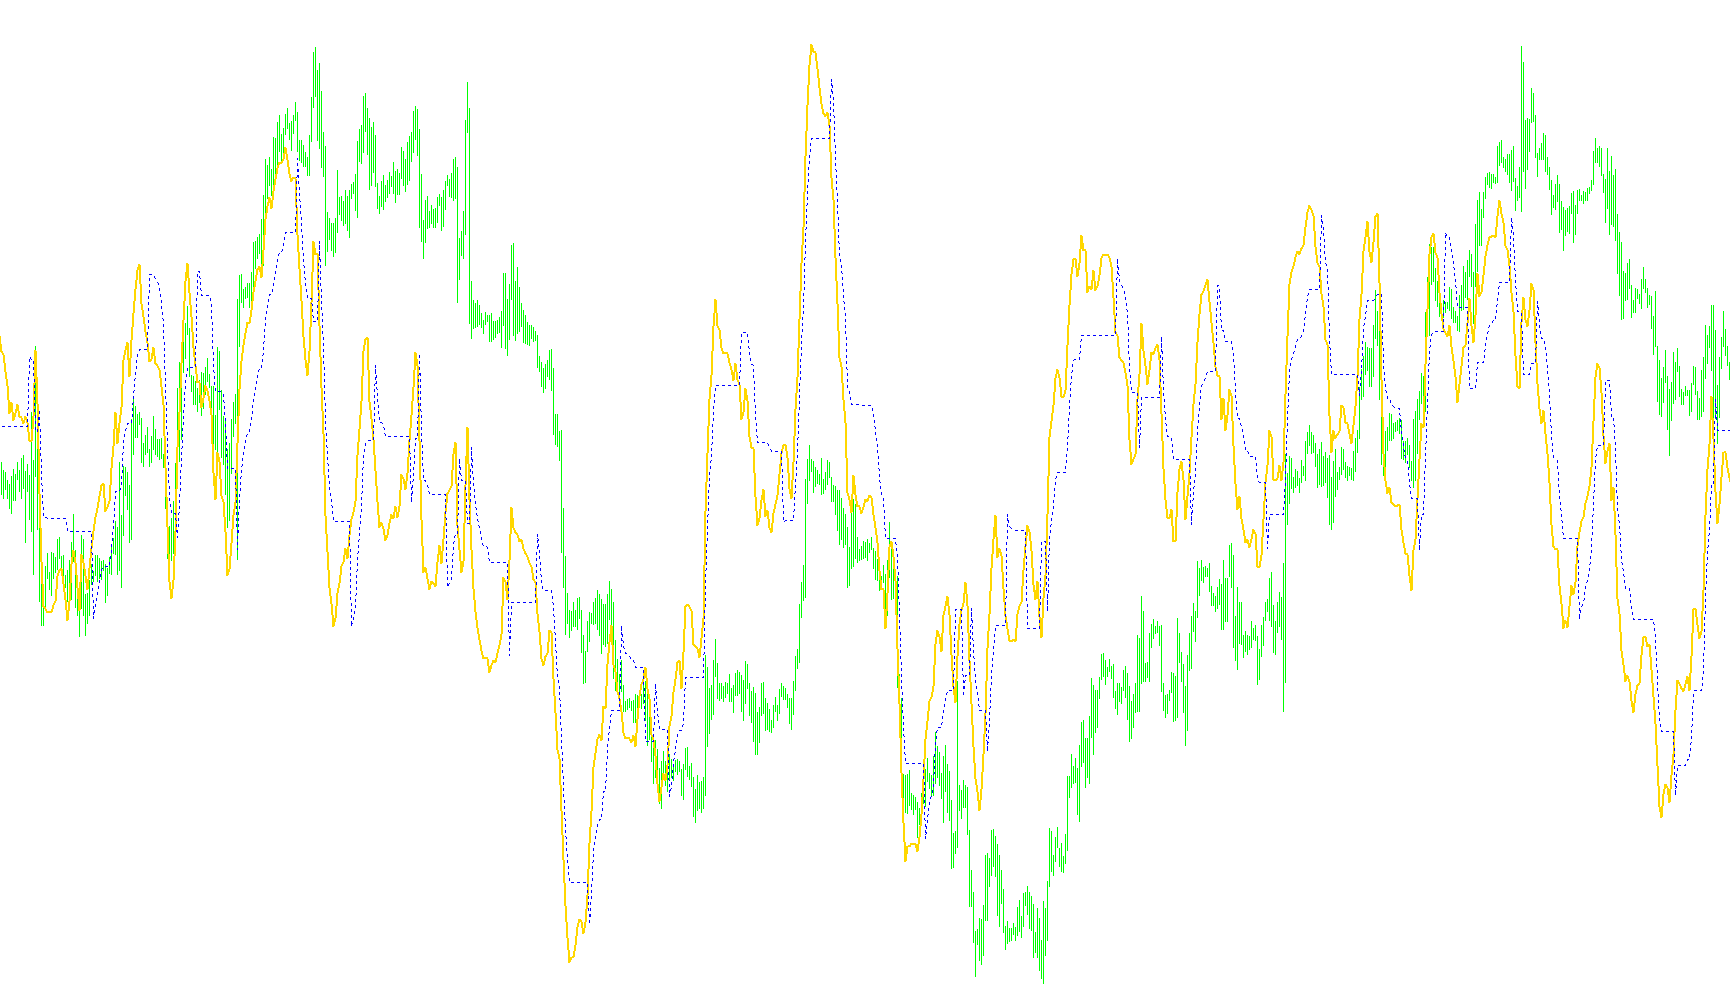
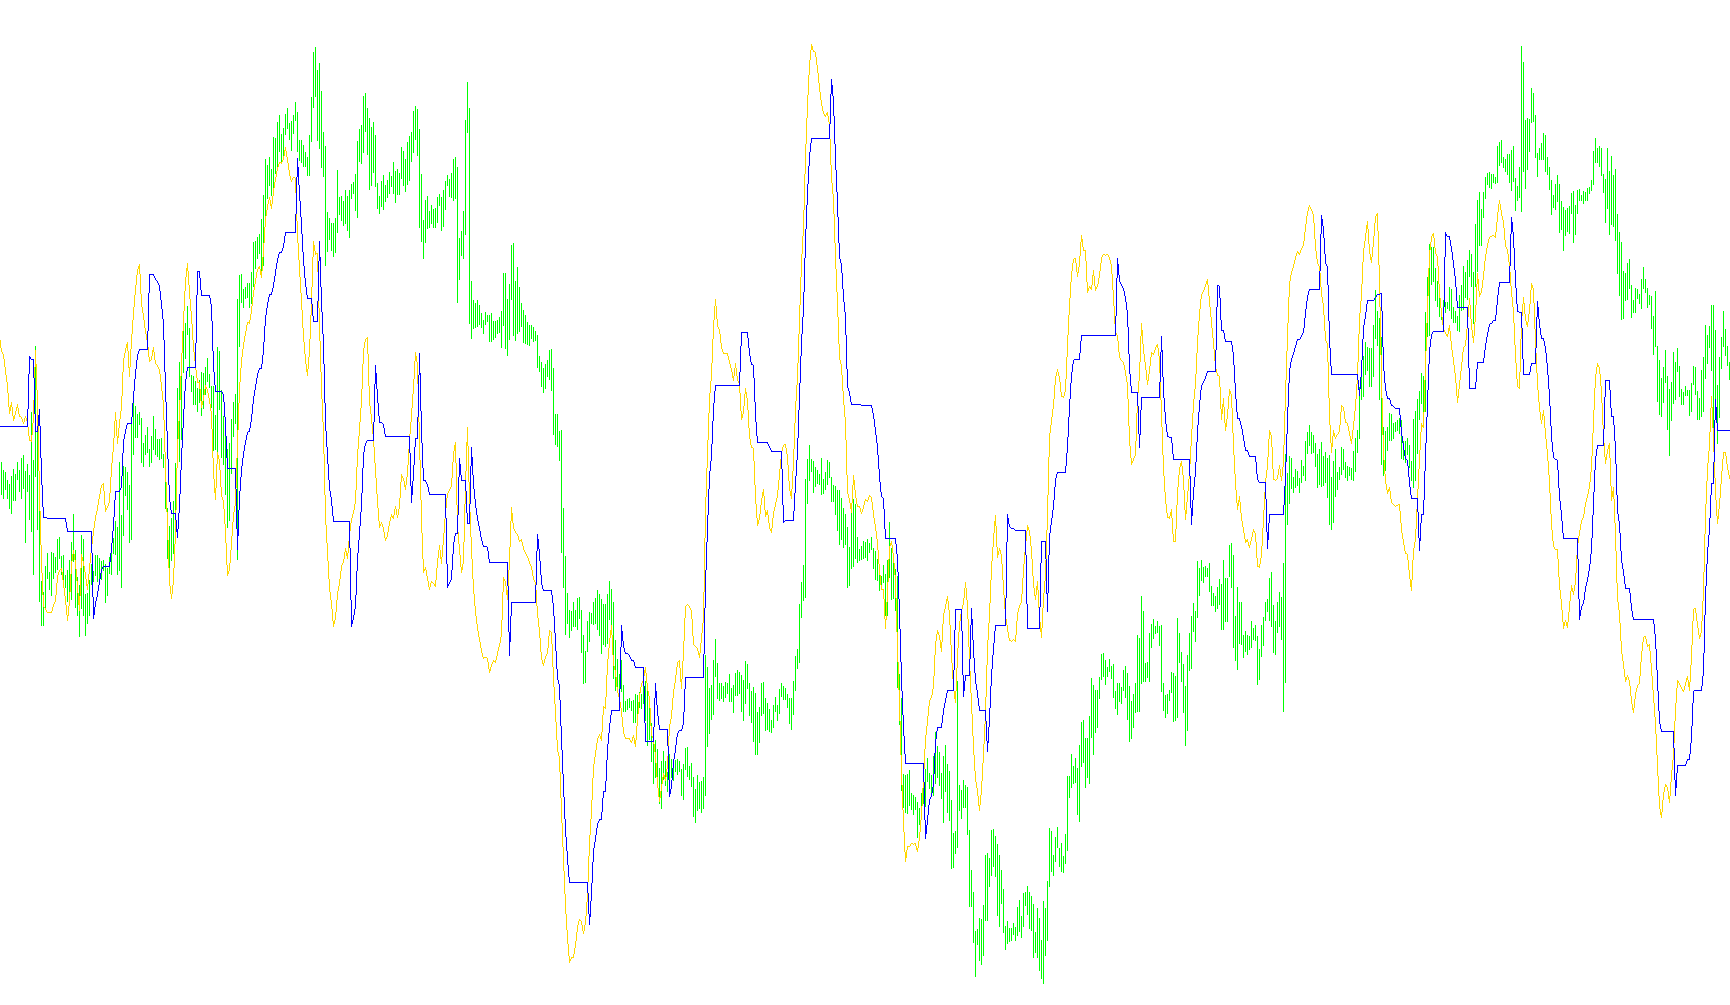
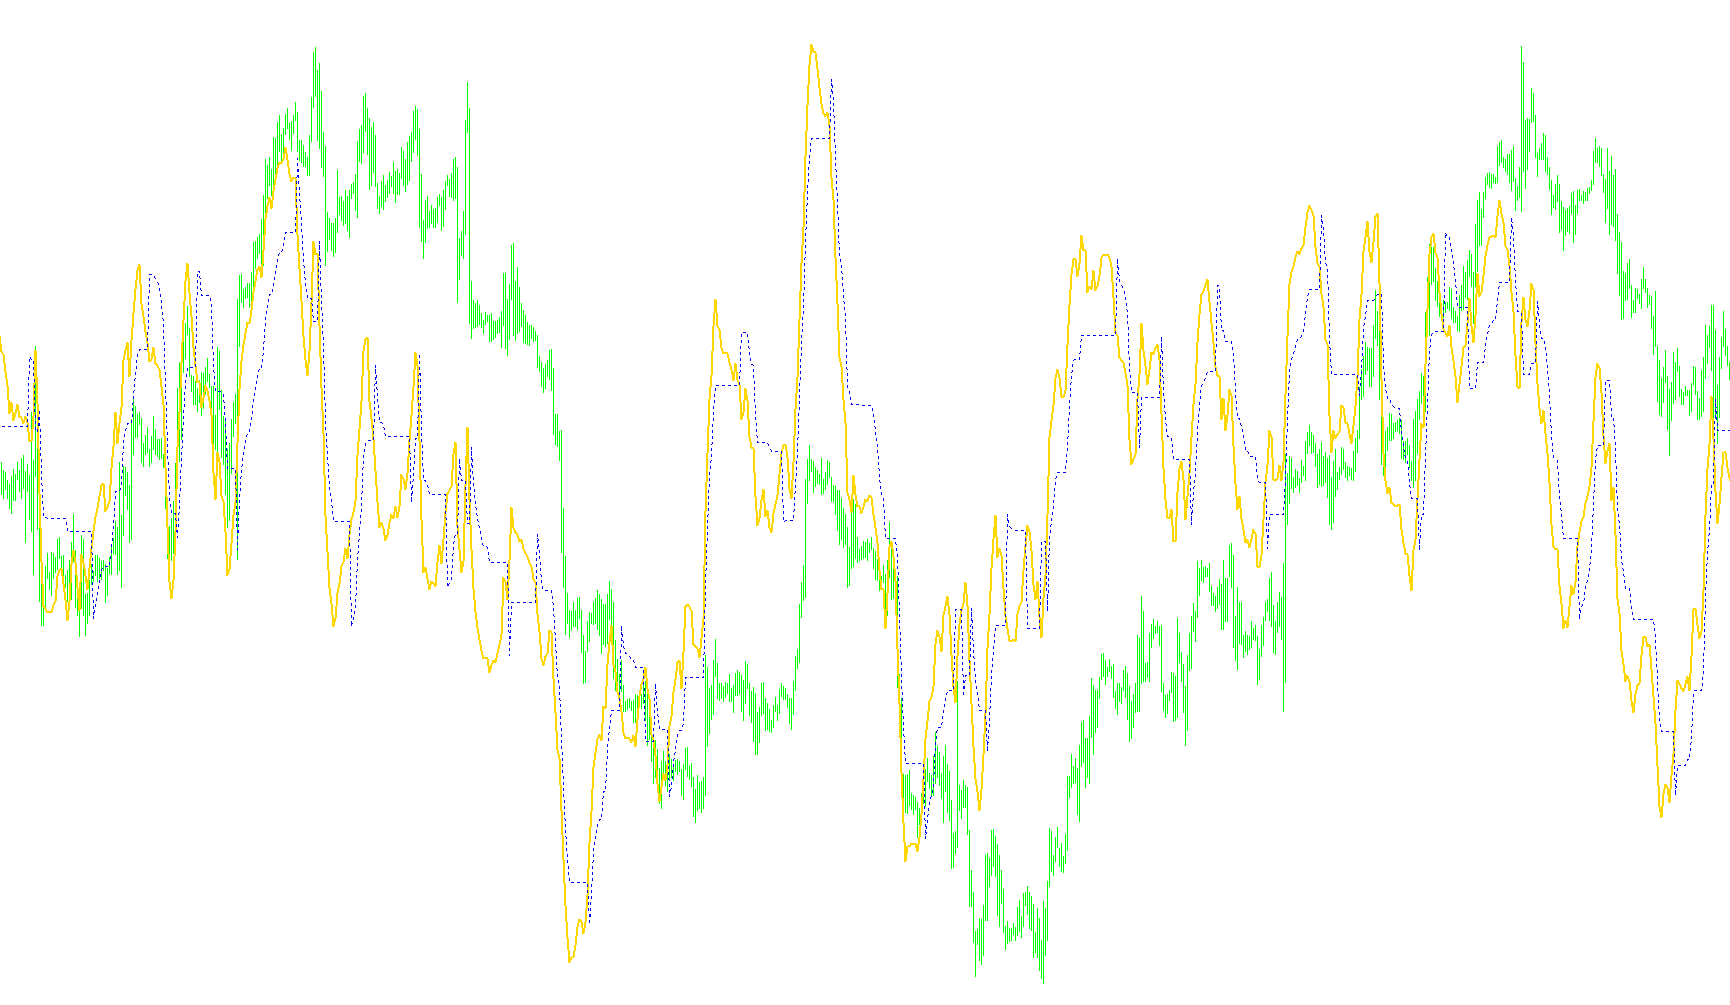
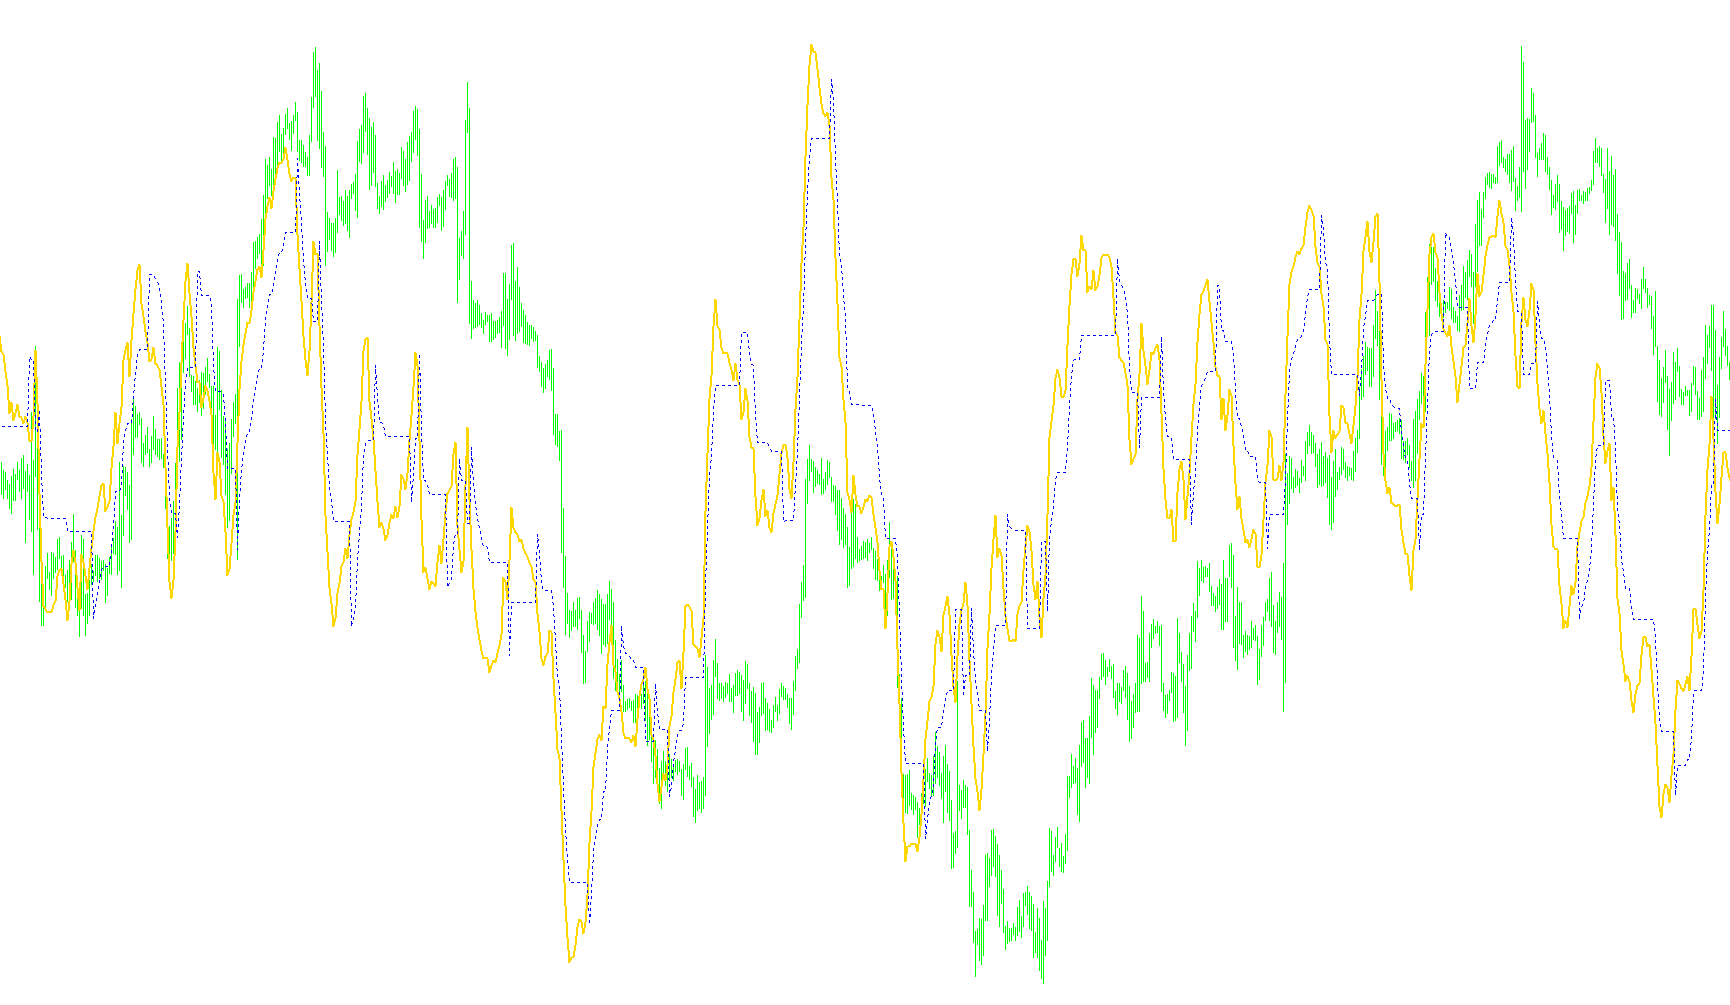
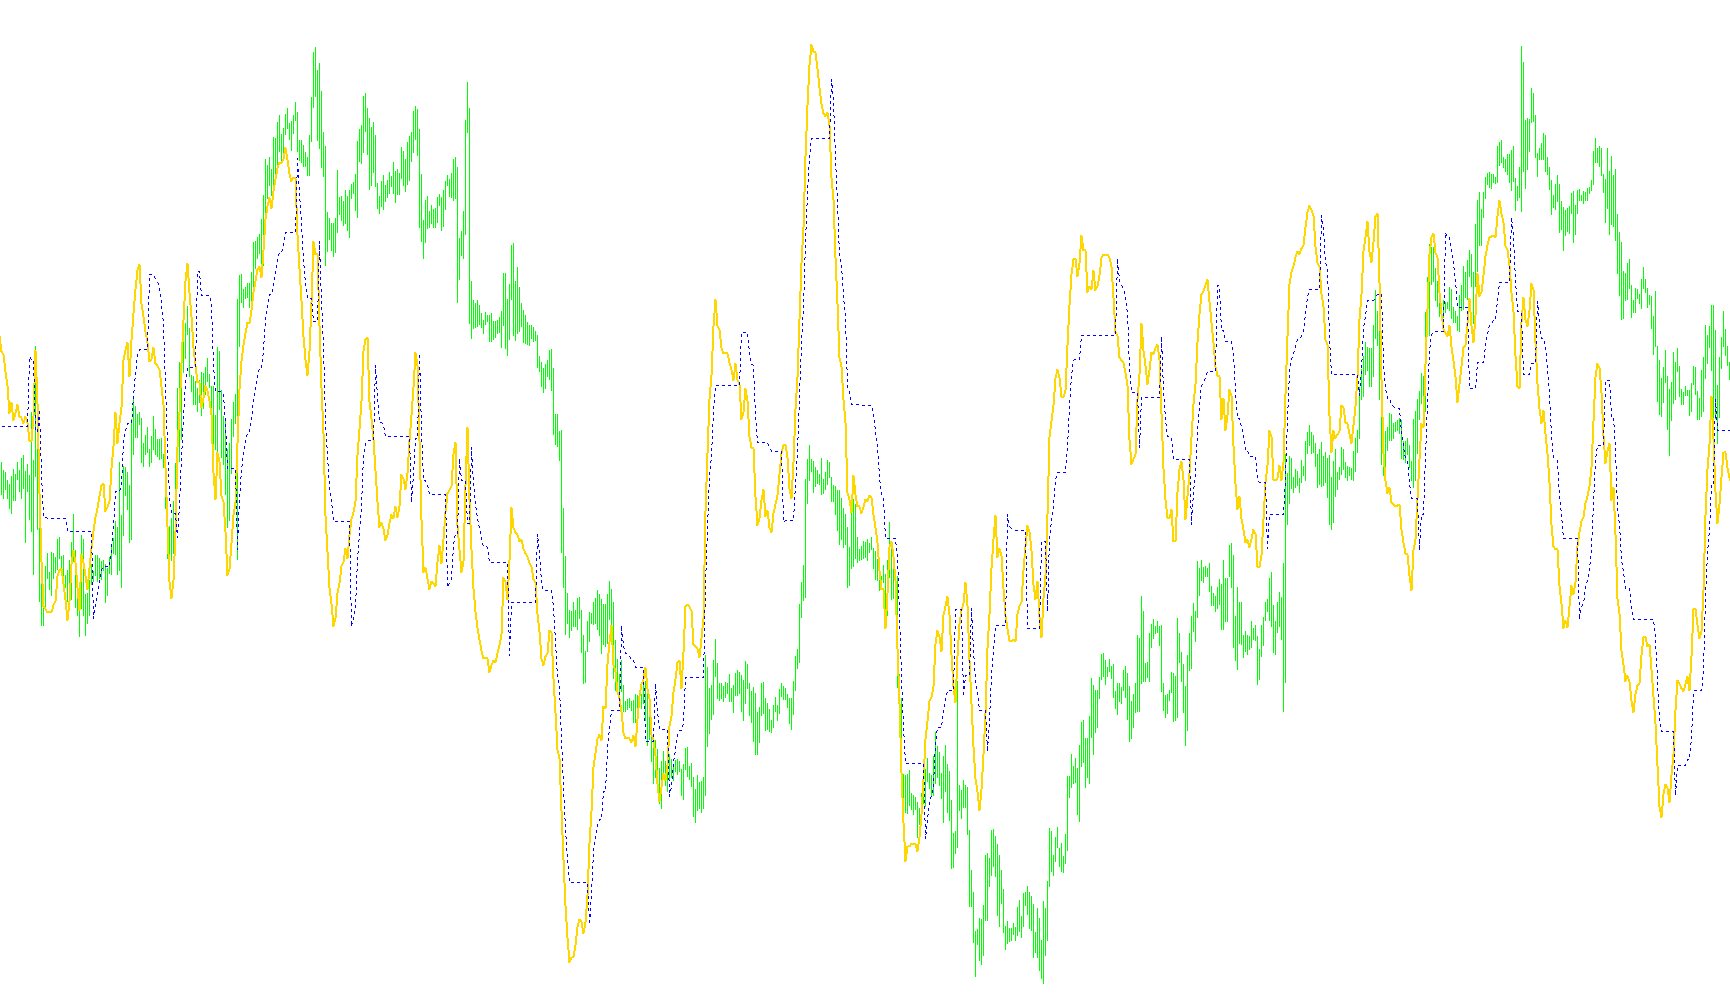
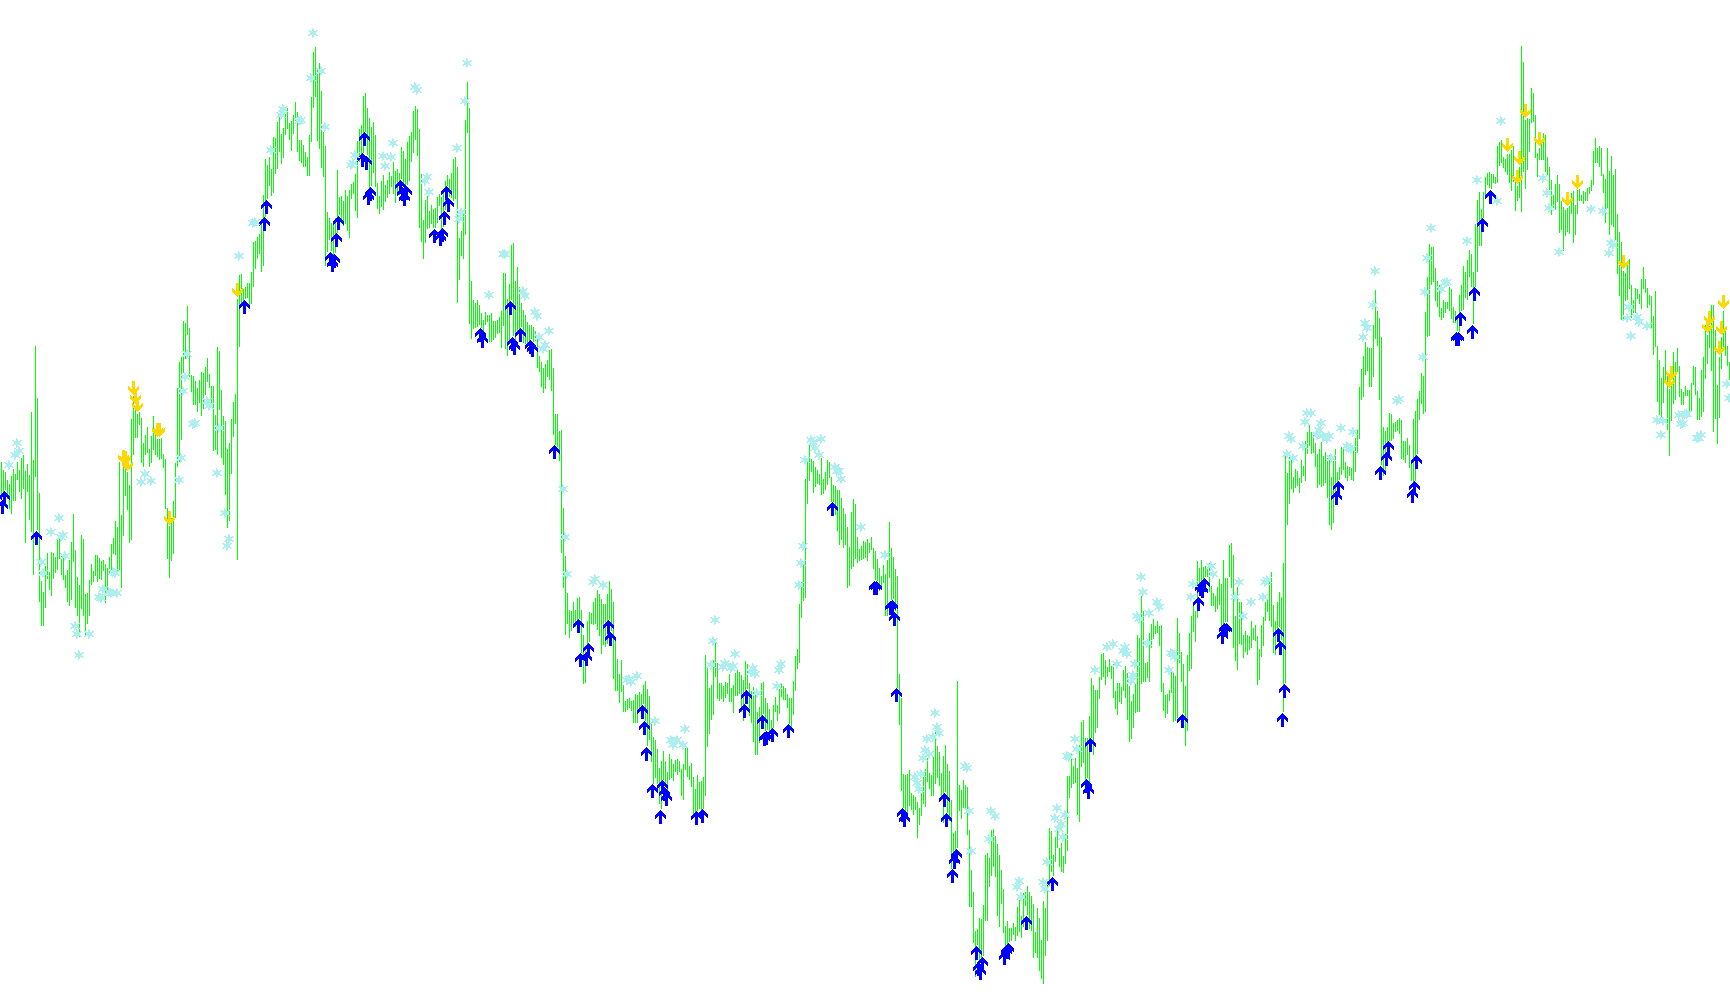
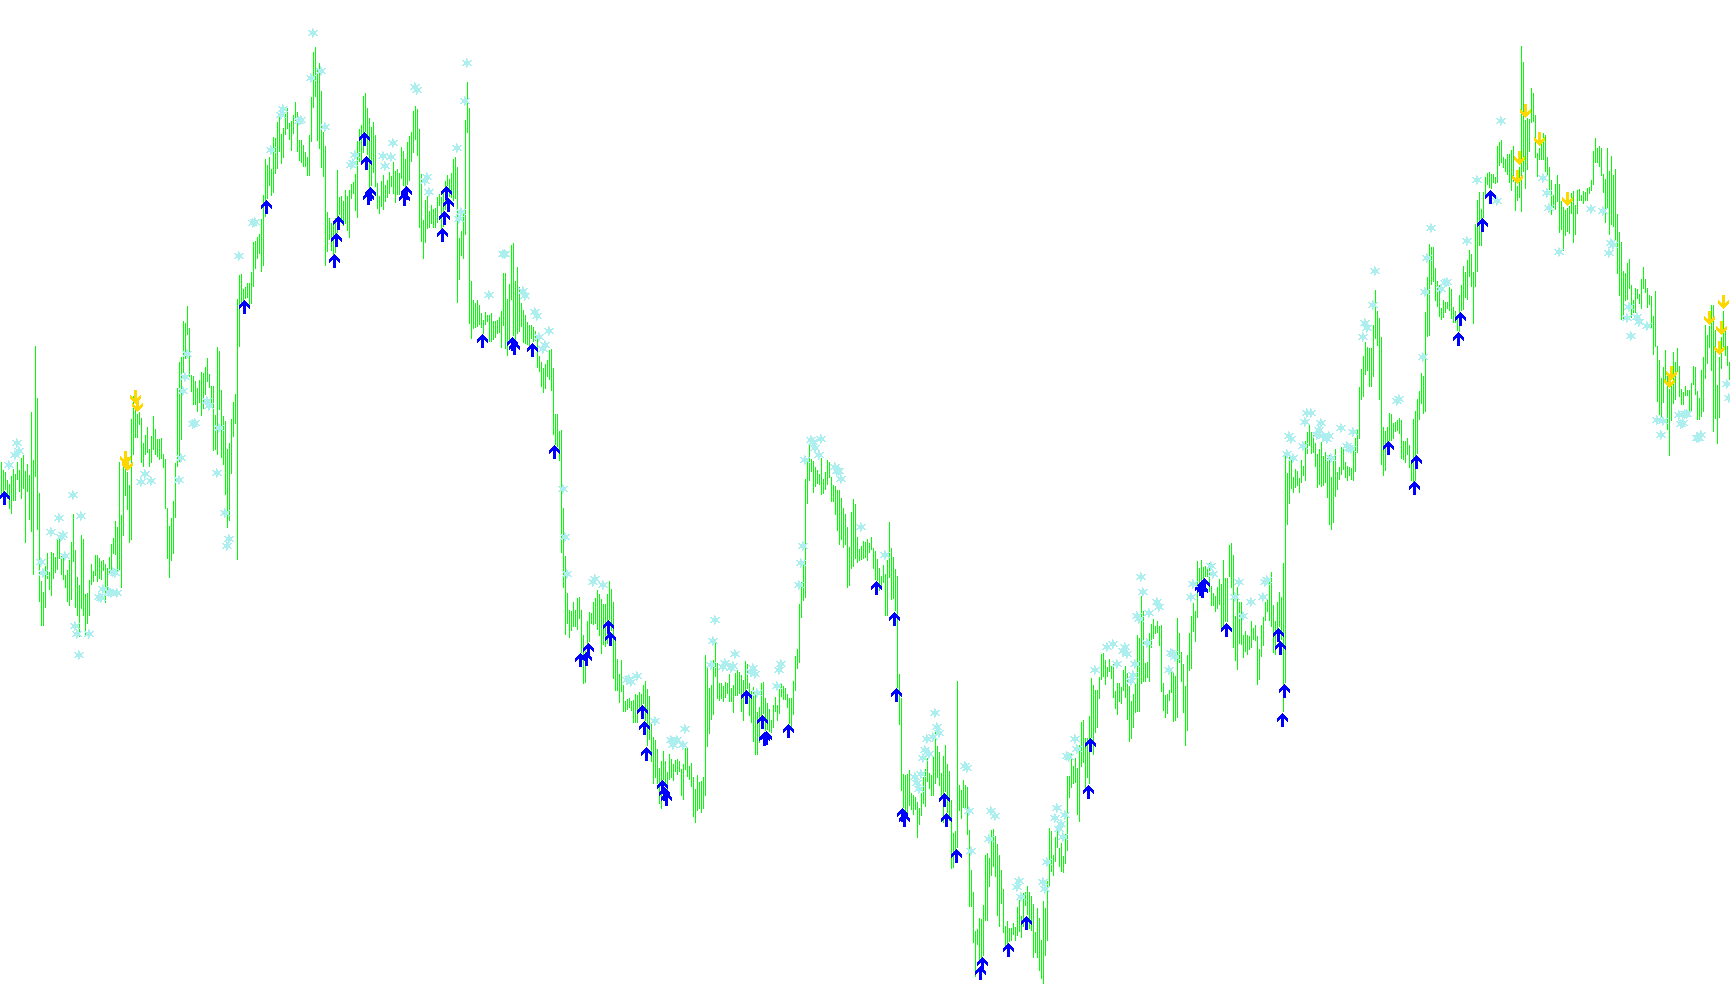
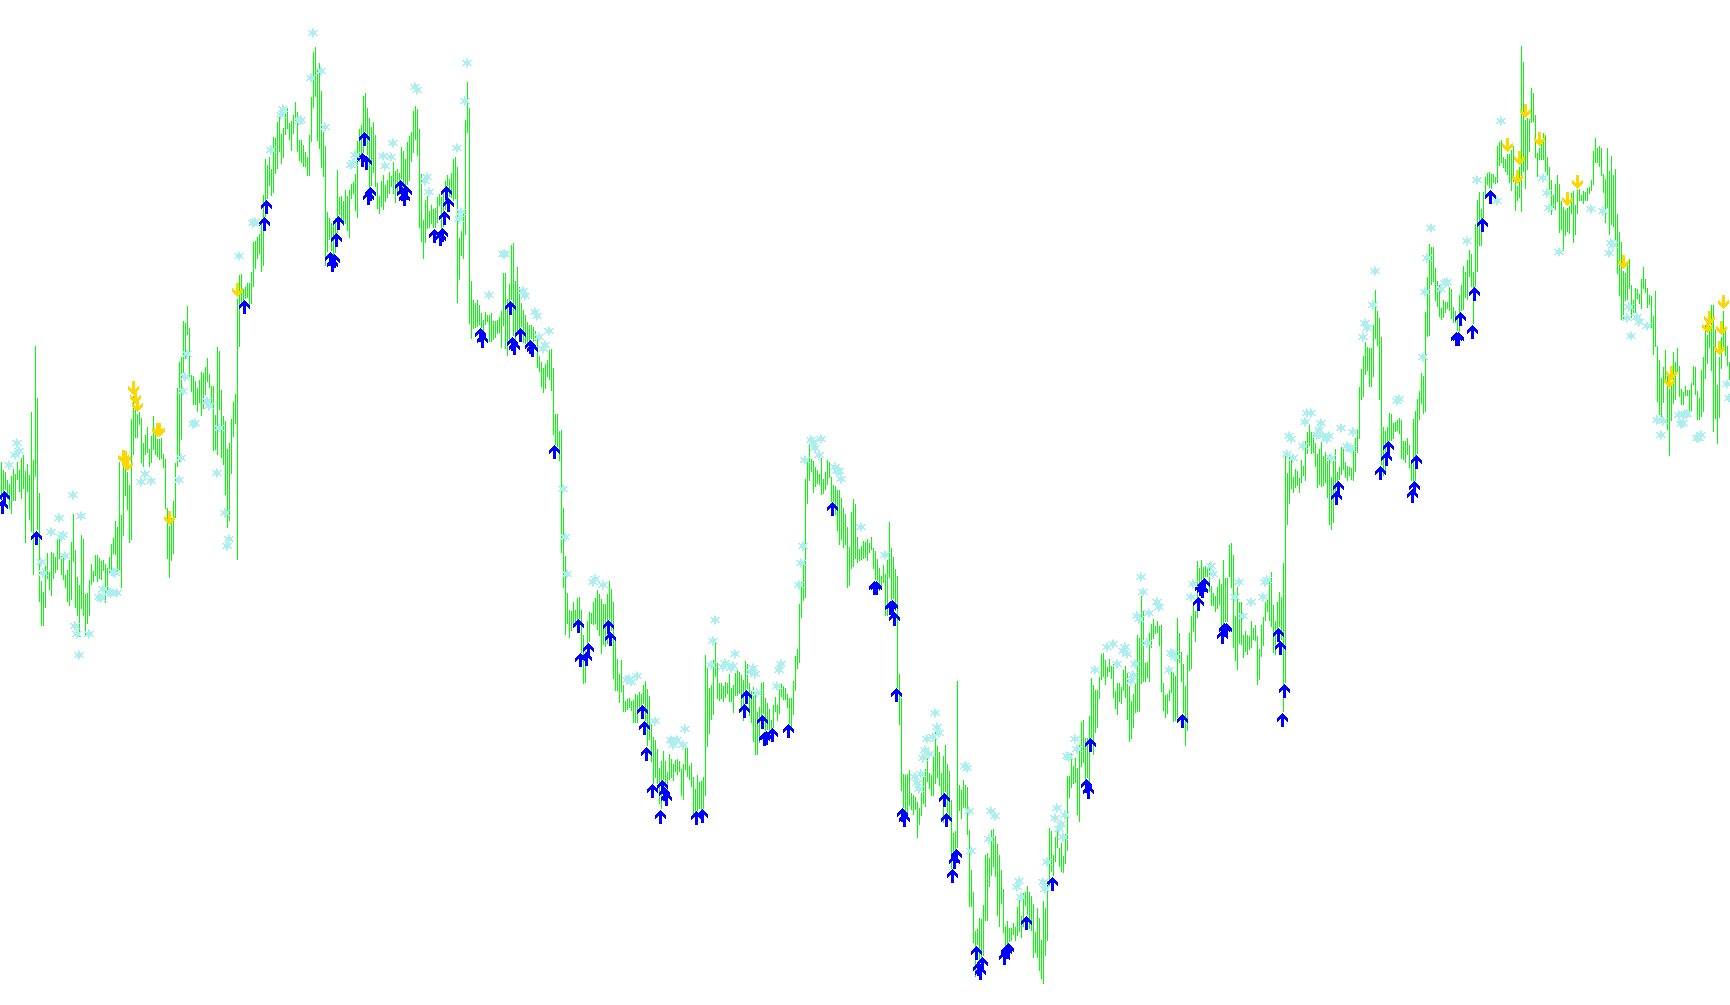
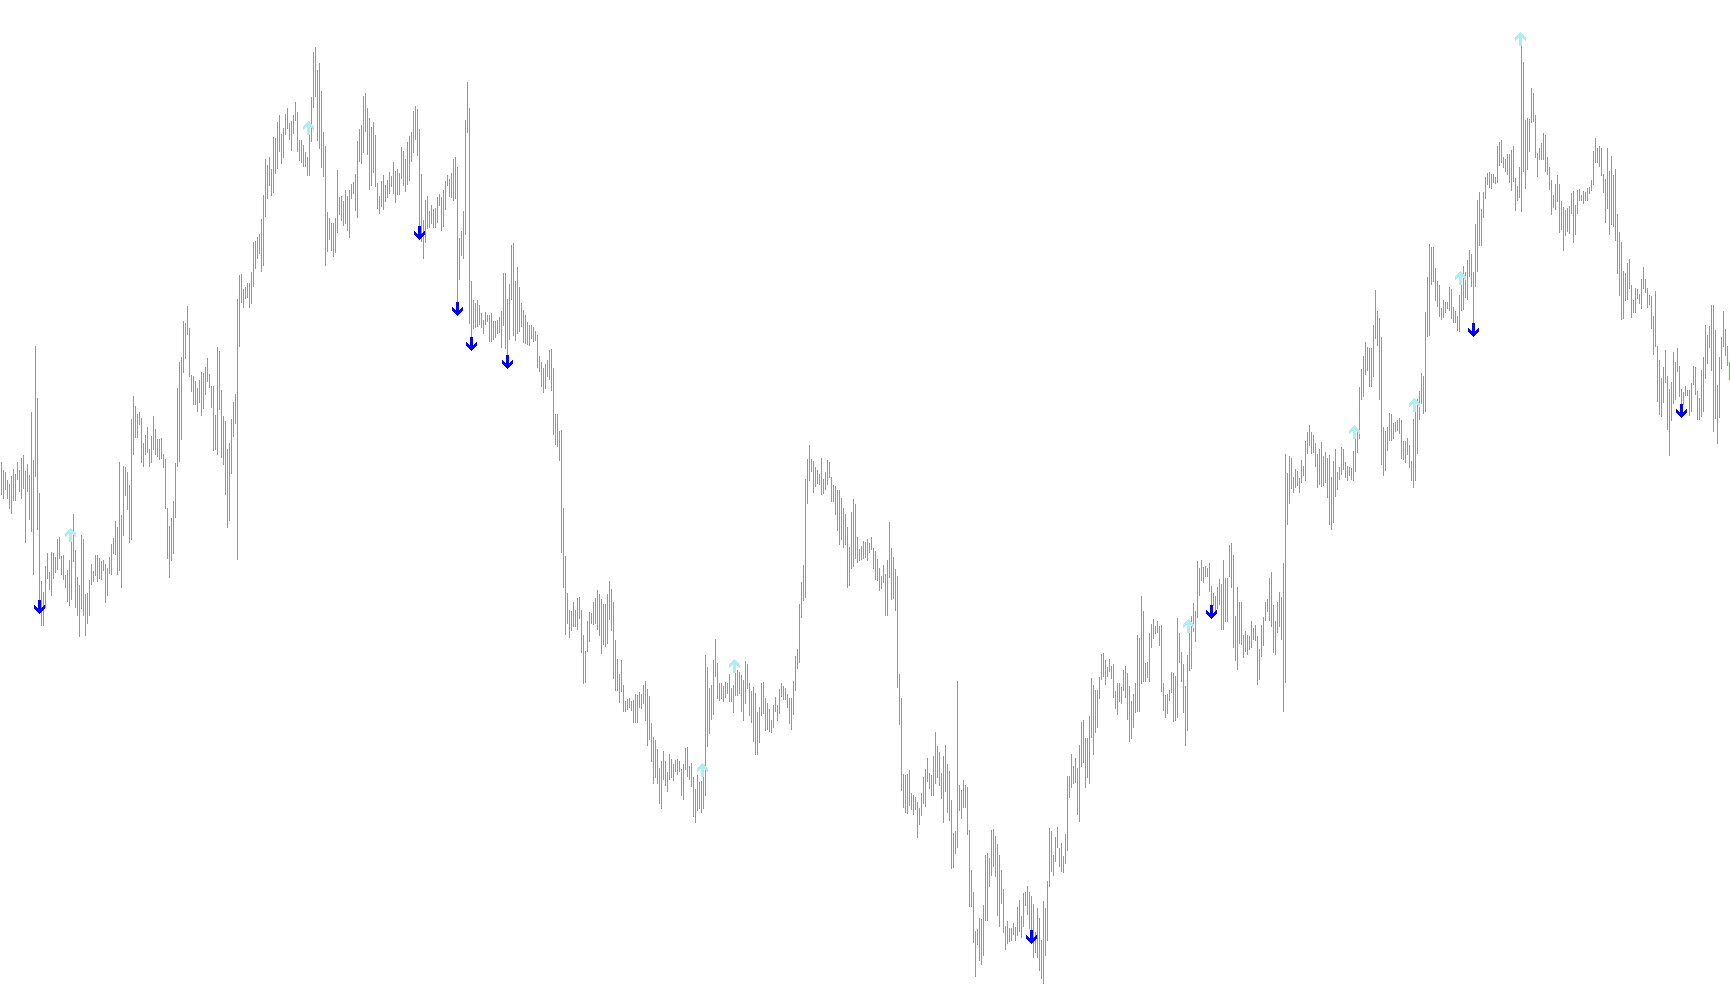
multisymbol_color-RSI_LQ_1[1].0
Indicator

multisymbol_color-RSI_LQ_1[1].0

iRSI

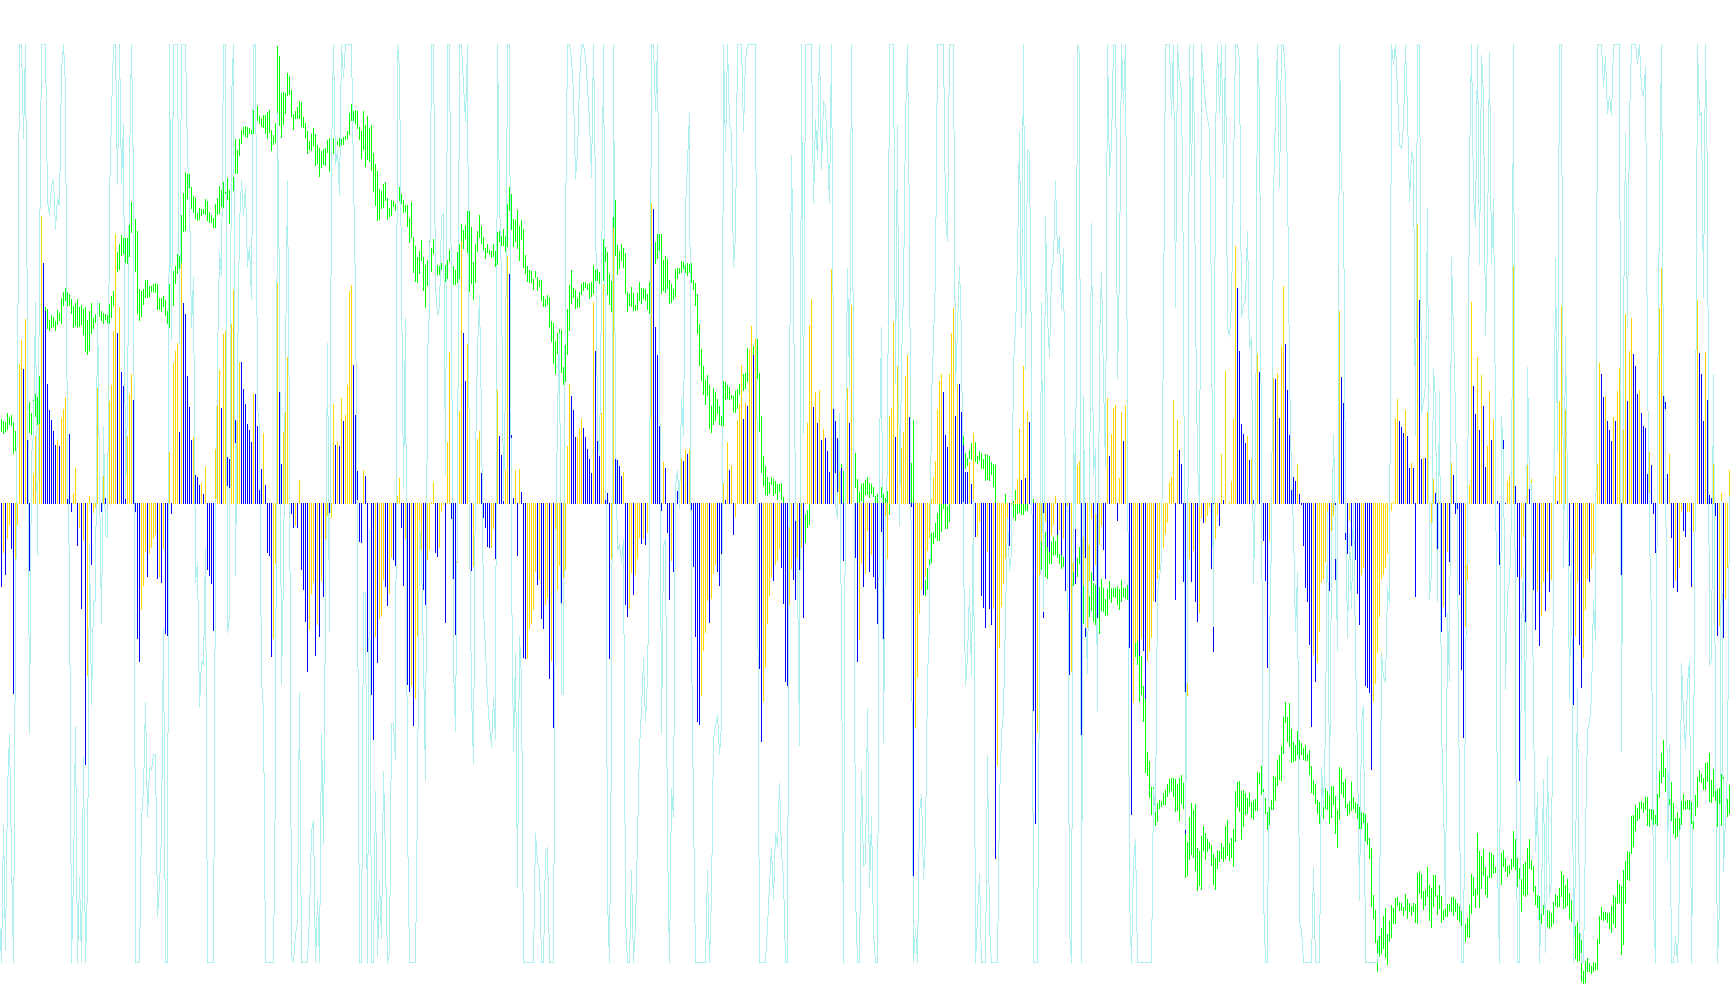
This indicator visualizes relative strength momentum by mapping RSI values into a multi-colored histogram that distinguishes between bearish, bullish, and neutral trend intensities.
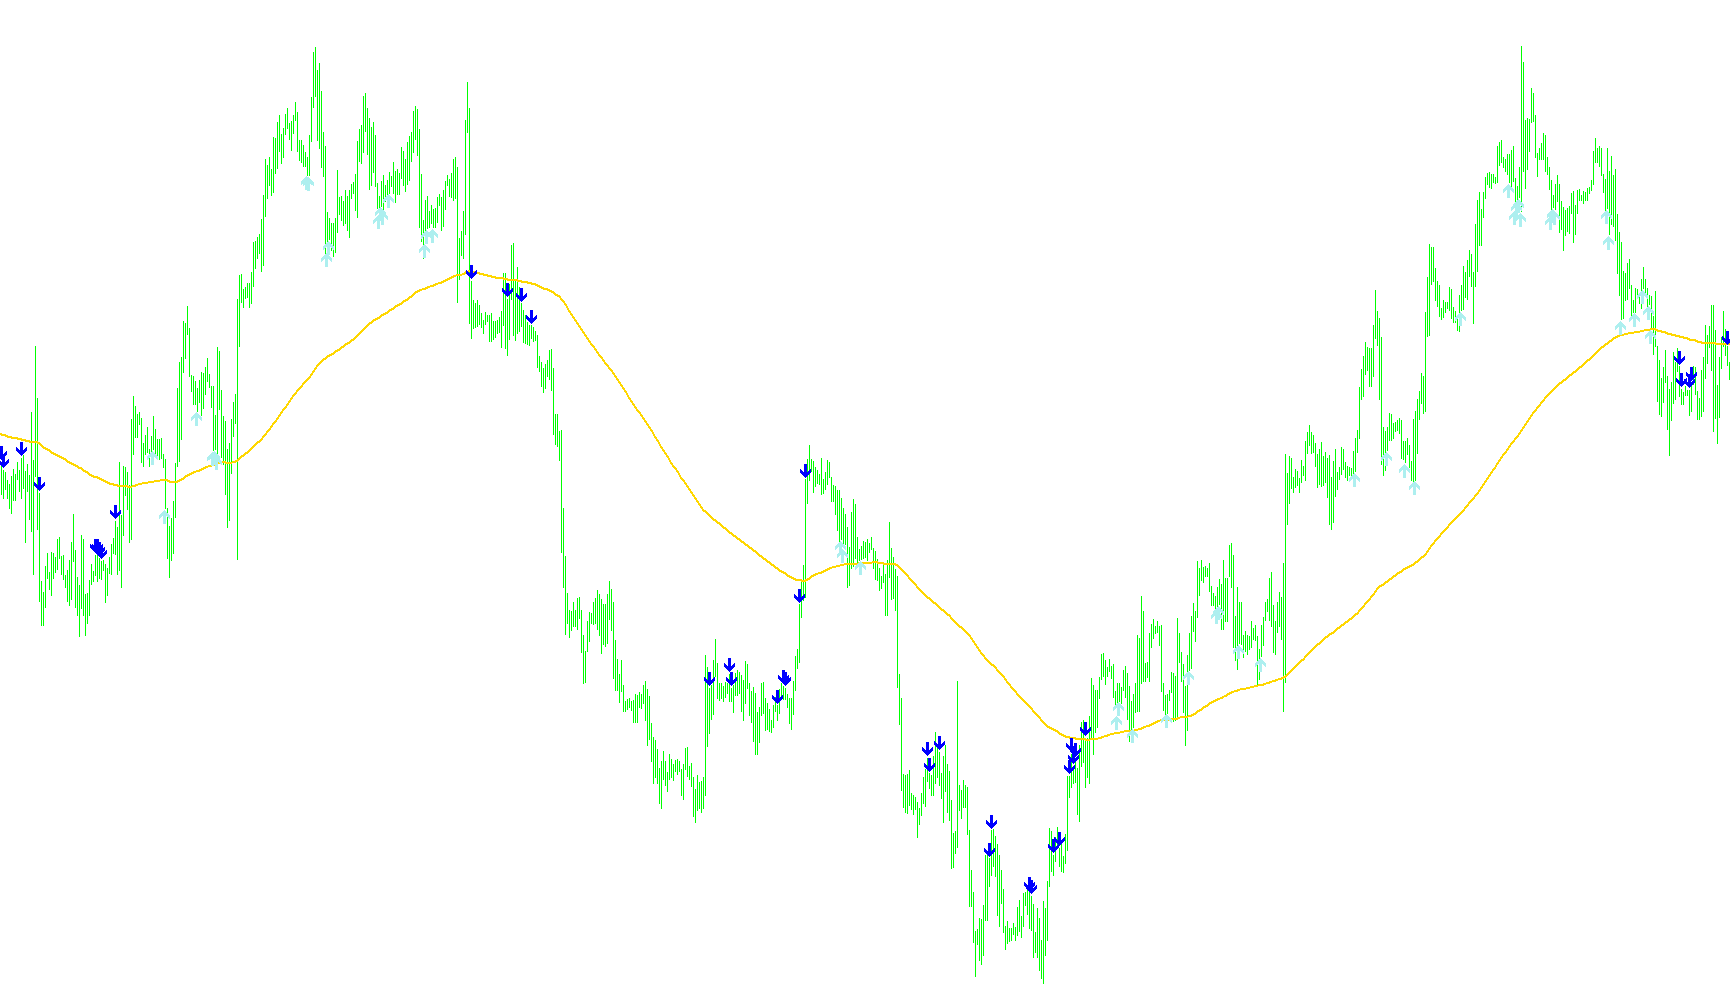
multisymbol_color_RSI_LQ_1.0M6
Indicator

multisymbol_color_RSI_LQ_1.0M6

iRSI

This indicator visualizes Relative Strength Index momentum by categorizing price action into distinct color-coded intensity zones based on threshold breaches.

Indicator

Multi_Oscillator_v1

iCCIiMFIiRSIiStochastic
Indicator

my_RSI

iRSI
my_squeeze
Indicator

my_squeeze

iCCIiMACDiRSIiStochastic

This indicator identifies market compression by comparing standard deviation against ATR to signal high-probability trend expansions validated by selectable momentum oscillators.

my_squeeze_Light
Indicator

my_squeeze_Light

iCCIiMACDiRSIiStochastic
my_squeeze_Light_001
Indicator

my_squeeze_Light_001

iCCIiMACDiRSIiStochastic
my_squeeze_Light_v2
Indicator

my_squeeze_Light_v2

iCCIiMACDiRSIiStochastic

This indicator identifies high-probability breakout points by detecting price compression through a modified Bollinger Band squeeze calculation combined with selectable momentum oscillators.

Indicator

NeuroTrend_Indicator

iWPRiMAiRSIiStochastic
okwhwilson
Indicator

okwhwilson

iMAiRSI

This indicator calculates dynamic price bands by adjusting a Smoothed Moving Average based on the relative deviation of a multi-period smoothed RSI.

Indicator

OnChart Rsi

iATRiMAiRSI
Indicator

OnChart Rsi[1]

iATRiMAiRSI
Indicator

OnChart Rsi_001

iATRiMAiRSI
Indicator

OnChart Rsi_v1

iATRiMAiRSI
oscillatorsonchart
Indicator

oscillatorsonchart

iCCIiMAiRSI
oscillator_of_indicator_and_ma
Indicator

oscillator_of_indicator_and_ma

iCCIiMACDiRVIiRSI

This tool synthesizes primary data from various technical oscillators—including MACD, RSI, CCI, RVI, and DeMarker—to calculate a unified momentum difference between the main indicator and its signal line.

OzFX_D1_IndAES_v1.0
Indicator

OzFX_D1_IndAES_v1.0

iACiAOiMAiStochastic

This indicator identifies trend reversals by correlating Awesome Oscillator (AO) momentum shifts with Stochastic crossovers, complemented by optional SMA and RSI trend filtration.

OzFX_D1_IndAES_v1.0_v1
Indicator

OzFX_D1_IndAES_v1.0_v1

iACiAOiMAiStochastic
pivot detector osillator
Indicator

pivot detector osillator

iMAiRSI

The indicator normalizes the Relative Strength Index based on dual threshold boundaries that shift dynamically depending on whether price is above or below its long-term moving average.

Pj-over RSI
Indicator

Pj-over RSI

iRSI

This indicator categorizes market velocity into four distinct states by mapping Relative Strength Index values to specific bullish, bearish, overbought, and oversold histogram zones.

Planet
Indicator

Planet

iMACDiMAiRSIiStochastic

This indicator identifies high-probability trend shifts by synchronizing H4 momentum filters—specifically EMA crossovers, RSI levels, and Stochastic trends—with real-time price action triggers.

Pretty_T3_RSI_LK_V1.0
Indicator

Pretty_T3_RSI_LK_V1.0

iRSI

This indicator calculates a smoothed momentum signal by applying the T3 moving average algorithm to a centered Relative Strength Index, complemented by an Inverse Fisher Transform trend filter.

Pretty_T3_RSI_LK_V1.1
Indicator

Pretty_T3_RSI_LK_V1.1

iRSI

This indicator applies a triple exponential moving average (T3) smoothing algorithm to the Relative Strength Index (RSI) to identify momentum trends with reduced lag and dynamic color-coded visual feedback.

Price range information
Indicator

Price range information

iCCIiMACDiRSIiStochastic

This indicator aggregates real-time data from multiple timeframes to provide a visual dashboard of MACD, RSI, Stochastic, CCI, and EMA trends simultaneously.

Indicator

ProbMeter_v1.1

iCCIiMACDiADXiMA
prsi_pcci
Indicator

prsi_pcci

iCCIiRSI

This indicator synchronizes primary and signal variations of RSI and CCI across different timeframes to visualize price momentum dynamics and trend shifts via histogram overlays.

QQE Spec
Indicator

QQE Spec

iMAOnArrayiRSI

The algorithm identifies trend direction by applying a double-smoothed exponential moving average to RSI deviations, utilizing a threshold-based logic to filter out market noise.

QQE with Alerts
Indicator

QQE with Alerts

iMAOnArrayiRSI

This indicator identifies trend exhaustion and momentum shifts by calculating a smoothed RSI derivative combined with a dynamic volatility-adjusted threshold.

QQE with Alerts_001
Indicator

QQE with Alerts_001

iMAOnArrayiRSI

This indicator identifies market momentum and trend reversals by calculating a smoothed RSI overlay with dynamic volatility-adjusted threshold levels.

QQE
Indicator

QQE

iMAOnArrayiRSI

This indicator synthesizes smoothed RSI values with an ATR-based volatility multiplier to construct a trailing dynamic threshold that filters market noise and identifies trend shifts.

QQEA
Indicator

QQEA

iMAOnArrayiRSI

This indicator calculates a smoothed price action threshold by dynamically adjusting RSI values with a volatility-based buffer to identify trend reversals and momentum exhaustion.

QQEA_001
Indicator

QQEA_001

iMAOnArrayiRSI
Indicator

QQEm1_mtf

iMAOnArrayiRSI
QQE_004
Indicator

QQE_004

iMAOnArrayiRSI
QQE_alerts
Indicator

QQE_alerts

iMAOnArrayiRSI

This indicator synthesizes RSI-based smoothing with a dynamic trajectory threshold to identify trend reversals and momentum shifts.

QQE_alerts_001
Indicator

QQE_alerts_001

iMAOnArrayiRSI

This indicator calculates trend direction by applying a dynamic price action filter to an exponential moving average of the RSI, utilizing a weighted volatility buffer to identify momentum reversals.

QQE_Alert_MTF_v5##
Indicator

QQE_Alert_MTF_v5##

iMAOnArrayiRSI

This indicator calculates a smoothed RSI derivative to identify momentum shifts by monitoring line crossovers and midpoint breaches.

QQE_v2
Indicator

QQE_v2

iMAOnArrayiRSI

The indicator synthesizes smoothed RSI values with an ATR-based volatility multiplier to establish a dynamic, non-linear trailing threshold that adapts to price momentum.

QQE_with_Alertsd
Indicator

QQE_with_Alertsd

iMAOnArrayiRSI
qqq
Indicator

qqq

iMAOnArrayiRSI

This indicator synthesizes Relative Strength Index (RSI) smoothing with a proprietary volatility-adjusted trailing threshold to identify precise momentum reversals and trend exhaustion.

R2_Arrows
Indicator

R2_Arrows

iMAiRSI

This indicator identifies directional reversals by synchronizing daily SMA trend filtering with multi-day RSI momentum acceleration and exhaustion thresholds.

R2_ArrowsV1
Indicator

R2_ArrowsV1

iMAiRSI

This indicator identifies high-probability trend reversals by detecting sequential momentum shifts in RSI relative to a long-term SMA filter on a daily timeframe.

R2_Arrows_v2
Indicator

R2_Arrows_v2

iMAiRSI
R2_Arrows_v3
Indicator

R2_Arrows_v3

iMAiRSI

This indicator identifies trend-aligned entries by detecting three consecutive declining or ascending RSI values relative to a moving average while signaling potential exits via extreme momentum reversal thresholds.

R2_Arrows_v4
Indicator

R2_Arrows_v4

iMAiMAOnArrayiRSI

This indicator identifies trend reversals by combining Hull Moving Average price action with a sequential multi-day RSI momentum progression for precise entry and exit signals.

R2_Arrows_v4a
Indicator

R2_Arrows_v4a

iMAiMAOnArrayiRSI

This indicator identifies trend-following entry points by detecting price closure relative to a Hull or standard Moving Average coupled with sequential three-period RSI momentum shifts.

R2_Arrows_v4a1
Indicator

R2_Arrows_v4a1

iMAiMAOnArrayiRSI

This indicator identifies trend reversals by detecting escalating RSI momentum slopes relative to price positioning against a Hull Moving Average or standard moving average baseline.

R2_Arrows_v4b
Indicator

R2_Arrows_v4b

iMAiRSI

This indicator identifies high-probability reversal points by detecting three consecutive periods of accelerating RSI momentum while the price action remains aligned with a long-term moving average trend.

R2_Arrows_v4c
Indicator

R2_Arrows_v4c

iRSIiStochastic

This indicator identifies high-probability entries by detecting consecutive descending or ascending Relative Strength Index movements synchronized with specific Stochastic Oscillator momentum thresholds.

R2_Arrows_v4d
Indicator

R2_Arrows_v4d

iRSIiStochastic