QQEA
Download script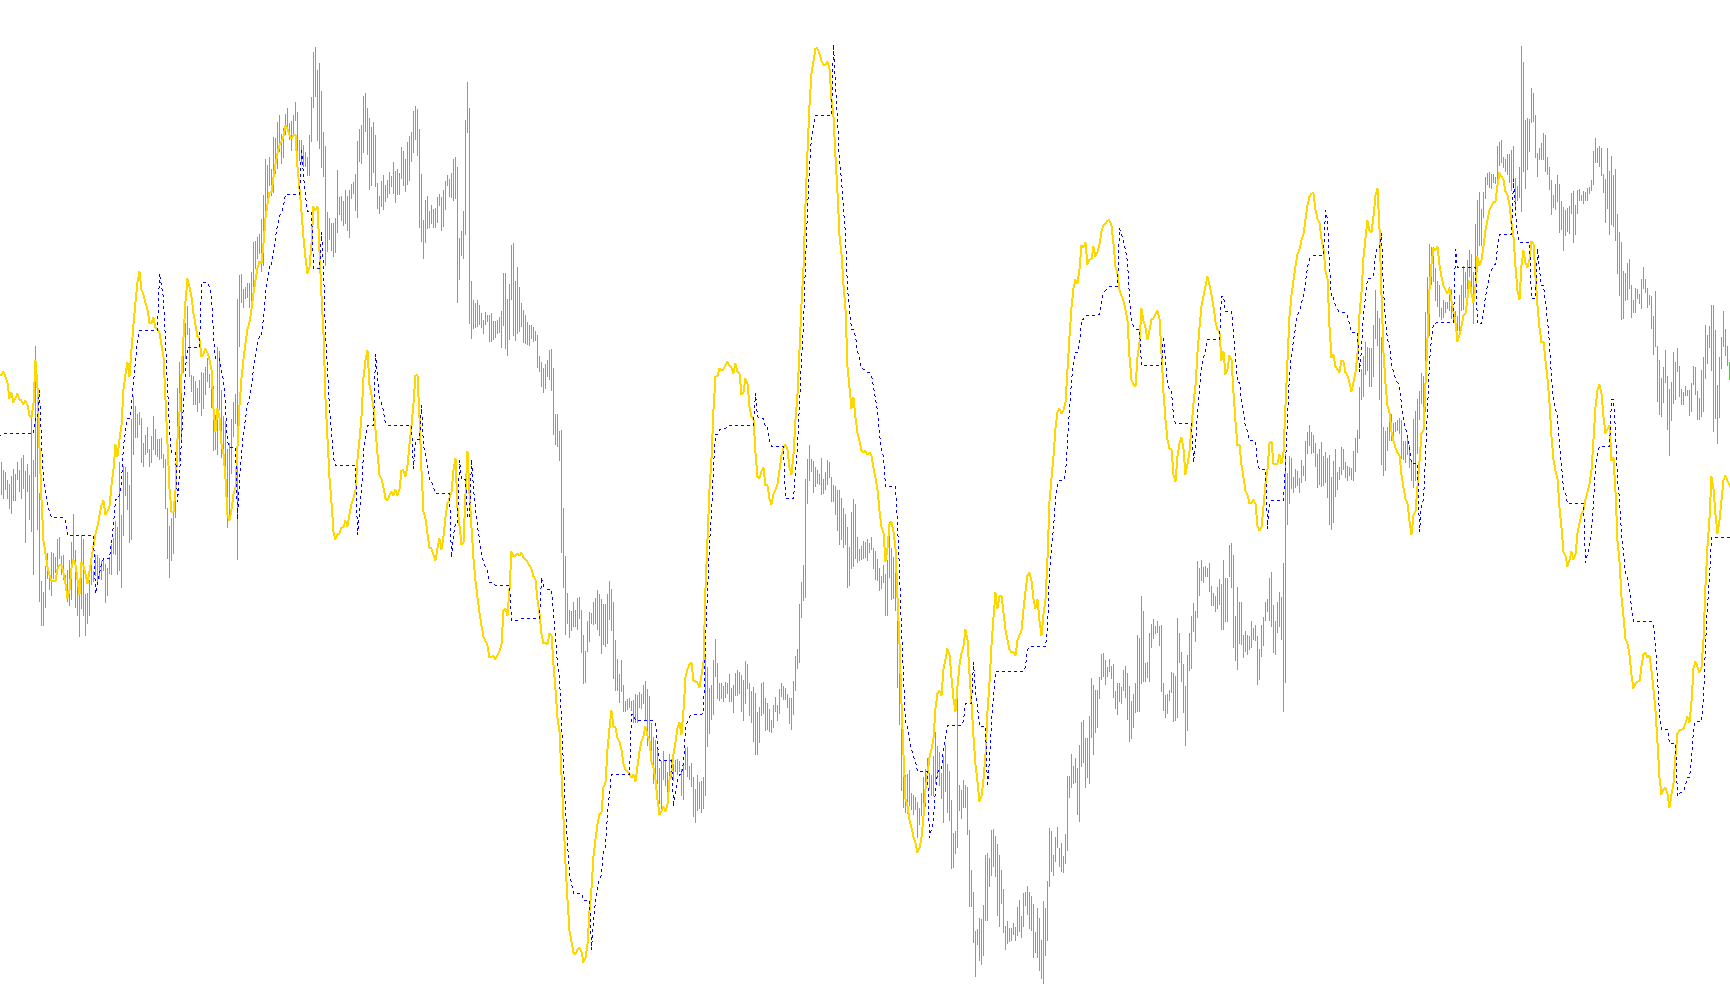
This script introduces a sophisticated technical analysis tool designed to help traders identify market trends and potential reversal points by blending momentum and volatility. Rather than looking at price action in isolation, it analyzes the "speed" and "strength" of price movements to smooth out market noise.
Core Logic Overview
The indicator operates by layering several different types of mathematical filters on top of each other. It essentially takes a standard momentum reading (how fast price is moving) and refines it through three distinct stages:
1. Momentum Smoothing The logic begins by calculating a Relative Strength Index (RSI). However, instead of using the raw RSI—which can be jumpy and erratic—the script applies an Exponential Moving Average to the data. This creates a smoother line that represents the underlying trend rather than momentary price spikes.
2. Volatility Measurement The script then measures the "change" in that smoothed momentum. By calculating the difference between current and previous values, it determines how much the momentum is swinging. It takes this fluctuation and applies a secondary smoothing process (using a long-term moving average) to create a stable baseline for market volatility.
3. Dynamic Trailing Logic The most unique part of this script is how it handles the final output. It uses a "Trailing Level" logic combined with a multiplier (the DARFACTOR).
- When momentum moves in a specific direction, the indicator calculates a target level based on the volatility.
- It then checks this target against the previous value to ensure the line doesn't move backward in an unrealistic way.
- This creates a "ratchet" effect: the line follows the trend upward or downward but stays "locked" if the price action suggests a reversal or stagnation, preventing the indicator from giving false signals during minor retracements.
Summary for the Trader
In practical terms, this script provides a visual representation of market sentiment that is filtered for stability. Because it combines momentum (RSI), trend smoothing (EMA), and volatility-based trailing logic, it aims to show you the "true" direction of the market while ignoring the "noise" of minor price fluctuations. It effectively identifies when a trend is gaining strength and provides a smoother path for identifying when that strength is beginning to fade.
//+------------------------------------------------------------------+
//|   Qualitative Quantitative Estimation Indicator for Metatrader 4 |
//|                                     Copyright © 2006Roman Ignatov |
//|                                   mailto:roman.ignatov@gmail.com |
//+------------------------------------------------------------------+
#property copyright "Copyright © 200 Roman Ignatov"
#property link      "mailto:roman.ignatov@gmail.com"

#property indicator_separate_window

#property indicator_buffers 2

#property indicator_color1 Black
#property indicator_style1 STYLE_SOLID
#property indicator_width1 2

#property indicator_color2 Black
#property indicator_style2 STYLE_DOT
#property indicator_width2 1

extern int SF = 8; // original 5
extern int RSI_Period = 18; // original 14
extern double DARFACTOR = 4.236; //original 4.236


int Wilders_Period;
int StartBar;

double TrLevelSlow[];
double AtrRsi[];
double MaAtrRsi[];
double Rsi[];
double RsiMa[];

int init()
{
    Wilders_Period = RSI_Period * 2 - 1;
    if (Wilders_Period < SF)
        StartBar = SF;
    else
        StartBar = Wilders_Period;

    IndicatorBuffers(6);
    SetIndexBuffer(0, RsiMa);
    SetIndexStyle(0, DRAW_LINE, STYLE_SOLID, 2);
    SetIndexLabel(0, "Value 1");
    SetIndexDrawBegin(0, StartBar);
    SetIndexStyle(1, DRAW_LINE, STYLE_DOT);
    SetIndexBuffer(1, TrLevelSlow);
    SetIndexLabel(1, "Value 2");
    SetIndexDrawBegin(1, StartBar);
    SetIndexBuffer(2, AtrRsi);
    SetIndexBuffer(3, MaAtrRsi);
    SetIndexBuffer(4, Rsi);
    IndicatorShortName(StringConcatenate("QQE(", SF, ")"));
    return(0);
}


int start()
{
    int counted, i;
    double rsi0, rsi1, dar, tr, dv;

    if(Bars <= StartBar)
        return (0);

    counted = IndicatorCounted();
    if(counted < 1)
        for(i = Bars - StartBar; i < Bars; i++)
        {
            TrLevelSlow[i] = 0.0;
            AtrRsi[i] = 0.0;
            MaAtrRsi[i] = 0.0;
            Rsi[i] = 0.0;
            RsiMa[i] = 0.0;
        }

    counted = Bars - counted - 1;

    for (i = counted; i >= 0; i--)
        Rsi[i] = iRSI(NULL, 0, RSI_Period, PRICE_CLOSE, i);

    for (i = counted; i >= 0; i--)
    {
        RsiMa[i] = iMAOnArray(Rsi, 0, SF, 0, MODE_EMA, i);
        AtrRsi[i] = MathAbs(RsiMa[i + 1] - RsiMa[i]);
    }

    for (i = counted; i >= 0; i--)
        MaAtrRsi[i] = iMAOnArray(AtrRsi, 0, Wilders_Period, 0, MODE_EMA, i);

    i = counted + 1;
    tr = TrLevelSlow[i];
    rsi1 = iMAOnArray(Rsi, 0, SF, 0, MODE_EMA, i);
    while (i > 0)
    {
        i--;
        rsi0 = iMAOnArray(Rsi, 0, SF, 0, MODE_EMA, i);
        dar = iMAOnArray(MaAtrRsi, 0, Wilders_Period, 0, MODE_EMA, i) * DARFACTOR;

        dv = tr;
        if (rsi0 < tr)
        {
            tr = rsi0 + dar;
            if (rsi1 < dv)
                if (tr > dv)
                    tr = dv;
        }
        else if (rsi0 > tr)
        {
            tr = rsi0 - dar;
            if (rsi1 > dv)
                if (tr < dv)
                    tr = dv;
        }
        TrLevelSlow[i] = tr;
        rsi1 = rsi0;
    }

    return(0);
}
Comments