multisymbol_color_RSI_LQ_1.0M6
Download script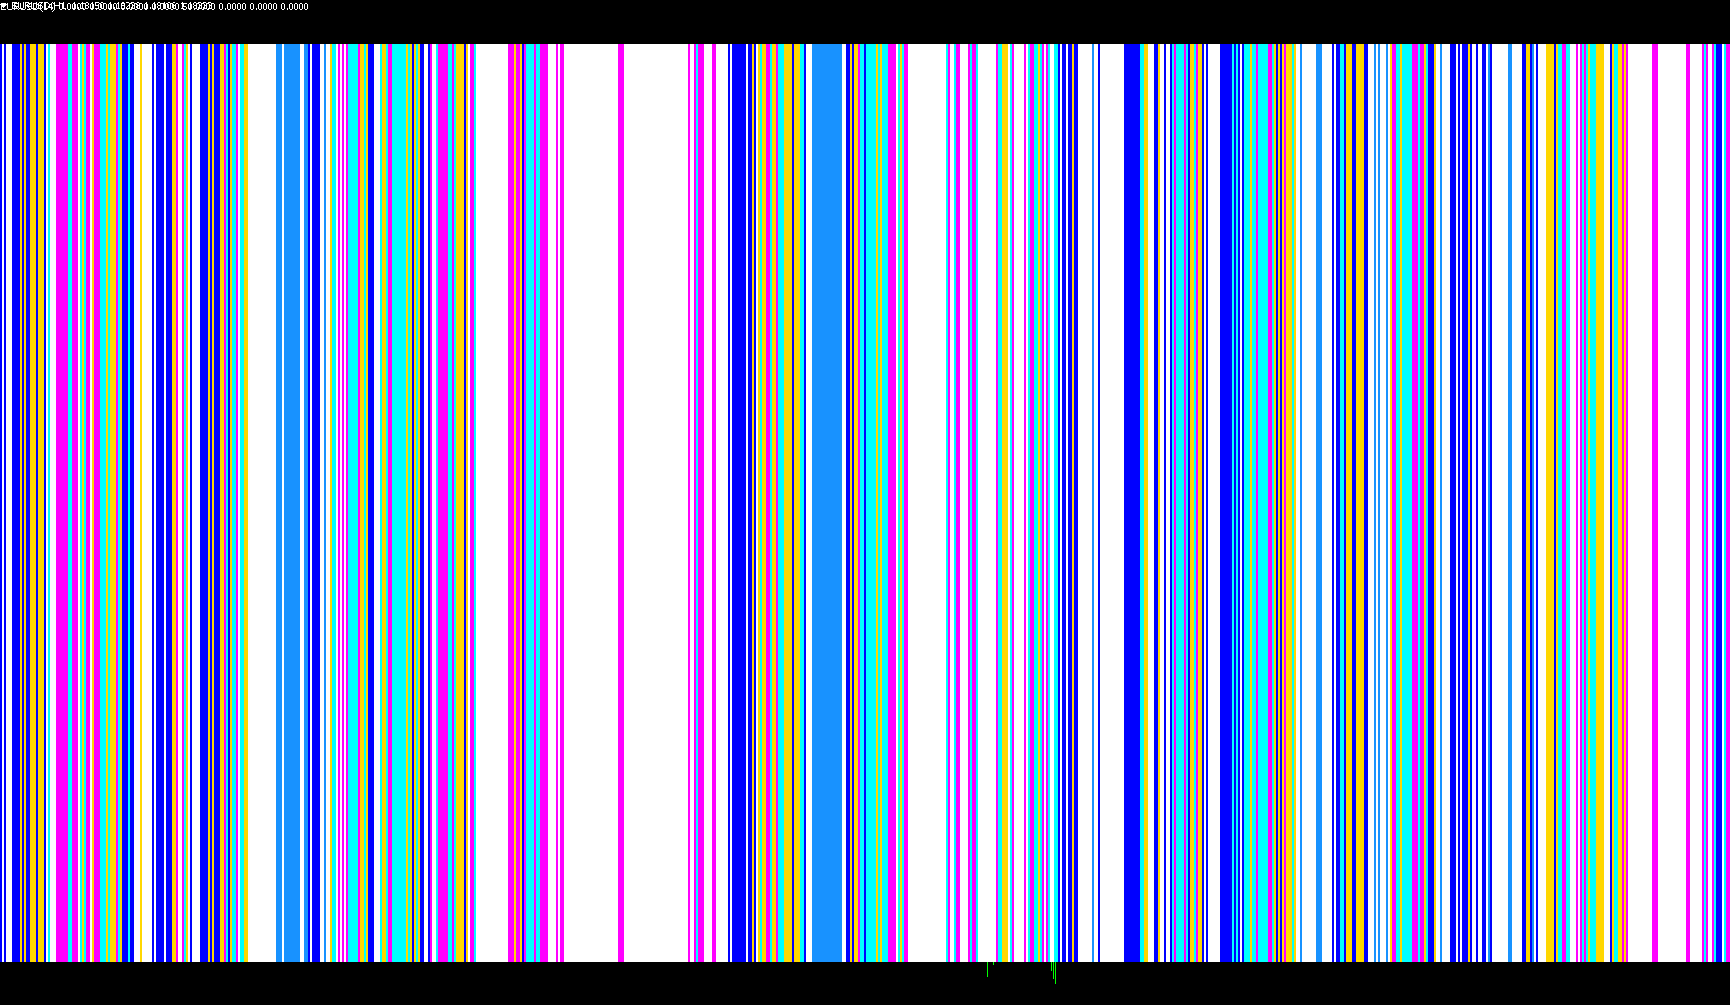
This indicator is designed to provide a visual, color-coded representation of the Relative Strength Index (RSI) for traders. Instead of showing a standard fluctuating line, it translates technical momentum into distinct visual zones, making it easier to identify whether a currency pair is in an overbought, oversold, or neutral state at a glance.
Core Functionality
The primary purpose of this tool is to categorize market sentiment based on the RSI value. It monitors a specific timeframe and period (defaulting to 14) and maps the resulting data onto a color-coded histogram. This allows users to see "strength" levels rather than just raw numbers.
Key Logic & Behavior
- Multi-Symbol Tracking: While it primarily tracks the current chart, the script is built to recognize specific currency pairs (e.g., EURUSD). It includes flexible naming conventions to accommodate different account types (like mini accounts) and ensures the data is pulled correctly from the market feed.
- Sentiment Visualization: The indicator divides the RSI spectrum into several distinct color zones:
- Green Zones: Represent bullish momentum. As the RSI rises above 50, the colors shift through various shades of green to indicate increasing strength.
- Red Zones: Represent bearish momentum. As the RSI falls below 50, the indicator shifts through different shades of red to signify decreasing strength.
- Neutral/High Strength: Specific thresholds (such as above 70 or below 30) are treated as critical levels, often appearing as distinct visual markers to warn of extreme market conditions.
- Strength Inversion: The script includes a unique feature that allows users to "invert" the strength logic. This is useful for specific trading styles where a trader might want to view the data in reverse (flipping the bull/bear signals).
- Customizable Scaling: Users can adjust a "Bar Level" setting. This doesn't change the math of the RSI itself, but rather scales how large the blocks appear in the indicator window, allowing for better visibility on different screen sizes or layouts.
User Experience
For the end-user, this tool simplifies complex momentum data into a visual "heat map." Instead of constantly checking if an RSI value is exactly at 60 or 40, the user can simply look at the color of the blocks. A shift toward darker greens or reds provides an immediate cue about where the trend is heading, while lighter colors indicate moderate movement.
//+------------------------------------------------------------------+
//|                                     multisymbol_color-RSI_1.0.mq4|
//|                                                      Lq_sunshine |
//|mod. barlevel ki                         http://www.forex-tsd.com |
//+------------------------------------------------------------------+


#property indicator_separate_window
#property indicator_buffers 8
#property indicator_color1 C'188,253,176'//white
#property indicator_color2 C'140,240,130'
#property indicator_color3 C'73,204,70'
#property indicator_color4 C'23,139,23'  //green
#property indicator_color5 C'255,185,185'
#property indicator_color6 C'255,115,115'
#property indicator_color7 C'255,76,76'
#property indicator_color8 C'255,32,32'   //red
#property indicator_maximum 77
#property indicator_minimum 1


extern int    Periode=14;
extern bool   invert_strength =  0;
extern string CurrencyPair    = "";
extern string NOTE_1  = "enter currencypair in uppercase";
extern string _____   = "like EURUSD";
extern string ______  = "leave empty for current symbol";
extern string NOTE_2  = "if you have a mini account";
extern string _______ = "add a \"m\"  e.g EURUSDm ";
extern bool  lablesOn = true;
extern int   BarLevel= 10;

//---- buffers
   double     ExtBuffer0[];
   double     ExtBuffer1[];
   double     ExtBuffer2[];
   double     ExtBuffer3[];
   double     ExtBuffer4[];
   double     ExtBuffer5[];
   double     ExtBuffer6[];
   double     ExtBuffer7[];
   double     ExtBuffer8[];


//+------------------------------------------------------------------+
//+------------------------------------------------------------------+
int init()
{
   SetIndexBuffer(0,ExtBuffer0);
   SetIndexBuffer(1,ExtBuffer1);
   SetIndexBuffer(2,ExtBuffer2);
   SetIndexBuffer(3,ExtBuffer3);
   SetIndexBuffer(4,ExtBuffer4);
   SetIndexBuffer(5,ExtBuffer5);
   SetIndexBuffer(6,ExtBuffer6);
   SetIndexBuffer(7,ExtBuffer7);

   SetIndexStyle(0,DRAW_HISTOGRAM, EMPTY, 5);
   SetIndexStyle(1,DRAW_HISTOGRAM, EMPTY, 5);
   SetIndexStyle(2,DRAW_HISTOGRAM, EMPTY, 5);
   SetIndexStyle(3,DRAW_HISTOGRAM, EMPTY, 5);
   SetIndexStyle(4,DRAW_HISTOGRAM, EMPTY, 5);
   SetIndexStyle(5,DRAW_HISTOGRAM, EMPTY, 5);
   SetIndexStyle(6,DRAW_HISTOGRAM, EMPTY, 5);
   SetIndexStyle(7,DRAW_HISTOGRAM, EMPTY, 5);

   for (int i=0;i<indicator_buffers;i++) SetIndexLabel(i,NULL);

   if (CurrencyPair == "") CurrencyPair = Symbol();
   if (iClose(CurrencyPair,0,0) == 0)
              CurrencyPair = Symbol();
   IndicatorShortName(CurrencyPair+"("+Periode+")");
if (lablesOn)
 {
 SetIndexLabel(0,"rsi50-55"); //litegreen
 SetIndexLabel(1,"rsi55-60");
 SetIndexLabel(2,"rsi60-70");
 SetIndexLabel(3,"rsi>70");   //green
 SetIndexLabel(4,"rsi45-50"); //litered
 SetIndexLabel(5,"rsi40-45");
 SetIndexLabel(6,"rsi30-40");
 SetIndexLabel(7,"rsi<30");   //red
 }


   return(1);
}

int deinit()
  {
   return(0);
  }
//+------------------------------------------------------------------+
//+------------------------------------------------------------------+
int start()
  {


   int    counted_bars=IndicatorCounted();

//---- check for possible errors
   if (counted_bars<0) return(-1);
//---- last counted bar will be recounted
   if (counted_bars>0) counted_bars--;

   int    pos=Bars-counted_bars;


  double ddraw;

// double level[];

//---- main calculation loop
   while(pos>=0)
   {
         ddraw= iRSI(CurrencyPair,0,Periode,PRICE_CLOSE,pos);
         if (invert_strength==1)
             ddraw=ddraw-(ddraw-50)*2;             //---- Inversion of the RSI

         if(ddraw<50)           //---- RSI <= 48 draws RED blocks

             if(ddraw<50&&ddraw>45)    //---- 44< RSI  draws RED blocks
                drawblock(0,0,0,0,5,0,0,0,pos);

                  else if(ddraw<=45&&ddraw>40)  //---- 39< RSI  draws RED blocks
                          drawblock(0,0,0,0,0,5,0,0,pos);

                         else if(ddraw<=40&&ddraw>30)//---- 35< RSI  draws RED blocks
                                drawblock(0,0,0,0,0,0,5,0,pos);

                          else
                               drawblock(0,0,0,0,0,0,0,5,pos);


          else if(ddraw>=50)     //---- RSI >= 52 draws green blocks

               if(ddraw>=50&&ddraw<55)//---- RSI >= 52 <56 draws green blocks
                  drawblock(5,0,0,0,0,0,0,0,pos);

              else if(ddraw>=55&&ddraw<60)//---- RSI >= 56 <60 draws green blocks
                      drawblock(0,5,0,0,0,0,0,0,pos);

                  else if(ddraw>=60&&ddraw<70)//---- 60>RSI<70 draws green blocks
                         drawblock(0,0,5,0,0,0,0,0,pos);

             else
              drawblock(0,0,0,5,0,0,0,0,pos);     //---- draw white block if there chart is ranging
//


         pos--;
   }


//----
   return(0);
  }

void drawblock(int a,int b,int c,int d,int e,int f,int g,int h,int pos)

{

               ExtBuffer0[pos]=a*BarLevel;
               ExtBuffer1[pos]=b*BarLevel;
               ExtBuffer2[pos]=c*BarLevel;
               ExtBuffer3[pos]=d*BarLevel;
               ExtBuffer4[pos]=e*BarLevel;
               ExtBuffer5[pos]=f*BarLevel;
               ExtBuffer6[pos]=g*BarLevel;
               ExtBuffer7[pos]=h*BarLevel;


}
Comments