R2_Arrows_v4c
Download script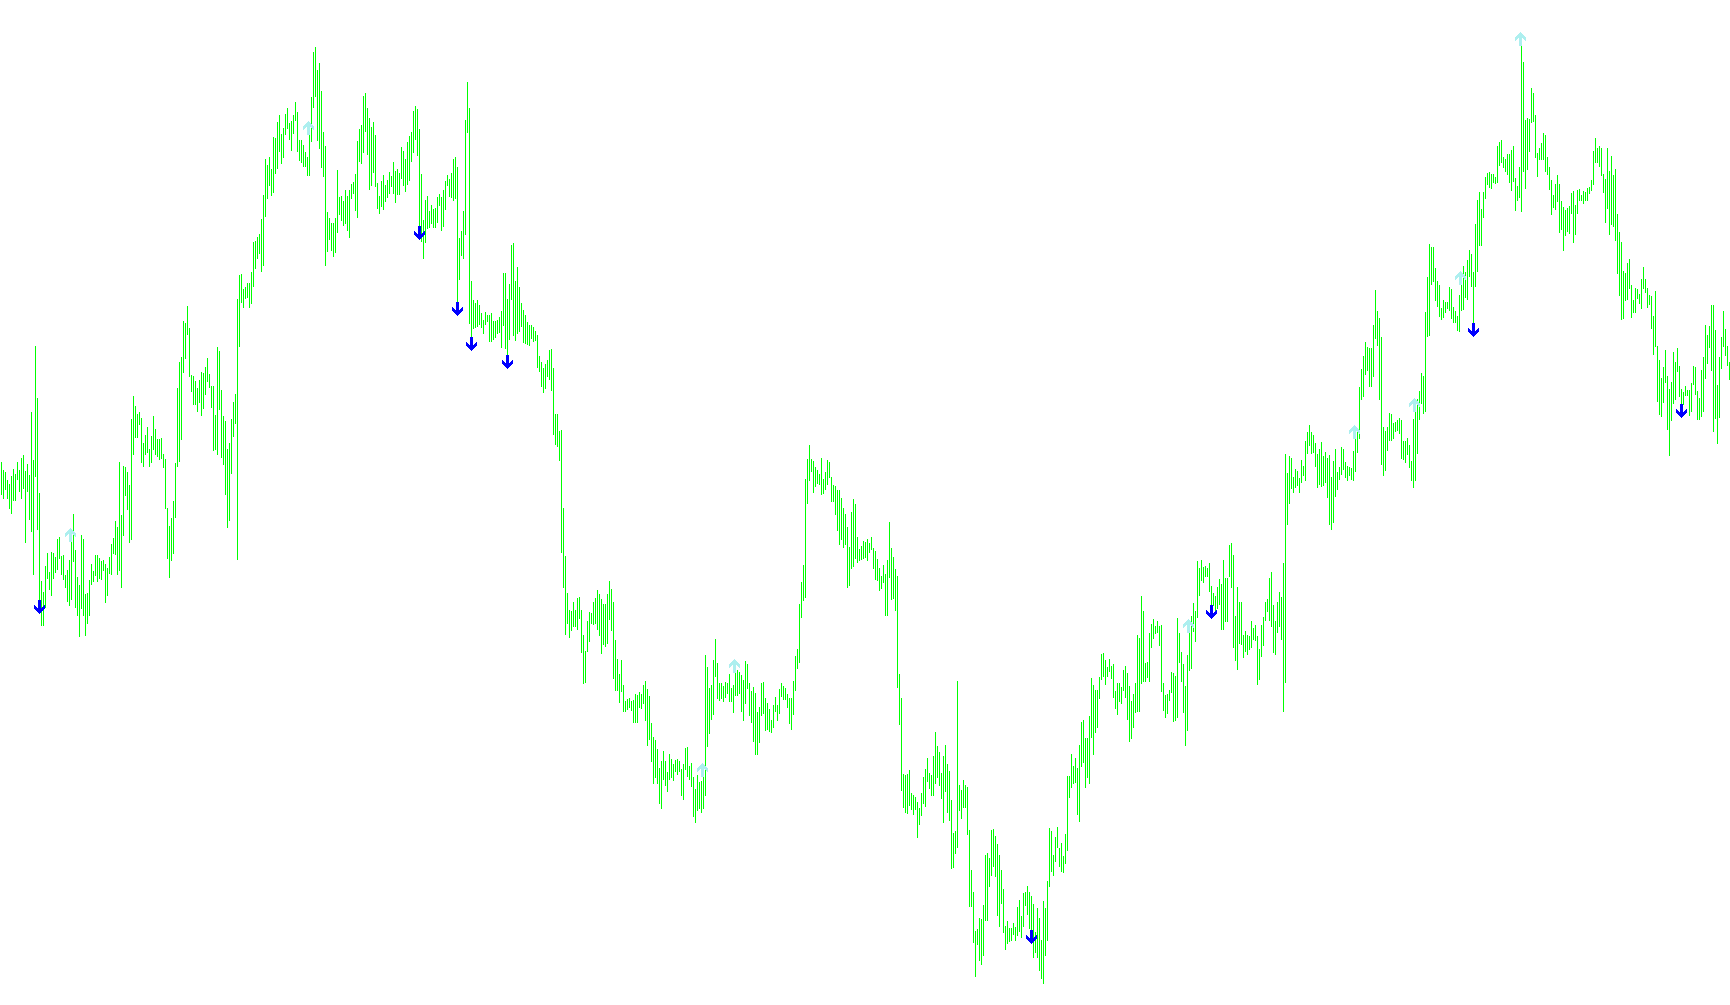
This technical indicator is designed to identify potential entry points in the financial markets by analyzing price trends and momentum through a multi-layered verification process. Instead of relying on a single signal, the script evaluates a sequence of conditions involving Moving Averages, Relative Strength Index (RSI) levels, and Stochastic oscillators to confirm high-probability trade setups.
Core Logic Overview
The tool operates by scanning historical price data to identify specific patterns where momentum is shifting in a consistent direction. It uses three primary components to filter its signals:
1. Trend Identification The script utilizes a Moving Average (MA) as the foundational baseline. While the current logic is set to automatically acknowledge the price action relative to this average, it provides the framework for ensuring that trades are taken in harmony with the broader market trend.
2. Momentum Tracking (RSI Sequence) The most detailed part of the script's logic involves monitoring a three-day sequence of the Relative Strength Index (RSI). Rather than looking at a single "overbought" or "oversold" reading, it looks for a specific progression:
- For Buy Signals: It verifies that the RSI values over three consecutive periods are consistently decreasing and remain below a specific threshold. This suggests a period of cooling off or "resetting" before a potential upward move.
- For Sell Signals: It verifies that the RSI values over three consecutive periods are consistently increasing and stay above a specific threshold, suggesting a buildup of pressure before a potential downward move.
3. Stochastic Confirmation To act as a final filter, the script incorporates a Stochastic Oscillator. This ensures that the trade is only signaled when momentum is in a favorable zone (e.g., checking if the oscillator is above or below the 50-level midpoint), helping to avoid entering trades during stagnant market conditions.
Visual Output
When all of the following conditions are met simultaneously, the script places visual markers directly on your chart:
- Buy Arrows: These appear when the RSI sequence shows a controlled downward trend under the limit and the Stochastic oscillator confirms positive momentum.
- Sell Arrows: These appear when the RSI sequence shows a controlled upward trend over the limit and the Stochastic oscillator confirms negative momentum.
In summary, this tool is designed for traders who prefer "confluence" trading—waiting for multiple technical indicators to agree on a direction before signaling an entry, rather than reacting impulsively to a single price movement.
//+------------------------------------------------------------------+
//|                                                R2_Arrows_v4a.mq4 |
//|           Copyright © 2007 , transport_david , David W Honeywell |
//|                                     hellonwheels.trans@gmail.com |
//+------------------------------------------------------------------+

#property copyright "Copyright © 2007 , transport_david , David W Honeywell"
#property link      "hellonwheels.trans@gmail.com"

#property indicator_chart_window

#property indicator_buffers 3

#property indicator_color1 DeepSkyBlue
#property indicator_color2 Red
#property indicator_color3 LawnGreen


extern string s1 = "---------------";
extern int    Ma_Periods          =     200;  // 200 day
extern int    Ma_Method           =       0;  // SMA
extern int    Ma_Applied_Price    =       1;  // Open

extern string s2 = "---------------";
extern int    RsiPeriods          =       2;  // 2 period
extern int    Rsi_Applied_Price   =       1;  // Open

extern string s3 = "---------------";
extern int    BuyIfDay1RsiBelow   =      65; // 1st day of tracking must be < this setting
extern int    BuyIfDay3RsiBelow   =      65; // 3rd day must be < this setting

extern string s4 = "---------------";
extern int    SellIfDay1RsiAbove  =      35; // 1st day of tracking must be > this setting
extern int    SellIfDay3RsiAbove  =      35; // 3rd day must be > this setting

extern string s5 = "---------------";
extern int    ShowBars            =   1000;

double MA[];
double Sell_Arrow[];
double Buy_Arrow[];
double Close_Trade_Marker[];

double bartime;


//+-------------+
//| Init        |
//+-------------+
int init()
  {
   IndicatorBuffers(5);

   SetIndexStyle(0,DRAW_LINE,STYLE_SOLID,2);
   SetIndexEmptyValue(0,0.0);
   SetIndexBuffer(0,MA);
   SetIndexLabel(0,"Trend_Ma_Periods ( "+Ma_Periods+" )");

   SetIndexEmptyValue(1,0.0);
   SetIndexStyle(1,DRAW_ARROW,STYLE_SOLID,1);
   SetIndexArrow(1,234);
   SetIndexBuffer(1,Sell_Arrow);
   SetIndexLabel(1,"Sell_Arrow ( RsiPeriods "+RsiPeriods+" )");

   SetIndexEmptyValue(2,0.0);
   SetIndexStyle(2,DRAW_ARROW,STYLE_SOLID,1);
   SetIndexArrow(2,233);
   SetIndexBuffer(2,Buy_Arrow);
   SetIndexLabel(2,"Buy_Arrow ( RsiPeriods "+RsiPeriods+" )");

   Print("Init complete");
  }


//+-------------+
//| De-init     |
//+-------------+
int deinit()
  {
   Print("De-init complete");
  }

//+-------------+
//| Start       |
//+-------------+
int start()
  {

   double    Today;
   double    Day1;
   double    Day2;
   double    Day3;
   double    sto;

   bool      C1, C2, C3, C4, C5, C6;

   int       shift;

   // bar counting
   if(bartime==Time[0]) return(0);
   bartime=Time[0];

   for ( shift = ShowBars; shift >= 0; shift-- )
     {

      //MA[shift] = iMA( Symbol(), 0, Ma_Periods, 0, Ma_Method, Ma_Applied_Price, shift);

      Day1  = iRSI(Symbol(),0,RsiPeriods,Rsi_Applied_Price,shift+3);
      Day2  = iRSI(Symbol(),0,RsiPeriods,Rsi_Applied_Price,shift+2);
      Day3  = iRSI(Symbol(),0,RsiPeriods,Rsi_Applied_Price,shift+1);
      Today = iRSI(Symbol(),0,RsiPeriods,Rsi_Applied_Price,shift);
      sto   = iStochastic(Symbol(),0,5,3,3,MODE_SMA,1,MODE_MAIN,shift);

      //- Buy Arrows ---
      C1=false;
      C2=false;
      C3=false;
      C4=false;
      C5=false;
      C6=false;
      C1=true; //if(iOpen(Symbol(),0,shift+1) > MA[shift+1]) C1=true;
      if(Day1 < BuyIfDay1RsiBelow)                C2=true;
      if(Day2 < Day1)                             C3=true;
      if(Day3 < Day2)                             C4=true;
      if(Day3 < BuyIfDay3RsiBelow)                C5=true;
      if(sto  > 50)                               C6=true;
      if(C1&&C2&&C3&&C4&&C5&&C6) Buy_Arrow[shift] = iHigh(Symbol(),0,shift) + (20*Point); // Low arrow Buy

      //- Sell Arrows ---
      C1=false;
      C2=false;
      C3=false;
      C4=false;
      C5=false;
      C6=false;
      C1=true;//if(iOpen(Symbol(),0,shift+1) < MA[shift+1]) C1=true;
      if(Day1 > SellIfDay1RsiAbove)               C2=true;
      if(Day2 > Day1)                             C3=true;
      if(Day3 > Day2)                             C4=true;
      if(Day3 > SellIfDay3RsiAbove)               C5=true;
      if(sto  < 50)                               C6=true;
      if(C1&&C2&&C3&&C4&&C5&&C6) Sell_Arrow[shift] = iLow(Symbol(),0,shift) - (20*Point); // High arrow Sell

     }//for

  }//start
Comments