QQE with Alerts
Download script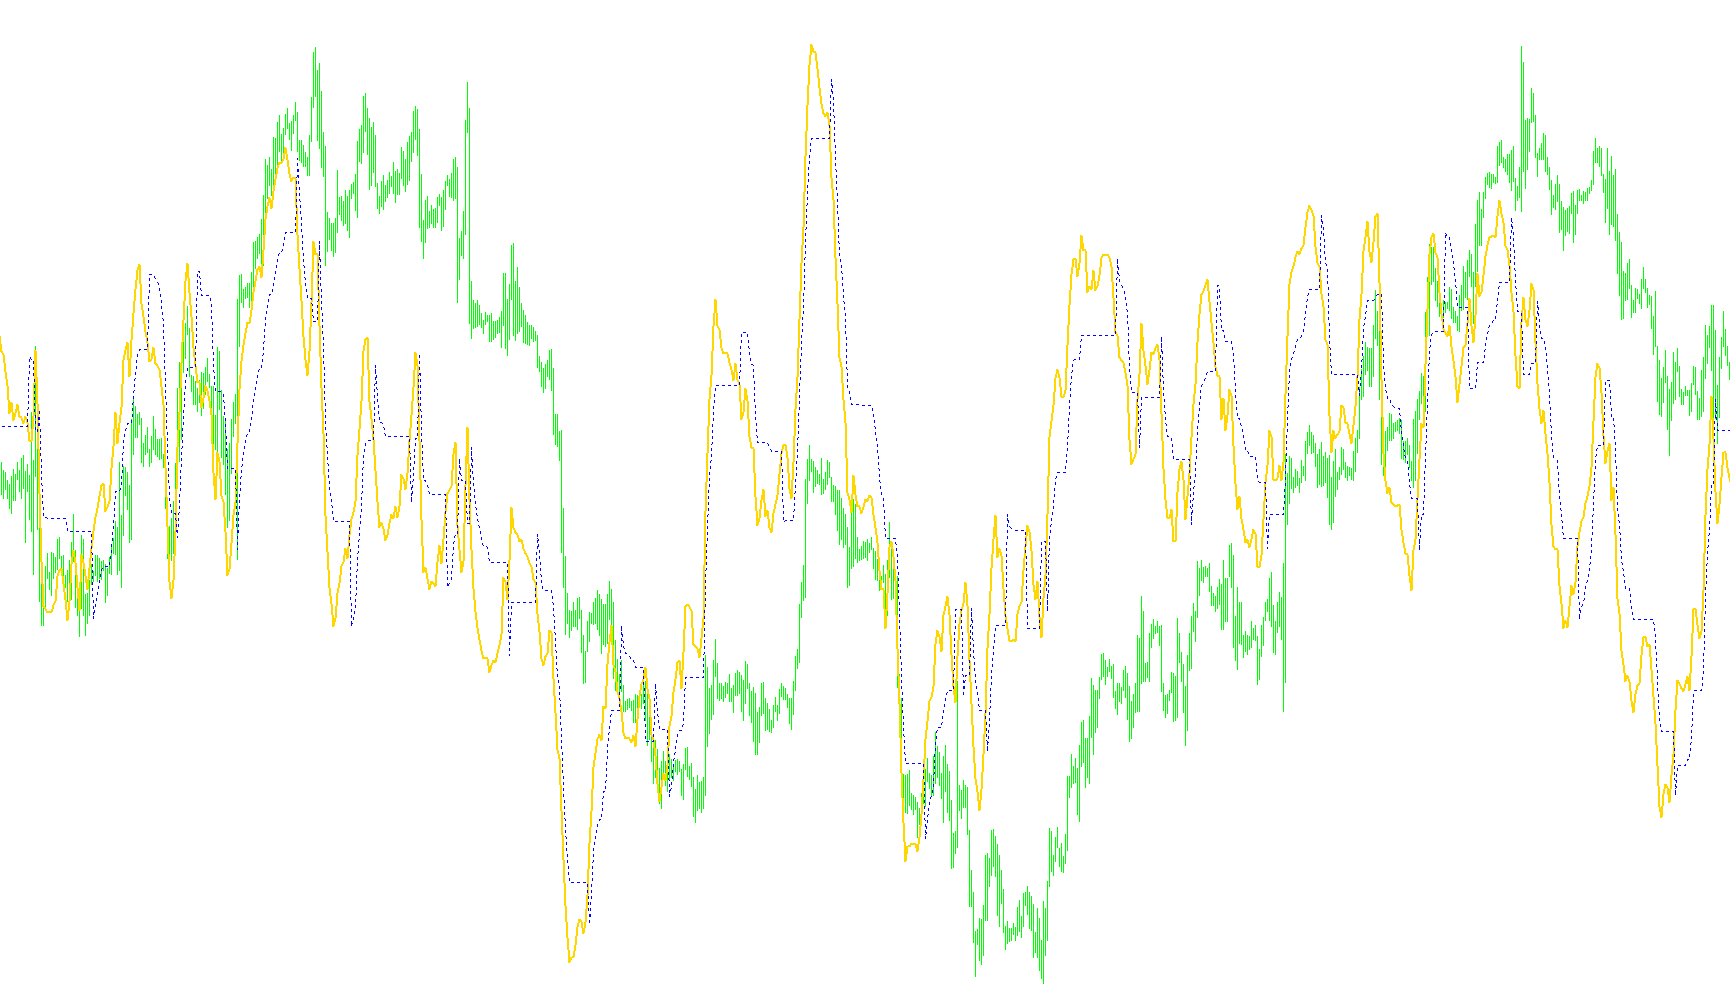
The Qualitative Quantitative Estimation (QQE) indicator is a sophisticated analytical tool designed to help traders identify trend direction and potential momentum shifts by combining several different mathematical perspectives into a single visual output.
Instead of relying on just one type of market data, this script synthesizes three distinct layers of information to produce a more reliable signal:
Core Analytical Components
- Momentum Tracking: The foundation of the logic begins with a standard Relative Strength Index (RSI). This measures how quickly an asset's price is changing. However, rather than showing the raw RSI, the script applies a "smoothed" average to it to filter out minor market noise and focus on the primary trend.
- Volatility Smoothing: The indicator calculates the difference between consecutive smoothed values. By measuring these fluctuations, the logic determines the current "volatility" of the price movement. This helps distinguish between a steady, healthy trend and erratic, unstable price action.
- Dynamic Range Adjustment: To make the indicator responsive to different market conditions, the script uses a specialized moving average of the volatility data. It applies a specific multiplier (the 4.236 factor) to this data, creating a "dynamic range" that expands or contracts based on how much the market is currently moving.
The Logic Flow
The script processes these components in a sequential loop:
- Trend Identification: It looks at the current smoothed momentum and compares it against a calculated "threshold."
- Adaptive Reaction: If the momentum breaks above or below this threshold, the indicator adjusts its internal limits based on the dynamic range. This allows the signal to "stretch" during high-volatility periods and "tighten" during low-volatility periods.
- Visual Representation: The final result is displayed as a line that follows the price trend. A key horizontal level (usually set at 50) serves as the primary equilibrium point; when the indicator crosses above or below this line, it signals a potential shift in market sentiment.
Notification System
To ensure traders do not have to watch the charts constantly, the script includes an integrated alert system. It monitors for "Crosses"—specific moments where the smoothed momentum line moves from one side of the defined alert level (e.g., 50) to the other. When this occurs, the script can trigger three types of notifications:
- Visual/Popup: An on-screen message box notifying the user immediately.
- Audio: A sound file playback to grab the user's attention.
- Email: A direct transmission to a linked email account (if configured), providing a record of the trend shift even when the trading platform is closed.
//+------------------------------------------------------------------+
//|   Qualitative Quantitative Estimation Indicator with Alerts      |
//|                                   Copyright © 2006 Roman Ignatov |
//|                                  mailto:roman.ignatov@gmail.com  |
//|                                                                  |
//| V1.   Completed by Roman Ignatov 2006 (roman.ignatov@gmail.com)  |
//| V2.   Completed by Tim Hyder 2008                                |
//|               a)   Complete Code rewrite                         |
//|               b)   Added Audio, Visual and eMail alerts          |
//|                                                                  |
//|   Copyright © 2008, Tim Hyder aka Hiachiever                     |
//|                                                                  |
//|   PO BOX 768, Hillarys, Western Australia, Australia, 6923       |
//|                                                                  |
//|   GIFTS AND DONATIONS ACCEPTED                                   |
//|   All my indicators should be considered donationware. That is   |
//|   you are free to use them for your personal use, and are        |
//|   under no obligation to pay for them. However, if you do find   |
//|   this or any of my other indicators help you with your trading  |
//|   then any Gift or Donation as a show of appreciation is         |
//|   gratefully accepted.                                           |
//|                                                                  |
//|   Gifts or Donations also keep me motivated in producing more    |
//|   great free indicators. :-)                                     |
//|                                                                  |
//|   PayPal - hiachiever@gmail.com                                  |
//+------------------------------------------------------------------+
#property copyright "Copyright © 2008 Tim Hyder"
#property link      "mailto:hiachiever@gmail.com"
//----
#define vers    "09.Feb.2008"
#define major   1
#define minor   0
//----
#property indicator_separate_window
#property indicator_buffers 2
#property indicator_color1 DodgerBlue
#property indicator_style1 STYLE_SOLID
#property indicator_width1 2
#property indicator_color2 Yellow
#property indicator_style2 STYLE_DOT
#property indicator_level1 50
#property indicator_levelcolor Aqua
#property indicator_levelstyle STYLE_DOT
//----
extern string NOTESETTINGS=" --- INDICATOR SETTINGS ---";
extern int SF=5;
extern string NOTEALERTS=" --- Alerts ---";
extern int AlertLevel=50;
extern bool MsgAlerts=true;
extern bool SoundAlerts=true;
extern string SoundAlertFile="alert.wav";
extern bool eMailAlerts=false;
//----
int RSI_Period=14;
int Wilders_Period;
int StartBar, LastAlertBar;
datetime LastAlertTime;
double TrLevelSlow[];
double AtrRsi[];
double MaAtrRsi[];
double Rsi[];
double RsiMa[];
//+------------------------------------------------------------------+
//|                                                                  |
//+------------------------------------------------------------------+
int init()
  {
   Wilders_Period=RSI_Period * 2 - 1;
   if (Wilders_Period < SF)
      StartBar=SF;
   else
      StartBar=Wilders_Period;
//----
   IndicatorBuffers(6);
   SetIndexBuffer(0, RsiMa);
   SetIndexStyle(0, DRAW_LINE, STYLE_SOLID, 2);
   SetIndexLabel(0, "Value 1");
   SetIndexDrawBegin(0, StartBar);
   SetIndexStyle(1, DRAW_LINE, STYLE_DOT);
   SetIndexBuffer(1, TrLevelSlow);
   SetIndexLabel(1, "Value 2");
   SetIndexDrawBegin(1, StartBar);
   SetIndexBuffer(2, AtrRsi);
   SetIndexBuffer(3, MaAtrRsi);
   SetIndexBuffer(4, Rsi);
   IndicatorShortName(StringConcatenate("QQE(", SF, ")"));
//----
   LastAlertBar=Bars-1;
   return(0);
  }
//+------------------------------------------------------------------+
//|                                                                  |
//+------------------------------------------------------------------+
int start()
  {
   int counted, i;
   double rsi0, rsi1, dar, tr, dv;
//----
   if(Bars<=StartBar)
      return(0);
//----
   counted=IndicatorCounted();
   if(counted < 1)
      for(i=Bars - StartBar; i < Bars; i++)
        {
         TrLevelSlow[i]=0.0;
         AtrRsi[i]=0.0;
         MaAtrRsi[i]=0.0;
         Rsi[i]=0.0;
         RsiMa[i]=0.0;
        }
   counted=Bars - counted - 1;
//----
   for(i=counted; i>=0; i--)
      Rsi[i]=iRSI(NULL, 0, RSI_Period, PRICE_CLOSE, i);
   for(i=counted; i>=0; i--)
     {
      RsiMa[i]=iMAOnArray(Rsi, 0, SF, 0, MODE_EMA, i);
      AtrRsi[i]=MathAbs(RsiMa[i + 1] - RsiMa[i]);
     }
   for(i=counted; i>=0; i--)
      MaAtrRsi[i]=iMAOnArray(AtrRsi, 0, Wilders_Period, 0, MODE_EMA, i);
//----
   i=counted + 1;
   tr=TrLevelSlow[i];
   rsi1=iMAOnArray(Rsi, 0, SF, 0, MODE_EMA, i);
   while(i > 0)
     {
      i--;
      rsi0=iMAOnArray(Rsi, 0, SF, 0, MODE_EMA, i);
      dar=iMAOnArray(MaAtrRsi, 0, Wilders_Period, 0, MODE_EMA, i) * 4.236;
      dv=tr;
      if (rsi0 < tr)
        {
         tr=rsi0 + dar;
         if (rsi1 < dv)
            if (tr > dv)
               tr=dv;
        }
      else if (rsi0 > tr)
           {
            tr=rsi0 - dar;
            if (rsi1 > dv)
               if (tr < dv)
                  tr=dv;
           }
      TrLevelSlow[i]=tr;
      rsi1=rsi0;
     }
   if ((RsiMa[i+1]<AlertLevel && RsiMa[i]>AlertLevel) ||(RsiMa[i+1]>AlertLevel && RsiMa[i]<AlertLevel) )
     {
      string base=Symbol()+ ", TF: " + TF2Str(Period());
      string Subj=base + ", " + AlertLevel + " level Cross Up";
      if (RsiMa[i+1]>AlertLevel && RsiMa[i]<AlertLevel) Subj=base + " " +  AlertLevel + " level Cross Down";
      string Msg=Subj + " @ " + TimeToStr(TimeLocal(),TIME_SECONDS);
      if (Bars>LastAlertBar)
        {
         LastAlertBar=Bars;
         DoAlerts(Msg,Subj);
        }
     }
//----
   return(0);
  }
//+------------------------------------------------------------------+
//|                                                                  |
//+------------------------------------------------------------------+
void DoAlerts(string msgText,string eMailSub)
  {
   if (MsgAlerts) Alert(msgText);
   if (SoundAlerts)  PlaySound(SoundAlertFile);
   if (eMailAlerts) SendMail(eMailSub, msgText);
  }
//+------------------------------------------------------------------+
//|                                                                  |
//+------------------------------------------------------------------+
string TF2Str(int period)
  {
   switch(period)
     {
      case PERIOD_M1: return("M1");
      case PERIOD_M5: return("M5");
      case PERIOD_M15: return("M15");
      case PERIOD_M30: return("M30");
      case PERIOD_H1: return("H1");
      case PERIOD_H4: return("H4");
      case PERIOD_D1: return("D1");
      case PERIOD_W1: return("W1");
      case PERIOD_MN1: return("MN");
     }
   return(Period());
  }
//+------------------------------------------------------------------+
Comments