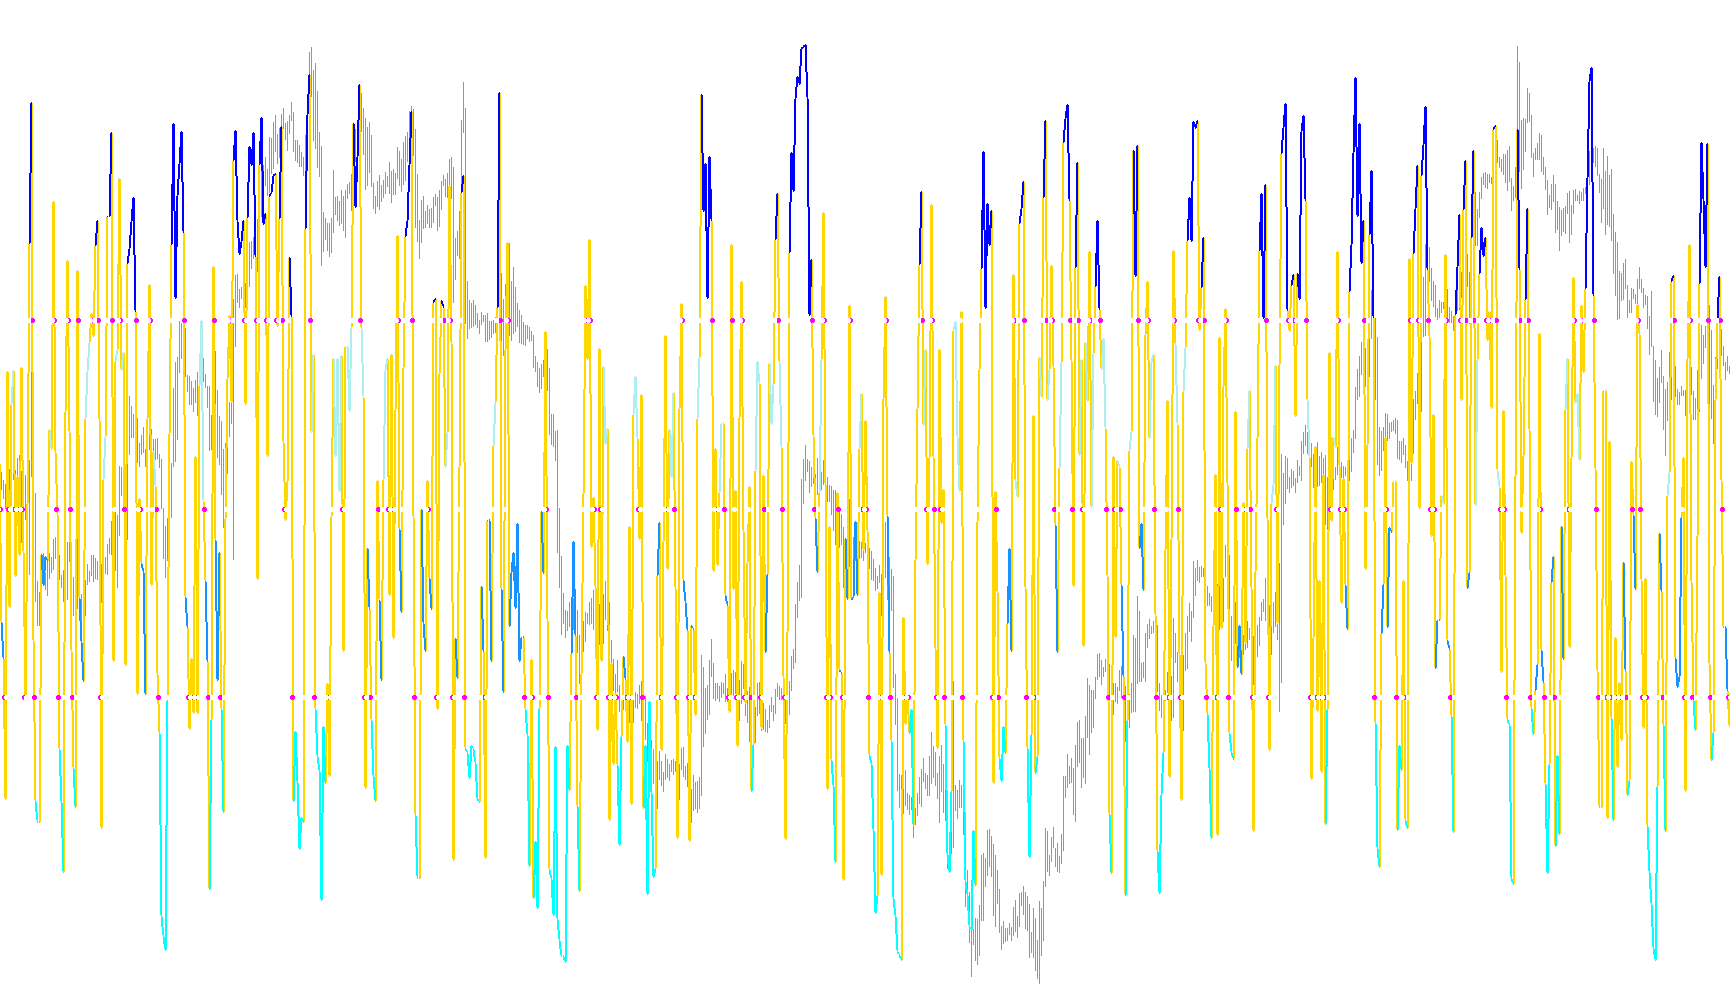
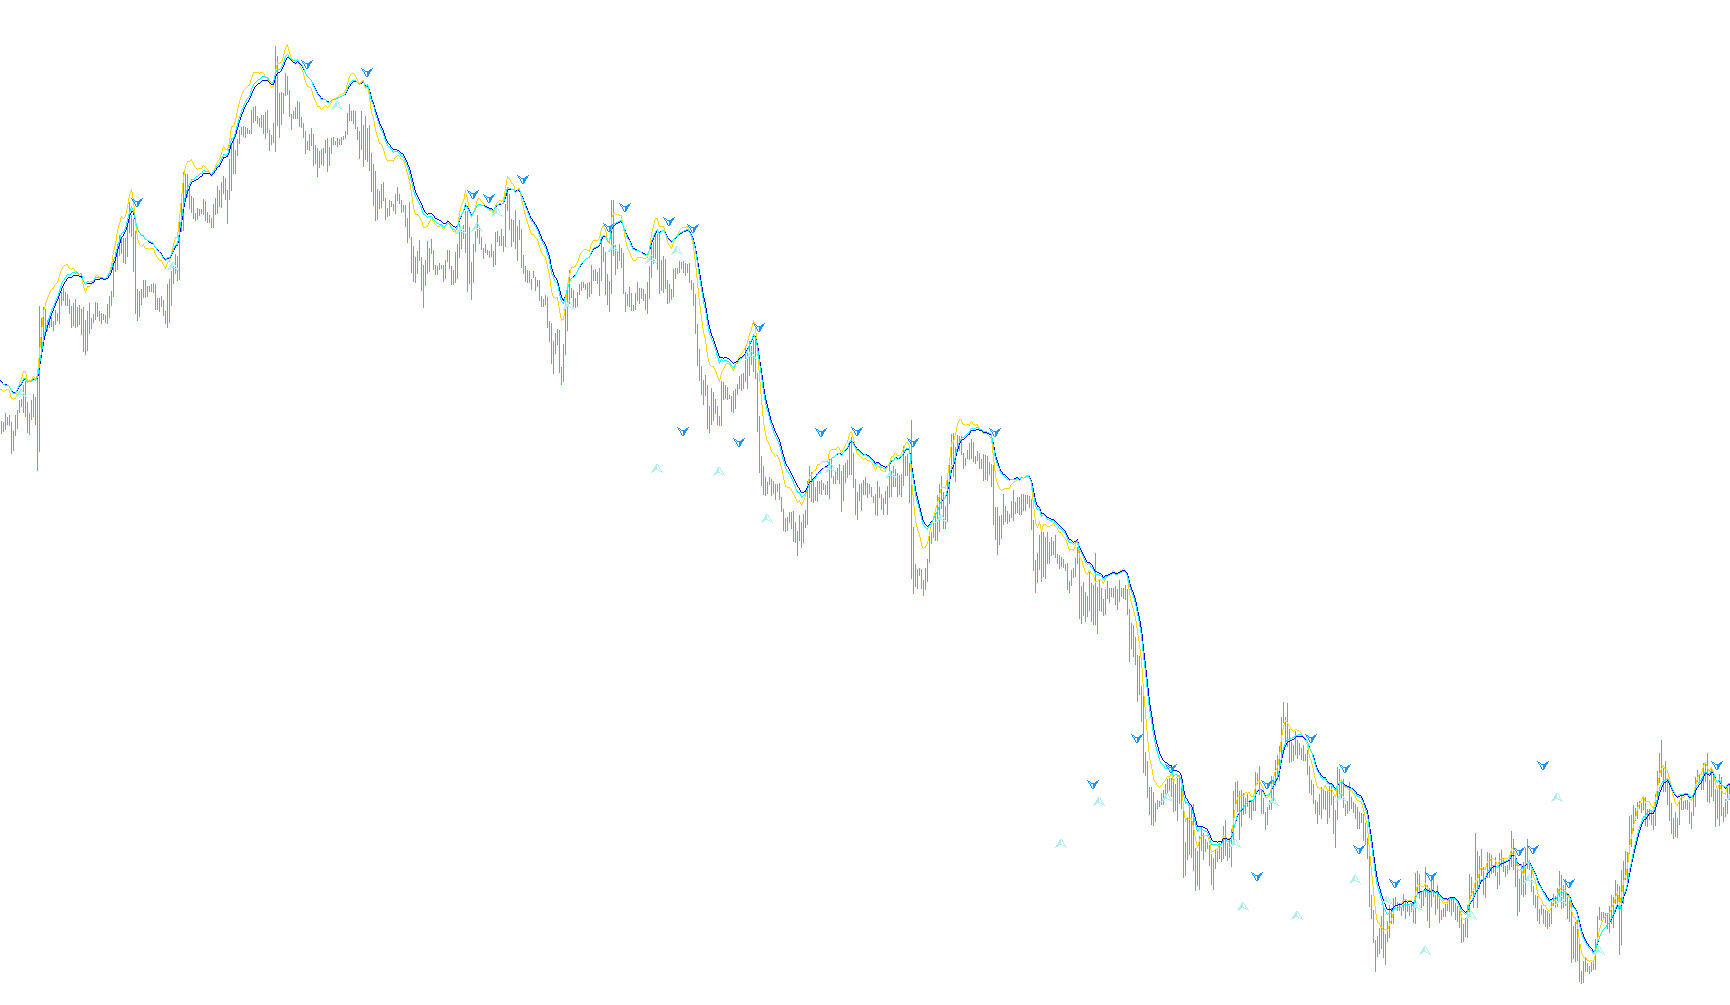
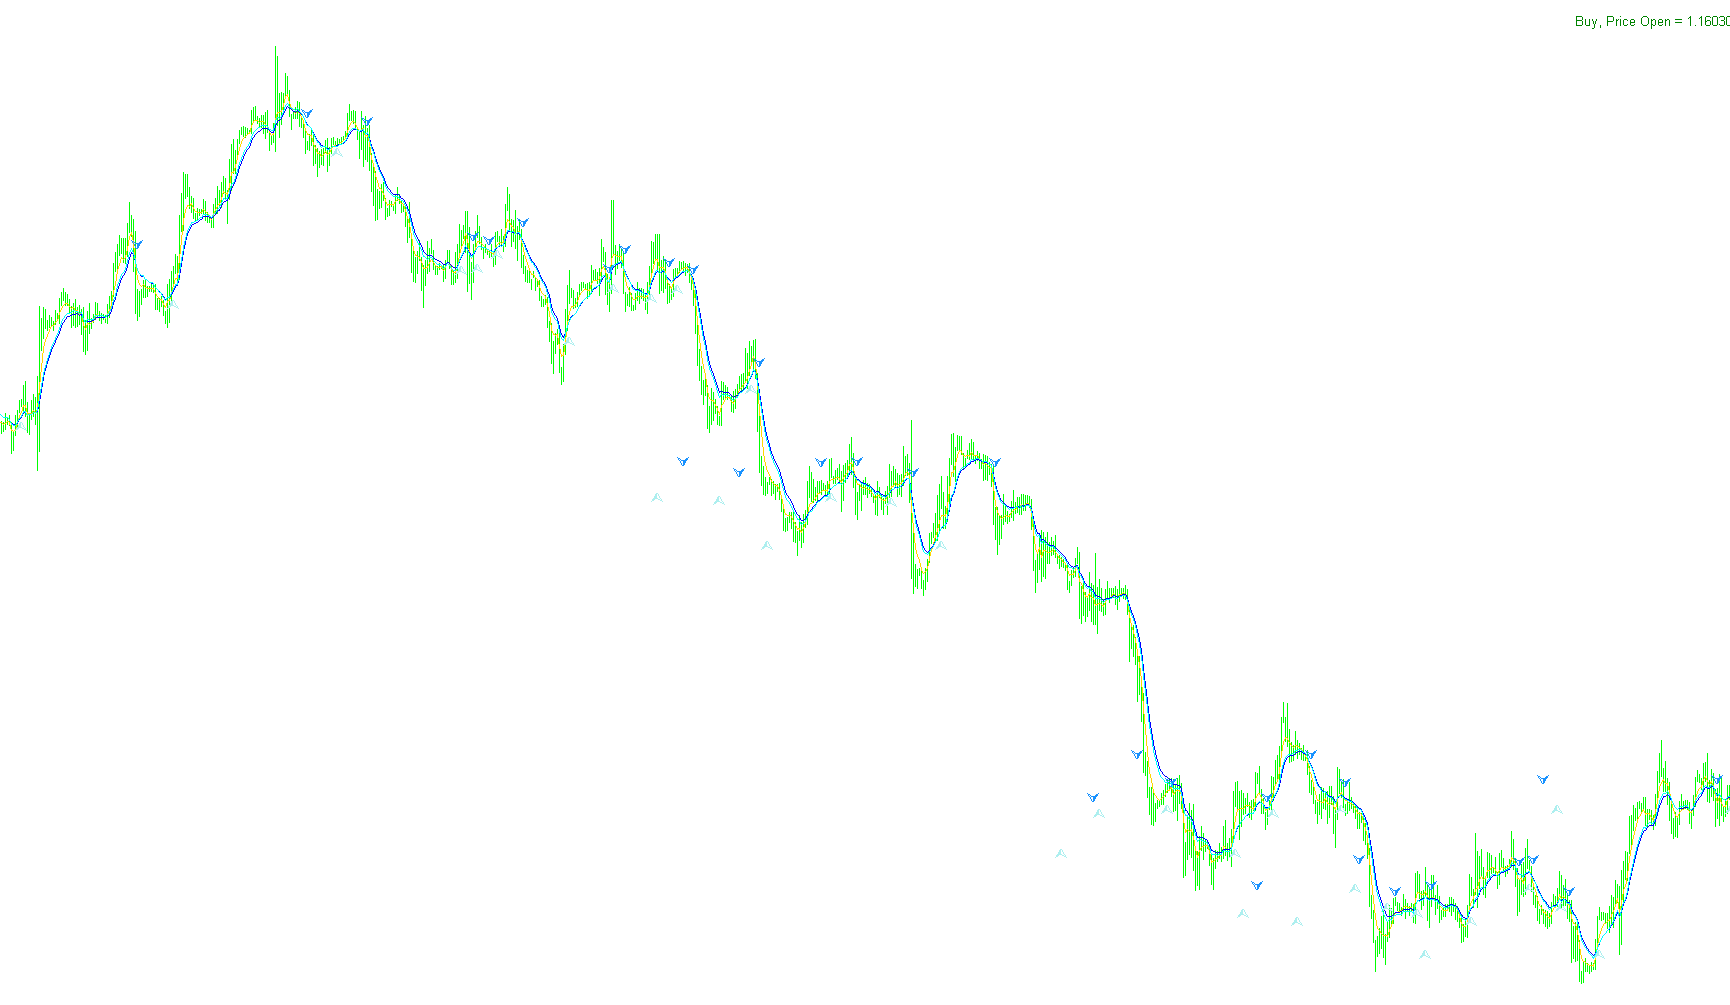
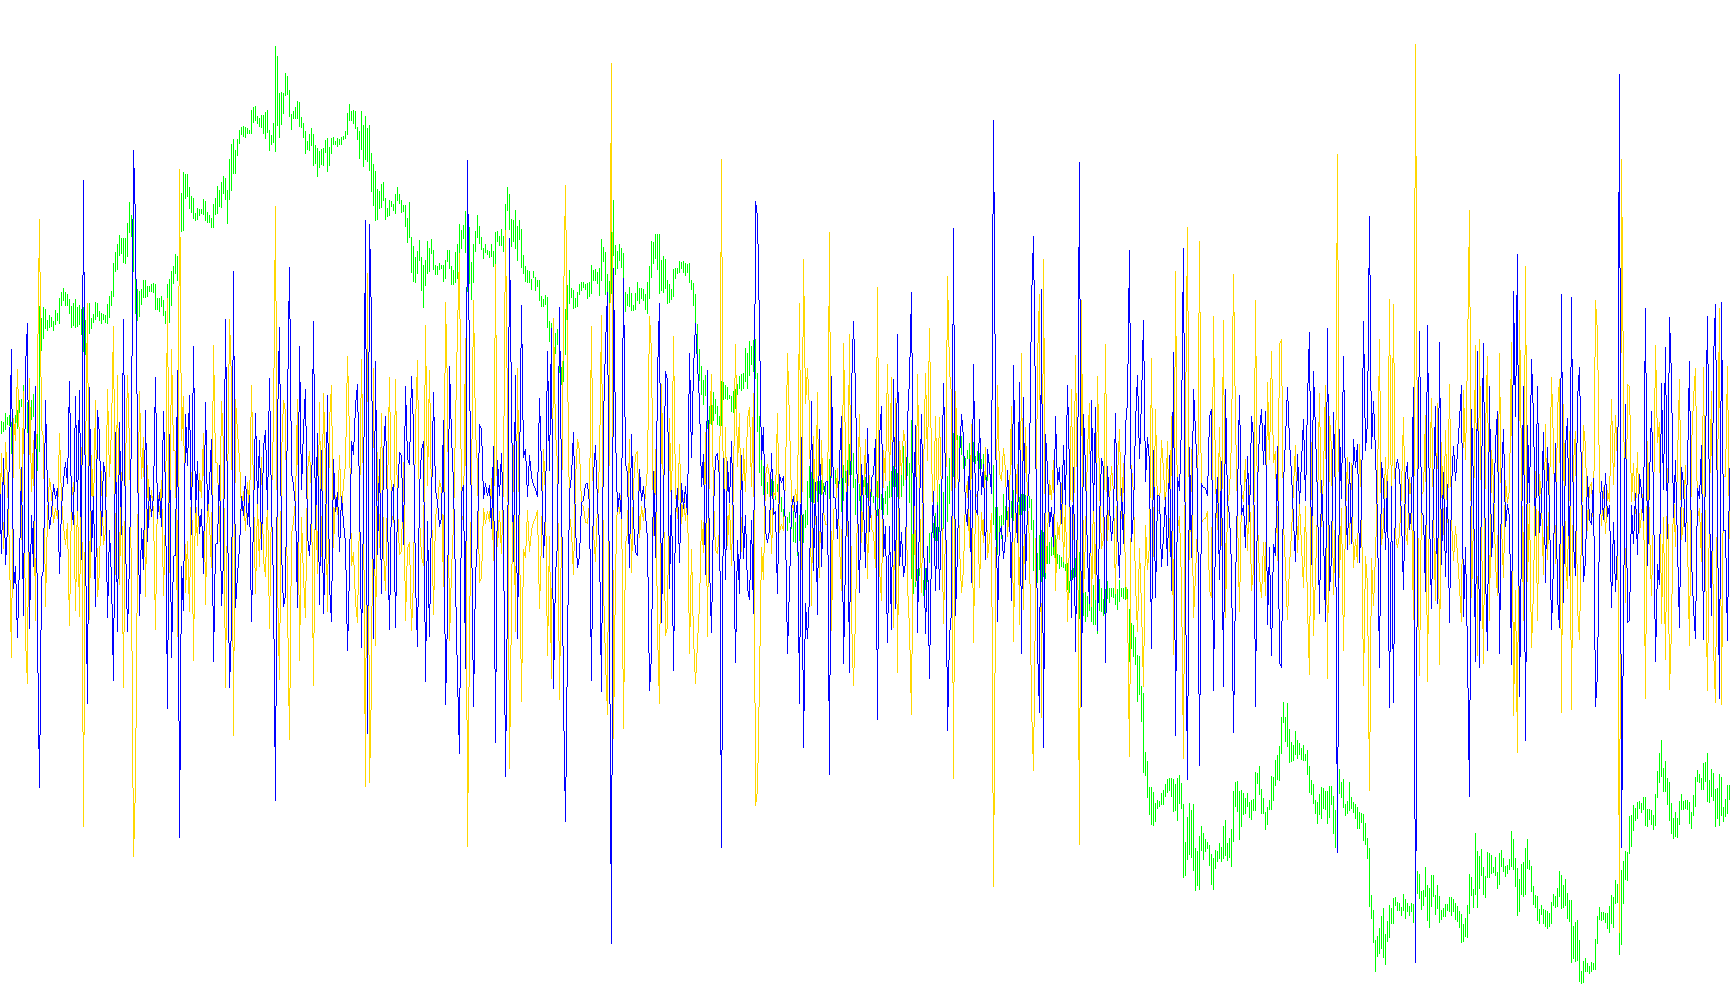
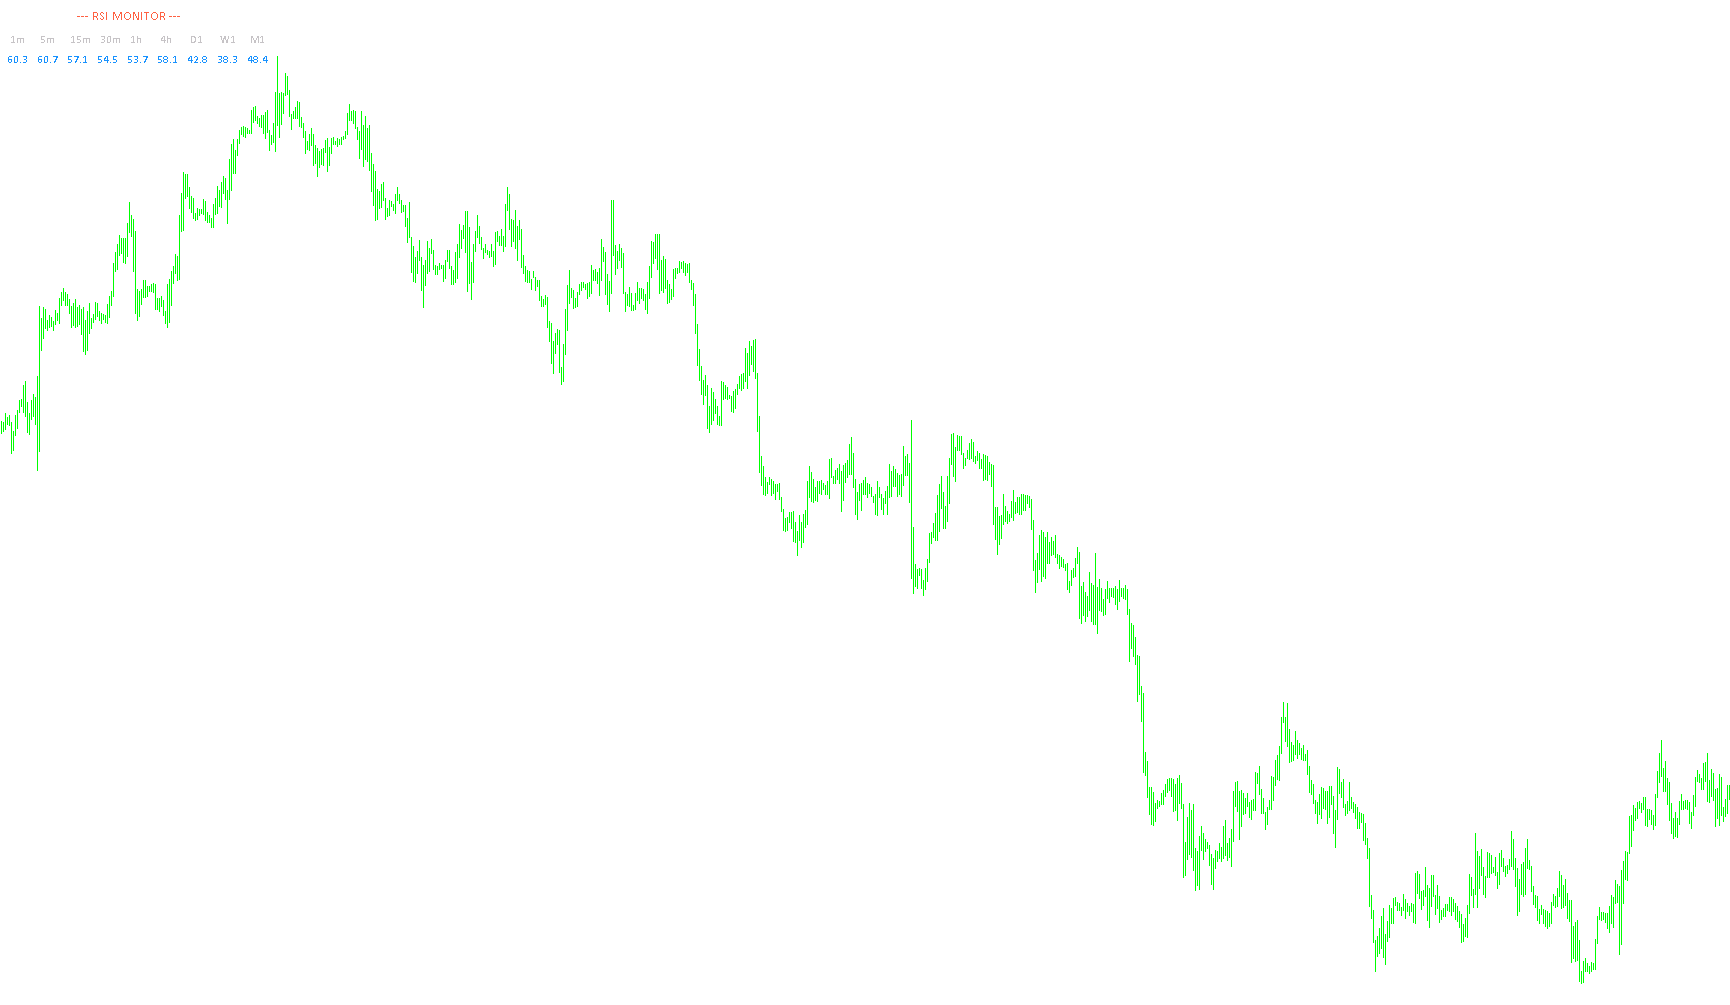
RSI_Cross_Alert_Stoch
Indicator

RSI_Cross_Alert_Stoch

iMAOnArrayiRSIiStochastic
RSI_Del_WA__mtf
Indicator

RSI_Del_WA__mtf

iMAOnArrayiRSI

This indicator calculates the mathematical difference between two Relative Strength Index periods and applies a Simple Moving Average to visualize momentum velocity across multiple timeframes.
RSI_DeMarker_Super_Position
Indicator

RSI_DeMarker_Super_Position

iDeMarkeriMAOnArrayiRSI

This indicator synthesizes RSI and DeMarker oscillators into a unified super-position to detect price momentum shifts and divergence patterns via dual-weighted moving averages.

Indicator

RSI_Directions_Lib_Sample

iRSI
Indicator

RSI_DynamicZone_RSI

iRSI
Indicator

RSI_DynamicZone_RSI_BzFLBL_mtf_20080806

iRSI
Indicator

RSI_DynZ_TDI_mtf

iMAOnArrayiRSI
Indicator

RSI_EMA_COL

iMAOnArrayiRSI
RSI_EMA_MTF
Indicator

RSI_EMA_MTF

iMAOnArrayiRSI

This indicator projects a smoothed moving average of the Relative Strength Index from a higher timeframe onto the current chart to identify long-term momentum trends.

Indicator

RSI_Extremums_Lib_Sample

iRSI
rsi_filter
Indicator

rsi_filter

iMAOnArrayiRSI
RSI_Filter_mtf
Indicator

RSI_Filter_mtf

iRSI
RSI_Filter_vX2D2alert_mtf
Indicator

RSI_Filter_vX2D2alert_mtf

iRSI
RSI_Filter_vX2D2alert_mtf_003
Indicator

RSI_Filter_vX2D2alert_mtf_003

iRSI
rsi_gold_silver
Indicator

rsi_gold_silver

iRSI

This indicator synthesizes the Relative Strength Index values of Gold and Silver to calculate a mean-reverting representative momentum line.

Indicator

RSI_Levels_Lib_Sample

iRSI
Indicator

RSI_Lib_Sample

iMAOnArrayiRSI
RSI_LiDo
Indicator

RSI_LiDo

iRSI

This indicator visualizes rapid-period Relative Strength Index fluctuations by overlaying specific signal dots onto a smoothed momentum line to highlight price velocity.

RSI_LiDo1
Indicator

RSI_LiDo1

iRSI

This indicator calculates high-frequency relative strength values using a customizable period and overlays visual markers to identify momentum shifts.

RSI_LiDo1_open
Indicator

RSI_LiDo1_open

iRSI

This indicator captures price momentum by plotting Relative Strength Index values with custom visual markers to identify overextended market conditions.

RSI_LiDo2
Indicator

RSI_LiDo2

iRSI

A high-sensitivity Relative Strength Index derivative that visualizes momentum shifts through precise price action mapping and dynamic plotting.

Rsi_Lido_SuperRsi_v1.92_Compatible2
Indicator

Rsi_Lido_SuperRsi_v1.92_Compatible2

iRSI

This indicator calculates Relative Strength Index values while utilizing global variables to maintain synchronized period settings across multiple charts and platform restarts.

RSI_MA_LevelSignal
Indicator

RSI_MA_LevelSignal

iMAiRSI

This indicator identifies bullish and bearish entries by detecting RSI oversold/overbought breakouts synchronized with EMA trend alignment and dynamic price range volatility.

rsi_ma_trade_sist
Indicator

rsi_ma_trade_sist

iATRiMAiRSI
rsi_ma_trade_sist_chart
Indicator

rsi_ma_trade_sist_chart

iATRiMAiRSI

This indicator identifies trend reversals by detecting crossovers between a fast and slow exponential moving average synchronized with Relative Strength Index momentum thresholds.

RSI_Mirror
Indicator

RSI_Mirror

iRSI

This indicator calculates the mathematical variance between Close-based and Open-based RSI values to isolate momentum discrepancies.

rsi_monitor
Indicator

rsi_monitor

iRSI

A consolidated visual dashboard that tracks Relative Strength Index values across nine concurrent timeframes with automated push, email, and audio alerts for overbought or oversold conditions.

RSI_mtf
Indicator

RSI_mtf

iRSI
RSI_MTF1
Indicator

RSI_MTF1

iRSI

This indicator calculates and overlays the Relative Strength Index from a user-defined higher timeframe onto the current chart for multi-dimensional momentum analysis.

RSI_MultiBuySellAvg
Indicator

RSI_MultiBuySellAvg

iRSI

This indicator calculates and plots the arithmetic mean of Relative Strength Index (RSI) values across two distinct baskets of currency pairs to identify collective market momentum.

RSI_Peak_and_Bottom
Indicator

RSI_Peak_and_Bottom

iRSI

This indicator dynamically identifies local extrema by detecting structural reversals in momentum values to highlight potential price exhaustion zones.

Rsi_R2_Opt_Indicator
Indicator

Rsi_R2_Opt_Indicator

iMAiMAOnArrayiRSI

This indicator identifies directional momentum by verifying sequential RSI growth/decay against a moving average trend, optionally filtered by Hull Moving Average velocity.

Indicator

RSI_SelfAdjustRSI_v1.0FX5_mtf

iRSIiStdDevOnArray
RSI_SevenPairsBuy
Indicator

RSI_SevenPairsBuy

iRSI

This indicator calculates and plots the individual Relative Strength Index values for multiple currency pairs simultaneously while computing a unified arithmetic mean to identify collective momentum trends.

RSI_SevenPairsSell
Indicator

RSI_SevenPairsSell

iRSI

This indicator calculates the arithmetic mean of Relative Strength Index values across multiple synchronized currency pairs to identify collective market momentum.

RSI_Strike(AM)
Indicator

RSI_Strike(AM)

iRSI

This indicator identifies bullish and bearish market shifts by detecting concurrent crossovers across four distinct pairs of Relative Strength Index oscillators with varying timeframes.

RSI_Strike(AM)_SW
Indicator

RSI_Strike(AM)_SW

iMAiRSI

This indicator identifies momentum shifts by calculating moving average differences and flagging specific crossover events across a multi-layered RSI grid.

RSI_Tokman
Indicator

RSI_Tokman

iMAOnArrayiRSI

This indicator generates real-time alerts by monitoring the smoothed moving average of the Relative Strength Index to detect precise crossovers around the 50-level equilibrium.

RSI_Trend
Indicator

RSI_Trend

iRSI

This indicator identifies directional market regimes by correlating RSI peak breaches with specific price-action floor and ceiling thresholds to distinguish between active trends and consolidated trading ranges.

rsi_ts
Indicator

rsi_ts

iRSI

This indicator visualizes the Relative Strength Index while dynamically marking extreme momentum exhaustion points via arrow signals when values breach predefined upper and lower boundaries.

RSI_X2
Indicator

RSI_X2

iRSI

This indicator visualizes the interplay between two Relative Strength Indices of different temporalities to identify momentum shifts and trend velocity.

Indicator

RSI_x2_mtf

iRSI
SDX-TzPivots-alerts
Indicator

SDX-TzPivots-alerts

iForceiADXiRSI
SDX-TzPivots-alerts_test
Indicator

SDX-TzPivots-alerts_test

iForceiADXiRSI
SDX-TzPivots-alerts_test1
Indicator

SDX-TzPivots-alerts_test1

iACiCCIiDeMarkeriATR
SDX-TzPivots_mod
Indicator

SDX-TzPivots_mod

iForceiADXiRSI
Sem Black
Indicator

Sem Black

iMAiRSI

This indicator identifies high-probability reversal zones by detecting synchronized momentum shifts between an exponential moving average crossover and extreme Relative Strength Index levels.

SGMAR
Indicator

SGMAR

iMAOnArrayiRSI

This indicator identifies trend reversals and momentum shifts by detecting crossovers between a Simple Moving Average and an Exponential Moving Average applied to the RSI values.

SGMAR1_Alert
Indicator

SGMAR1_Alert

iMAOnArrayiRSI
SGMAR2_Alert
Indicator

SGMAR2_Alert

iMAOnArrayiRSI

This indicator identifies trend reversals by detecting the intersection of a Simple Moving Average and an Exponential Moving Average calculated specifically over the RSI values.