QQEA_001
Download script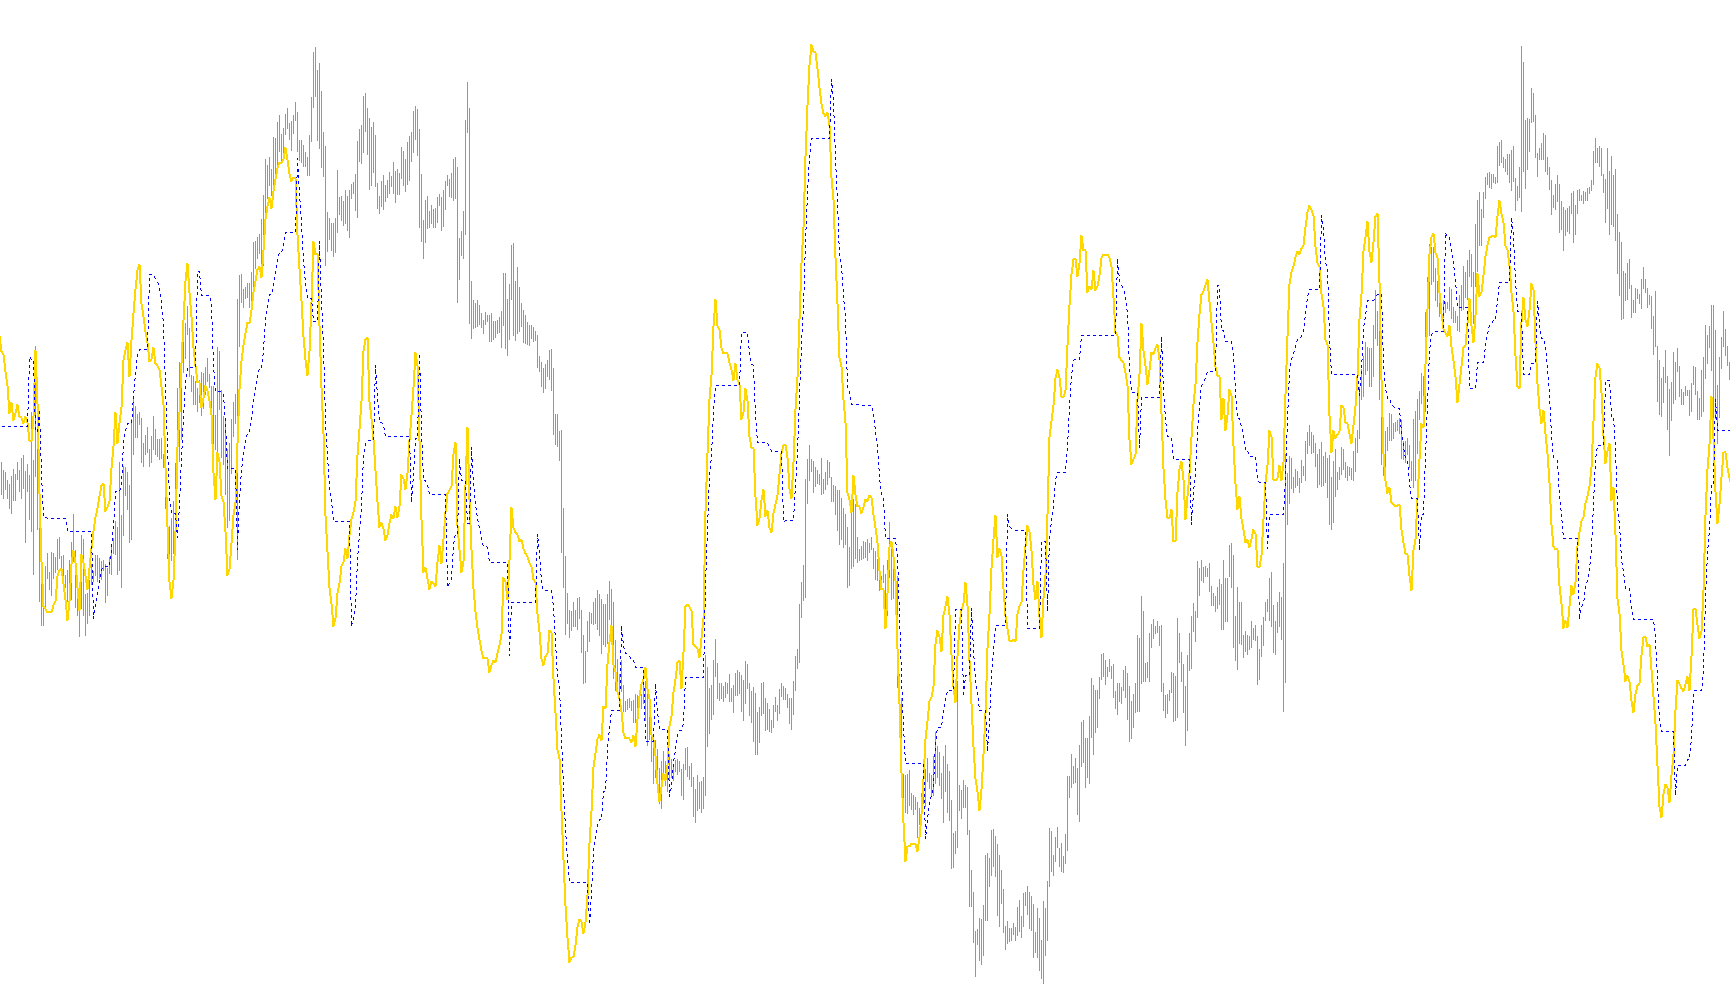
The Qualitative Quantitative Estimation (QQE) indicator is a sophisticated technical analysis tool designed to help traders identify market trends and potential turning points by combining momentum, volatility, and smoothing techniques. Rather than looking at just one price movement, it synthesizes several layers of data to filter out "market noise" and provide a clearer picture of the underlying price direction.
Core Logic and Methodology
The indicator functions through a multi-step calculation process that transforms raw price data into smoothed, actionable signals:
1. Momentum Measurement (RSI) At its foundation, the script utilizes the Relative Strength Index (RSI). This measures how fast and how far prices are moving in a specific direction. However, instead of using the standard RSI output directly, the script processes it further to ensure the data is not overly reactive to minor price fluctuations.
2. Smoothing and Volatility Analysis To create a more stable signal, the script applies an Exponential Moving Average (EMA) to the momentum data. It then calculates the difference between these averages to determine volatility. By tracking how much the momentum is "swinging," the indicator can better distinguish between a strong, sustained trend and a weak, choppy market movement.
3. Dynamic Threshold Calculation (The "Slow" Level) One of the most unique features of this logic is its dynamic adjustment mechanism. The script calculates a "slow" level that moves along with the price action but maintains a specific buffer—influenced by a multiplier called the Darfactor.
- When the momentum trends upward, the indicator calculates a boundary to track that growth.
- When the momentum trends downward, it does the opposite.
- The logic includes a "memory" component where it compares the current movement to previous values, preventing the indicator from jumping erratically and ensuring the line remains smooth as it follows the trend.
Visual Interpretation for Traders
The result of these calculations is displayed in a separate window below the main price chart:
- Trend Following: The primary line represents the smoothed momentum. When this line moves upward, it suggests bullish sentiment; when it moves downward, it suggests bearish sentiment.
- Volatility Filtering: Because the script uses EMA smoothing and volatility adjustments, the resulting lines are less "jittery" than standard oscillators. This helps traders stay in a trend longer without being prematurely shaken out by minor price wiggles.
- Early Warning: By observing the distance between the current momentum and its dynamic threshold, traders can see when a trend is losing steam or when a significant reversal might be imminent.
In summary, the QQE indicator acts as a sophisticated filter that strips away the "chaos" of the market to reveal the underlying trend, providing a smoother, more reliable perspective on whether the market is currently trending up, down, or consolidating.
//+------------------------------------------------------------------+
//|   Qualitative Quantitative Estimation Indicator for Metatrader 4 |
//|                                     Copyright © 2006Roman Ignatov |
//|                                   mailto:roman.ignatov@gmail.com |
//+------------------------------------------------------------------+
#property copyright "Copyright © 200 Roman Ignatov"
#property link      "mailto:roman.ignatov@gmail.com"

#property indicator_separate_window

#property indicator_buffers 2

#property indicator_color1 Red
#property indicator_style1 STYLE_SOLID
#property indicator_width1 2

#property indicator_color2 Yellow
#property indicator_style2 STYLE_DOT


extern int SF = 5; // original 5
extern int RSI_Period = 14; // original 14
extern double DARFACTOR = 4.236; //original 4.236


int Wilders_Period;
int StartBar;

double TrLevelSlow[];
double AtrRsi[];
double MaAtrRsi[];
double Rsi[];
double RsiMa[];

int init()
{
    Wilders_Period = RSI_Period * 2 - 1;
    if (Wilders_Period < SF)
        StartBar = SF;
    else
        StartBar = Wilders_Period;

    IndicatorBuffers(6);
    SetIndexBuffer(0, RsiMa);
    SetIndexStyle(0, DRAW_LINE, STYLE_SOLID, 2);
    SetIndexLabel(0, "Value 1");
    SetIndexDrawBegin(0, StartBar);
    SetIndexStyle(1, DRAW_LINE, STYLE_DOT);
    SetIndexBuffer(1, TrLevelSlow);
    SetIndexLabel(1, "Value 2");
    SetIndexDrawBegin(1, StartBar);
    SetIndexBuffer(2, AtrRsi);
    SetIndexBuffer(3, MaAtrRsi);
    SetIndexBuffer(4, Rsi);
    IndicatorShortName(StringConcatenate("QQE(", SF, ")"));
    return(0);
}


int start()
{
    int counted, i;
    double rsi0, rsi1, dar, tr, dv;

    if(Bars <= StartBar)
        return (0);

    counted = IndicatorCounted();
    if(counted < 1)
        for(i = Bars - StartBar; i < Bars; i++)
        {
            TrLevelSlow[i] = 0.0;
            AtrRsi[i] = 0.0;
            MaAtrRsi[i] = 0.0;
            Rsi[i] = 0.0;
            RsiMa[i] = 0.0;
        }

    counted = Bars - counted - 1;

    for (i = counted; i >= 0; i--)
        Rsi[i] = iRSI(NULL, 0, RSI_Period, PRICE_CLOSE, i);

    for (i = counted; i >= 0; i--)
    {
        RsiMa[i] = iMAOnArray(Rsi, 0, SF, 0, MODE_EMA, i);
        AtrRsi[i] = MathAbs(RsiMa[i + 1] - RsiMa[i]);
    }

    for (i = counted; i >= 0; i--)
        MaAtrRsi[i] = iMAOnArray(AtrRsi, 0, Wilders_Period, 0, MODE_EMA, i);

    i = counted + 1;
    tr = TrLevelSlow[i];
    rsi1 = iMAOnArray(Rsi, 0, SF, 0, MODE_EMA, i);
    while (i > 0)
    {
        i--;
        rsi0 = iMAOnArray(Rsi, 0, SF, 0, MODE_EMA, i);
        dar = iMAOnArray(MaAtrRsi, 0, Wilders_Period, 0, MODE_EMA, i) * DARFACTOR;

        dv = tr;
        if (rsi0 < tr)
        {
            tr = rsi0 + dar;
            if (rsi1 < dv)
                if (tr > dv)
                    tr = dv;
        }
        else if (rsi0 > tr)
        {
            tr = rsi0 - dar;
            if (rsi1 > dv)
                if (tr < dv)
                    tr = dv;
        }
        TrLevelSlow[i] = tr;
        rsi1 = rsi0;
    }

    return(0);
}
Comments