DT-RSI-Sig_v2
Indicator

DT-RSI-Sig_v2

iRSI
DT-RSI-Sig_v4
Indicator

DT-RSI-Sig_v4

iRSI
Indicator

DTosc_mtf_

iMAOnArrayiRSI
Indicator

DTosc_yb_mtf_

iMAOnArrayiRSI
DTS-InfoTrade
Indicator

DTS-InfoTrade

iCCIiMACDiRSIiStochastic
Dynamic Zone RSI
Indicator

Dynamic Zone RSI

iRSI
Dynamic Zone RSI1(02SEP05)
Indicator

Dynamic Zone RSI1(02SEP05)

iRSI

This indicator generates a dynamic volatility envelope around the Relative Strength Index by calculating a moving average and standard deviation of the momentum values.

Dynamic Zone RSI2
Indicator

Dynamic Zone RSI2

iRSI
Dynamic Zone RSI_v1
Indicator

Dynamic Zone RSI_v1

iRSI
Dynamic Zone RSI_v2
Indicator

Dynamic Zone RSI_v2

iRSI

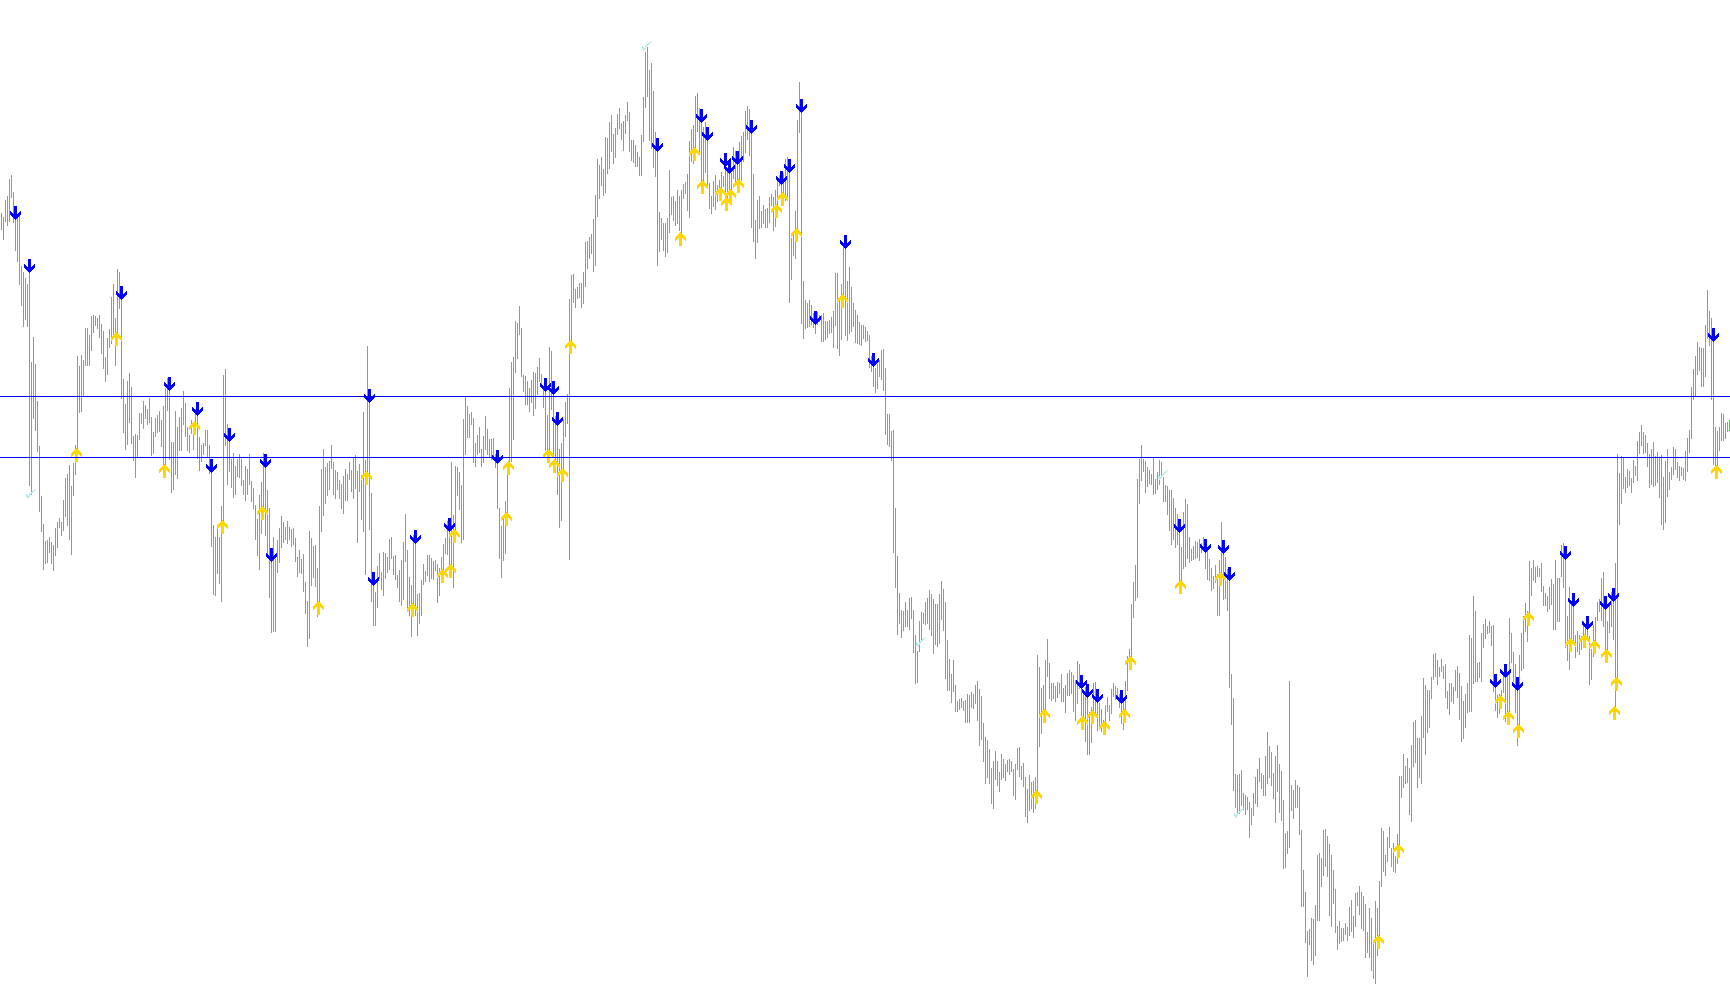
The indicator projects dynamic volatility boundaries around a Relative Strength Index line by calculating a moving average and standard deviation offset.
DynamicZoneRSI
Indicator

DynamicZoneRSI

iRSI

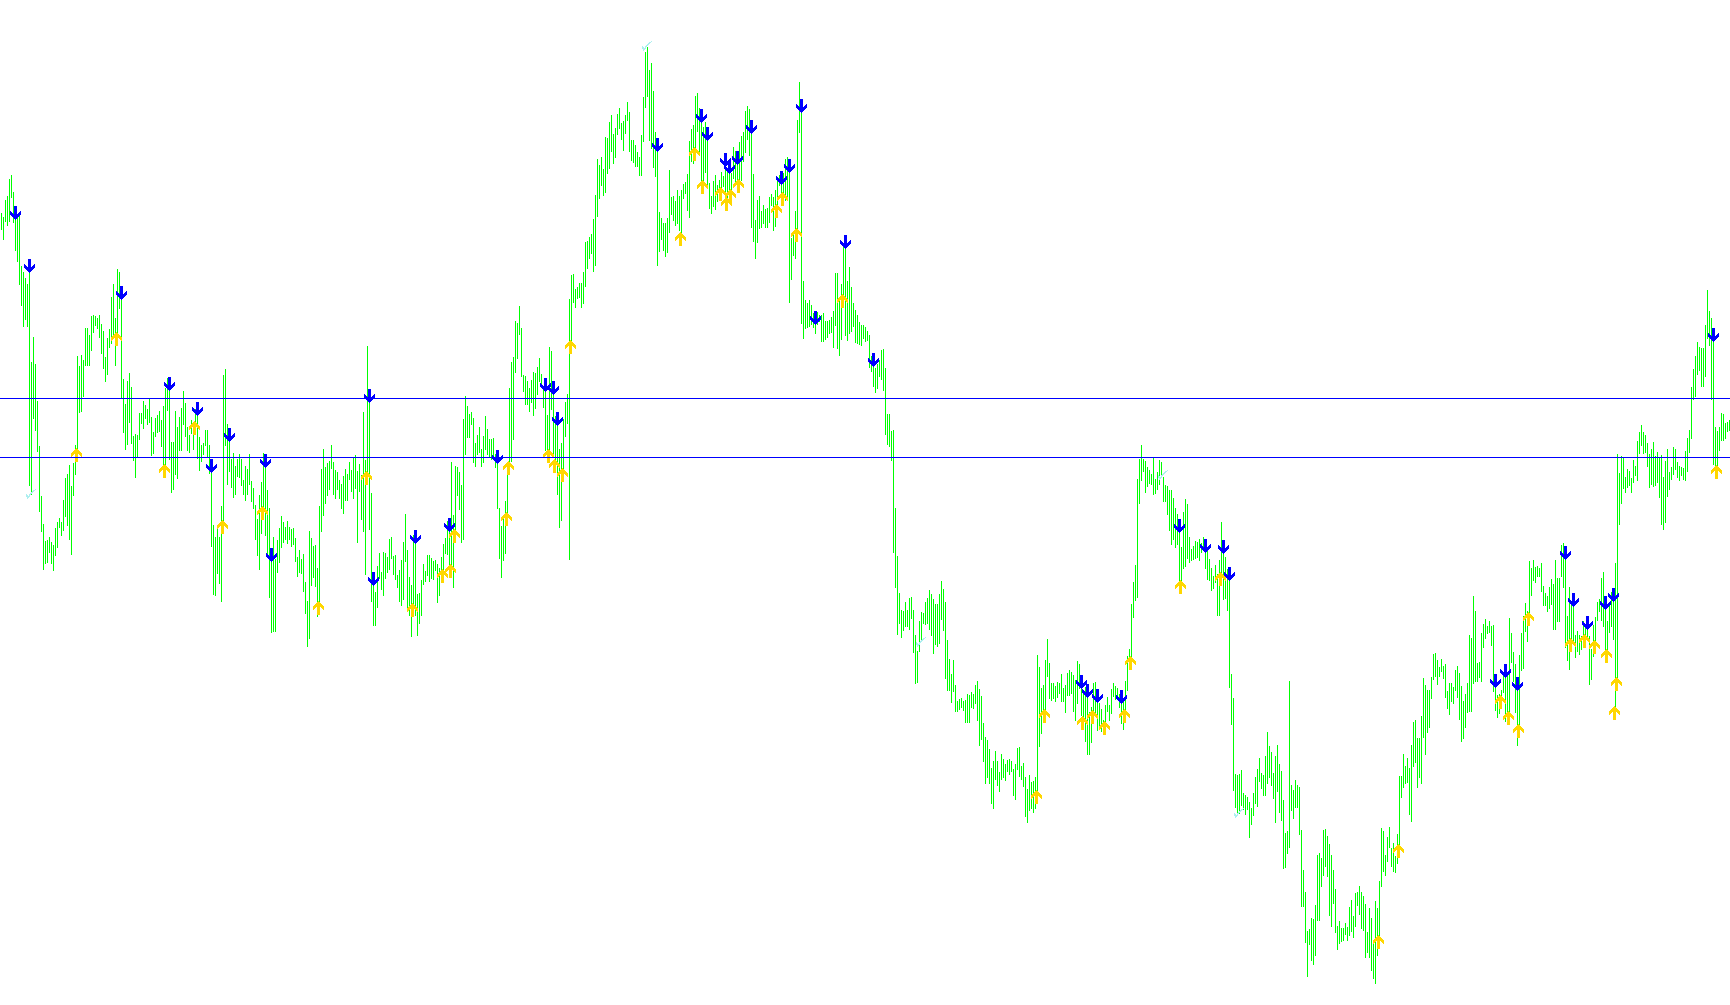
This indicator identifies overextended price action by overlaying a standard deviation-based dynamic envelope onto a weighted relative strength index.
DynamicZoneRSI_001
Indicator

DynamicZoneRSI_001

iRSI
Dynamic_Zone_RSI2
Indicator

Dynamic_Zone_RSI2

iRSI

This indicator generates dynamic upper and lower boundaries by calculating a moving average of the RSI combined with standard deviation multipliers to identify extreme momentum zones.

Indicator

Elliott Wave indic

iBearsPoweriBullsPoweriCCIiRSI
Indicator

Elliott Wave indic_v1

iBearsPoweriBullsPoweriCCIiRSI
EmaCrosswithRSI3
Indicator

EmaCrosswithRSI3

iMAiRSI

This indicator identifies precise trend reversals by detecting geometric crossovers between dual Exponential Moving Averages and validating momentum shifts via Relative Strength Index (RSI) threshold breaches.

Indicator

EMailSignals

iMAiRSI
EMA_RSI_Signal
Indicator

EMA_RSI_Signal

iMAiRSI

Identifies trend reversals by detecting bullish or bearish EMA crossovers filtered by RSI momentum thresholds.

Extreme_RSI
Indicator

Extreme_RSI

iRSI

This indicator identifies potential trend reversals by detecting precise crossovers of the 30 and 70 Relative Strength Index boundaries.

Indicator

fann4mt_proto_prediction_RSI-RVI-STOCH

iRVIiRSIiStochastic
FerruFx_Multi_info THV
Indicator

FerruFx_Multi_info THV

iCCIiMACDiADXiMA
FerruFx_Multi_info+_2
Indicator

FerruFx_Multi_info+_2

iForceiMomentumiRSIiStochastic
FerruFx_Multi_info+_2_v1[1].2
Indicator

FerruFx_Multi_info+_2_v1[1].2

iForceiMomentumiRSIiStochastic
FerruFx_Multi_info+_light_chart_v1.1
Indicator

FerruFx_Multi_info+_light_chart_v1.1

iCCIiMACDiADXiMA
FerruFx_Multi_info+_light_chart_v1.1_001
Indicator

FerruFx_Multi_info+_light_chart_v1.1_001

iCCIiMACDiADXiMA
FerruFx_Multi_info+_light_chart_v1[1].1-Ndisc
Indicator

FerruFx_Multi_info+_light_chart_v1[1].1-Ndisc

iCCIiMACDiADXiMA
FerruFx_Multi_info__
Indicator

FerruFx_Multi_info__

iCCIiMACDiADXiMA
FerruFx_Trend+_2
Indicator

FerruFx_Trend+_2

iForceiMomentumiRSIiStochastic
Filter overRSI
Indicator

Filter overRSI

iRSI

This indicator categorizes market dynamics into four distinct zones by mapping Relative Strength Index values to specific bullish and bearish momentum thresholds.

Fisher Transform for CCO, COGO or RVI
Indicator

Fisher Transform for CCO, COGO or RVI

iRSI

This indicator synthesizes multiple momentum signals into a normalized stochastic range, then applies a logarithmic Fisher Transform to highlight price exhaustion and trend reversal points.

Fisher Transform for CCO, COGO or RVI_001
Indicator

Fisher Transform for CCO, COGO or RVI_001

iRSI

This indicator applies a stochastic normalization to multiple underlying oscillators followed by a logarithmic transformation to visualize momentum intensity.

Flat Trend RSI
Indicator

Flat Trend RSI

iRSI

This indicator identifies directional bias by isolating RSI values above 70 or below 30 and validating the trend against a secondary threshold of 40 to 60.

Flat Trend RSI_v1
Indicator

Flat Trend RSI_v1

iRSI

This indicator identifies directional bias by monitoring RSI extremes and validates trade zones based on specific price momentum thresholds.

Flat_Trend_RSI
Indicator

Flat_Trend_RSI

iRSI
forexdegrees
Indicator

forexdegrees

iWPRiMAiRSIiStochastic

This indicator quantifies the relative position of price or technical oscillators as angular degrees within a dynamic window to identify trend shifts and momentum velocity.

Fozzy_Alert
Indicator

Fozzy_Alert

iMAOnArrayiRSI

This indicator identifies momentum shifts by generating Bollinger Band envelopes over a smoothed RSI Moving Average to detect volatility-adjusted trend reversals.

Indicator

FX Multi-Meter II

iMACDiMAiSARiStochastic
FX Prime V2
Indicator

FX Prime V2

iCCIiADXiMAiRSI

This indicator identifies high-probability entry points by synchronizing EMA slope gradients with CCI momentum thresholds, RSI strength filters, and ADX trend confirmation.

Fx10Setup
Indicator

Fx10Setup

iMACDiMAiRSIiStochastic
Fx10Setup_RSI_Sto_Macd
Indicator

Fx10Setup_RSI_Sto_Macd

iMACDiMAiRSIiStochastic

This indicator identifies high-probability reversal points by synchronizing moving average crossovers with RSI threshold breaches, Stochastic momentum alignment, and MACD signal positioning.

Fx10Setup_v1
Indicator

Fx10Setup_v1

iMACDiMAiRSIiStochastic
Fx10Setup_v2
Indicator

Fx10Setup_v2

iMACDiMAiRSIiStochastic

This indicator identifies high-probability reversal or continuation points by synchronizing Moving Average crossovers with RSI thresholds, Stochastic oscillator momentum, and MACD signal line positioning.

FX5_SelfAdjustingRSI_v1.0[1]
Indicator

FX5_SelfAdjustingRSI_v1.0[1]

iRSIiStdDevOnArray
FX5_SelfAdjustingRSI_v1.0[1]_v1
Indicator

FX5_SelfAdjustingRSI_v1.0[1]_v1

iRSIiStdDevOnArray
FXA0 - RSI Crossing 50 plus ATR ver1.2
Indicator

FXA0 - RSI Crossing 50 plus ATR ver1.2

iATRiRSI

This indicator identifies bullish and bearish reversals by monitoring RSI crossovers at the 50-level midpoint while dynamically projecting entry targets and stop-losses based on ATR volatility scaling.

FXA0 - RSI Crossing 50 plus ATR ver1
Indicator

FXA0 - RSI Crossing 50 plus ATR ver1

iATRiRSI

This indicator identifies trend reversals and expansionary momentum by detecting Relative Strength Index crossings at the 50 equilibrium, while projecting ATR-based volatility targets and profit-taking levels.

FXprime_V2 Final
Indicator

FXprime_V2 Final

iCCIiADXiMAiRSI
fxprime_v231
Indicator

fxprime_v231

iCCIiADXiMAiRSI

This indicator identifies high-probability trend entries by synchronizing EMA angular velocity, RSI momentum, and CCI multi-period crossovers with ADX directional strength.

Indicator

Gann-ICWR v0.1.1 beta5

iRSI
Indicator

Gann-ICWR v01 with time

iRSI