Indicator

Gann-ICWR-fixed

iRSI
Indicator

Gann-ICWR

iRSI
GBPUSD_sample
Indicator

GBPUSD_sample

iRSI

This indicator visualizes the relative strength of GBP and USD against JPY simultaneously to identify momentum discrepancies.

GG-RSI-CCI
Indicator

GG-RSI-CCI

iCCIiMAOnArrayiRSI

This indicator identifies bullish or bearish momentum by validating concurrent crossovers between Smoothed Moving Averages of both the RSI and CCI oscillators.

harami_ma_rsi_macd
Indicator

harami_ma_rsi_macd

iATRiMACDiMAiRSI

This indicator identifies potential trend reversals by detecting Harami candlestick patterns validated through concurrent Moving Average, RSI momentum, and MACD trend filters.

Heatmap_RSI
Indicator

Heatmap_RSI

iRSI

A multi-layered visual histogram that maps Relative Strength Index intensity into distinct color zones to identify oversold, overbought, and neutral market states.

Higher_TimeFrame_Trend
Indicator

Higher_TimeFrame_Trend

iMAiRSI

This indicator identifies macro trend direction by aligning sequential exponential moving averages across higher timeframes while triggering entry signals based on relative strength oscillations and price channel extremes.

HMA_RSI_Test2
Indicator

HMA_RSI_Test2

iRSIiRSIOnArray

This indicator identifies structural trend shifts by applying a Root Mean Square transformation to a modified relative strength index calculation.

Indicator

ICWR v0.1 beta2

iRSI
Indicator

ICWR v0.1 beta3

iRSI
Indicator

ICWR v0.1 beta4

iMAiRSI
Indicator

ICWR v0.1 beta5

iMAiRSI
Indicator

ICWR v0.1.1 beta5

iMAiRSI
Indicator

ICWR v0.1.1 beta5_v1

iMAiRSI
Indicator

ICWR v0

iRSI
Indicator

ICWR v0[1].1_BETA5

iMAiRSI
Indicator

ICWR v0_v1

iRSI
Indicator

ICWR v0_v2

iRSI
ICWR+fib
Indicator

ICWR+fib

iRSI

This indicator identifies significant price structural swings by detecting local extrema and automatically projecting Fibonacci retracement levels onto the most recent validated trend wave.

ICWR+HISTORY
Indicator

ICWR+HISTORY

iRSI

This indicator autonomously identifies significant market price swings using a custom zigzag algorithm to project automated Fibonacci retracement levels and structural zones.

ICWR.a
Indicator

ICWR.a

iRSI

This indicator dynamically identifies significant market structural swings using a zigzag algorithm and automatically plots trend waves along with Fibonacci retracement levels for precise pivot analysis.

ICWR.a_v1
Indicator

ICWR.a_v1

iRSI

This indicator identifies structural zig-zag price pivots and automatically projects dynamic Fibonacci retracement levels onto valid trend waves.

ICWR
Indicator

ICWR

iRSI

This indicator identifies significant market structural swings by filtering price extremes into zig-zag patterns and automatically projects Fibonacci retracement levels on the most recent valid wave.

IFish
Indicator

IFish

iMAOnArrayiRSI

This indicator applies a linear weight adjustment to RSI values, smooths them via a Linear Weighted Moving Average, and maps the final output through a hyperbolic tangent sigmoid function to normalize price momentum.

IFish_v1
Indicator

IFish_v1

iMAOnArrayiRSI

This indicator transforms a normalized RSI deviation into a hyperbolic tangent mapped signal to identify extreme momentum reversals.

IFish_v2
Indicator

IFish_v2

iMAOnArrayiRSI

This indicator applies a hyperbolic tangent transformation to a Linear Weighted Moving Average of an offset Relative Strength Index to generate bounded momentum signals.

indi2csv
Indicator

indi2csv

iCCIiATRiMACDiRSI

Synchronizes historical price action and multiple technical oscillators into a structured CSV format for external quantitative analysis.

indicatorarrows
Indicator

indicatorarrows

iMACDiOsMAiMAiStochastic
indicatorcandles
Indicator

indicatorcandles

iCCIiMAiRSI

This indicator projects synthetic price candles onto a separate window based on real-time calculations from PRI, RSI, CCI, or standard price data to visualize momentum and trend strength.

indicator_to_csv
Indicator

indicator_to_csv

iCCIiRSI

This script captures concurrent CCI and RSI oscillator metrics alongside historical OHLCV data to export them into a structured CSV format.

ind_DivPeakTroughRSI_SW_v1
Indicator

ind_DivPeakTroughRSI_SW_v1

iRSI
ind_RSICCIDiv_v1
Indicator

ind_RSICCIDiv_v1

iCCIiRSI

This indicator identifies potential reversal entries by detecting specific price action discrepancies where RSI extreme levels align with CCI momentum crossovers and historical zone transitions.

Information
Indicator

Information

iCCIiMACDiRSIiStochastic

This indicator aggregates synchronized momentum, trend, and volatility data across multiple timeframes into a single visual dashboard to identify high-probability trade bias.

Information_5_deci
Indicator

Information_5_deci

iCCIiMACDiRSIiStochastic

This indicator synchronizes MACD, RSI, Stochastic, CCI, and EMA metrics across multiple timeframes to provide a unified visual heatmap of trend direction and price volatility.

Information_5_deci_MTF
Indicator

Information_5_deci_MTF

iCCIiMACDiRSIiStochastic

This indicator aggregates real-time MACD, RSI, Stochastic, CCI, and EMA signals across nine distinct timeframes to provide a synchronized visual overview of trend momentum and market volatility.

info_Table_v0Satop_en v1
Indicator

info_Table_v0Satop_en v1

iCCIiMAiRSI
info_Table_v0Satop_en
Indicator

info_Table_v0Satop_en

iCCIiMAiRSI
Inverse fisher transform of RSI
Indicator

Inverse fisher transform of RSI

iMAOnArrayiRSI

This indicator applies an exponential hyperbolic tangent transformation to a smoothed Relative Strength Index to normalize price momentum into a bounded range for clearer trend reversal detection.

Inverse Fisher Transform of RSIm
Indicator

Inverse Fisher Transform of RSIm

iRSI
Inverse Fisher Transform of RSI_001
Indicator

Inverse Fisher Transform of RSI_001

iRSI
Inverse Fisher
Indicator

Inverse Fisher

iMAOnArrayiRSI

This indicator transforms normalized RSI data into a bounded momentum oscillator by applying a linear weighted moving average followed by a hyperbolic tangent function.

Inverse_Fisher_Transform_of_RSI
Indicator

Inverse_Fisher_Transform_of_RSI

iRSI
i_dayrsi_v1_1
Indicator

i_dayrsi_v1_1

iRSI

This indicator calculates the Relative Strength Index by dynamically determining the number of bars corresponding to a specific multi-day duration rather than using a fixed period.

JJN-Infobar
Indicator

JJN-Infobar

iMACDiADXiRSIiStochastic

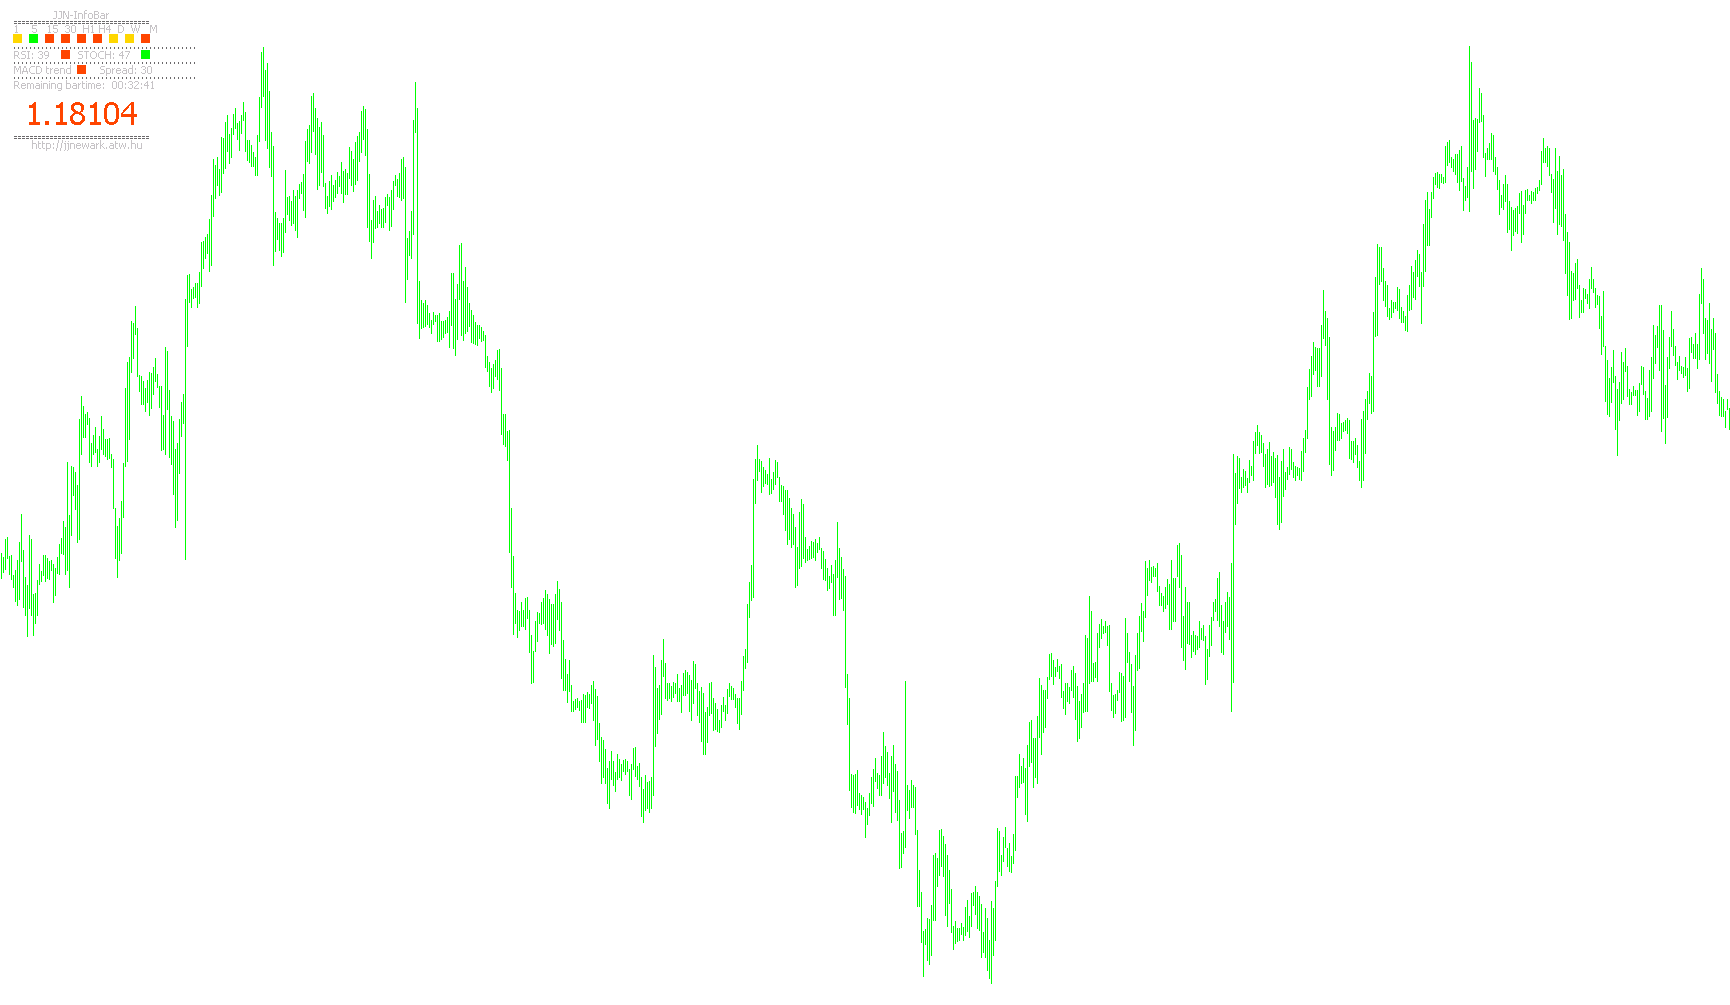
This indicator displays a customizable information panel showing trend direction across multiple timeframes based on ADX and PSAR, along with current RSI, Stochastic, MACD values, spread, remaining bar time, and price.

JMA_RSI
Indicator

JMA_RSI

iRSI

This indicator applies a Jurik Moving Average (JMA) filtering algorithm to the Relative Strength Index (RSI) to generate a smoother, lag-reduced momentum signal.

JMA_RSI_IFT
Indicator

JMA_RSI_IFT

iMAOnArrayiRSI

This indicator synthesizes a Jurik Moving Average with Relative Strength Index data to generate a non-lagging, hyper-smoothed momentum oscillator that maps cyclical price velocity.

KG RS GROUP V1.2a
Indicator

KG RS GROUP V1.2a

iRSI
km-sa
Indicator

km-sa

iRSI

Identifies potential trend shifts by detecting when the RSI value crosses specific oversold and overbought thresholds on a per-bar basis.

km-trend_movers
Indicator

km-trend_movers

iATRiMACDiRSIiStochastic

This indicator synthesizes RSI, ATR, Stochastic, MACD, and CCI metrics alongside dual Moving Average crossovers to provide real-time directional strength classifications.

Indicator

Krishan

iCCIiMAiRSI