R2_Arrows_v4d
Download script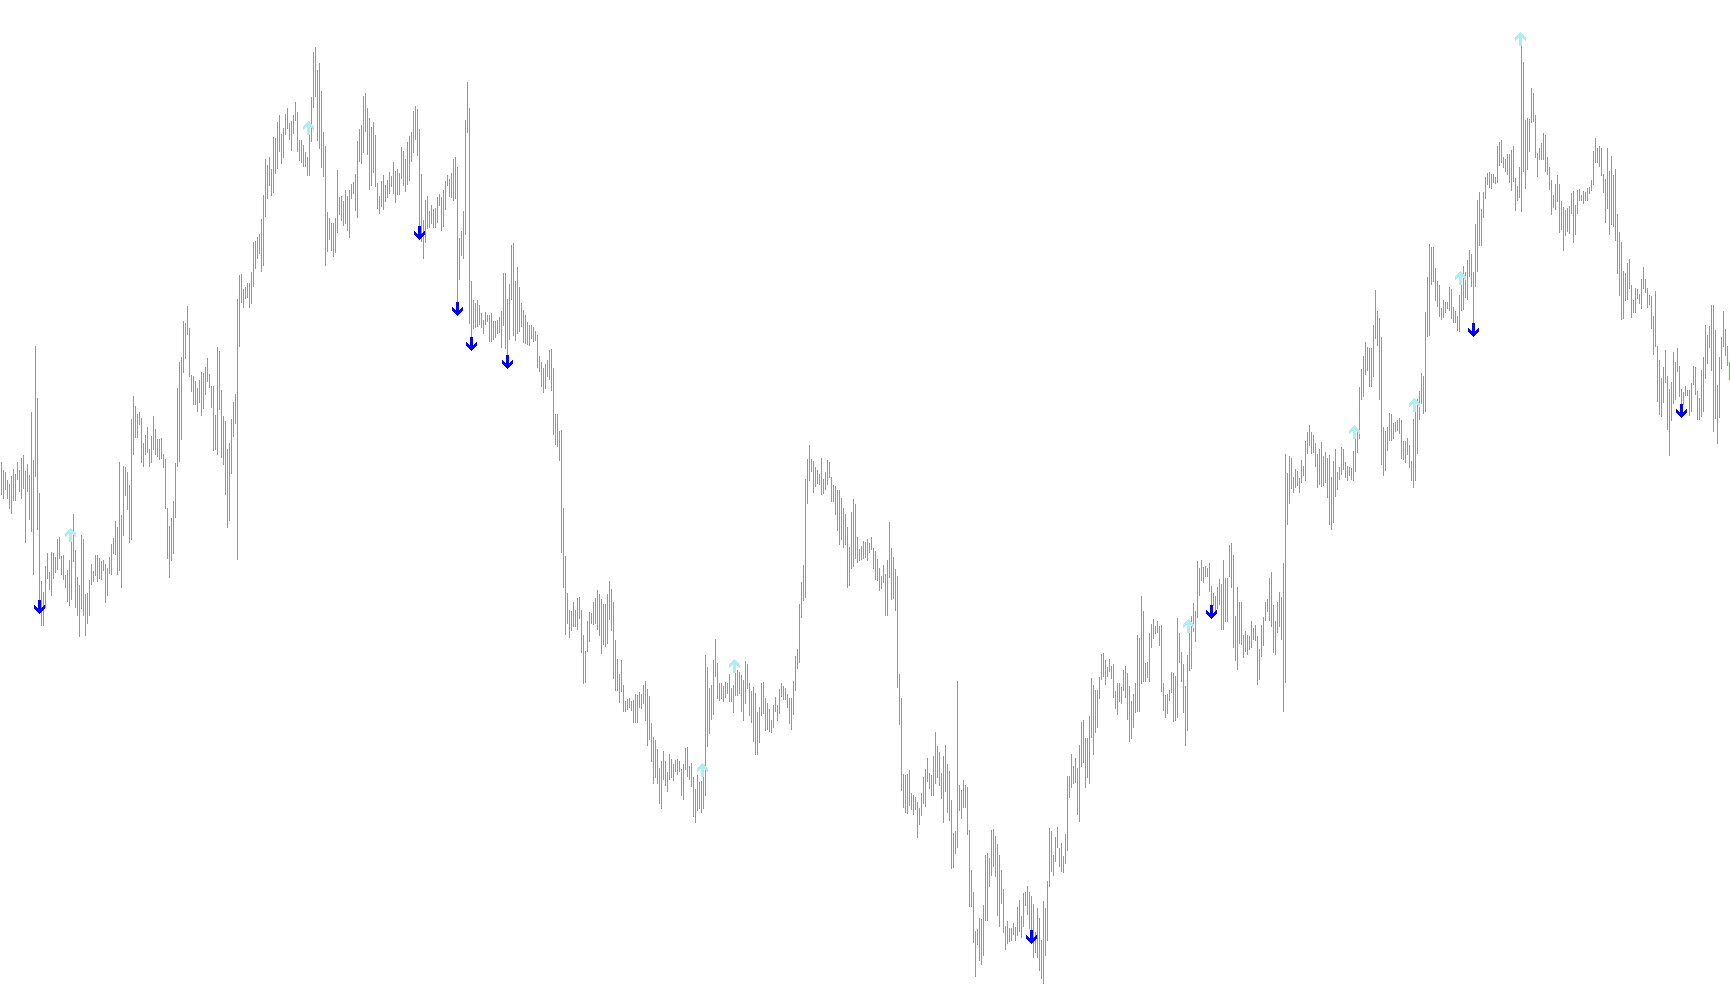
This script is a custom technical indicator designed for the MetaTrader platform to help identify potential trading entries by analyzing price momentum and trend patterns. It works by scanning historical price data to place visual signals—specifically arrows—on your chart when a specific set of mathematical conditions are met simultaneously.
Core Components of the Logic
The script evaluates three primary market dynamics to generate its signals:
1. Momentum Tracking (RSI) The tool uses a momentum oscillator to track how quickly price is moving. Instead of looking at a single moment, it monitors a sequence of three consecutive points in time. It specifically checks for a "descending" or "ascending" trend in this momentum:
- For Buy Signals: It looks for a consistent downward trend in momentum (where each subsequent measurement is lower than the previous one) while ensuring the values remain below a specific threshold.
- For Sell Signals: It looks for a consistent upward trend in momentum (where each subsequent measurement is higher than the previous one) while ensuring the values remain above a specific threshold.
2. Trend Confirmation (Stochastic Oscillator) To ensure the signals align with the broader market movement, the script incorporates a Stochastic Oscillator. This acts as a secondary filter:
- It requires the market to be in a specific "zone" before an arrow appears.
- For a Buy, it confirms the market is moving into a positive territory (above the 50% mark).
- For a Sell, it confirms the market is moving into a negative territory (below the 50% mark).
3. Visual Execution When all these conditions (the specific momentum sequence plus the stochastic zone) are satisfied at the same time, the script places an arrow on the chart:
- Buy Arrows: These appear above the high of a candle to signal a potential upward move.
- Sell Arrows: These appear below the low of a candle to signal a potential downward move.
Summary for the User
In plain terms, this script is looking for "exhaustion" or "strengthening" patterns. It wants to see the market momentum moving in one direction consistently over three steps while the overall sentiment (via the Stochastic Oscillator) supports that direction. By combining these rules, it aims to filter out noise and highlight specific points where the price might be ready to react.
//+------------------------------------------------------------------+
//|                                                R2_Arrows_v4a.mq4 |
//|           Copyright © 2007 , transport_david , David W Honeywell |
//|                                     hellonwheels.trans@gmail.com |
//+------------------------------------------------------------------+

#property copyright "Copyright © 2007 , transport_david , David W Honeywell"
#property link      "hellonwheels.trans@gmail.com"

#property indicator_chart_window

#property indicator_buffers 3

#property indicator_color1 DeepSkyBlue
#property indicator_color2 Red
#property indicator_color3 LawnGreen


extern string s1 = "---------------";
extern int    Ma_Periods          =     200;  // 200 day
extern int    Ma_Method           =       0;  // SMA
extern int    Ma_Applied_Price    =       1;  // Open

extern string s2 = "---------------";
extern int    RsiPeriods          =       2;  // 2 period
extern int    Rsi_Applied_Price   =       1;  // Open

extern string s3 = "---------------";
extern int    BuyIfDay1RsiBelow   =      65; // 1st day of tracking must be < this setting
extern int    BuyIfDay3RsiBelow   =      65; // 3rd day must be < this setting

extern string s4 = "---------------";
extern int    SellIfDay1RsiAbove  =      35; // 1st day of tracking must be > this setting
extern int    SellIfDay3RsiAbove  =      35; // 3rd day must be > this setting

extern string s5 = "---------------";
extern int    ShowBars            =   1000;

double MA[];
double Sell_Arrow[];
double Buy_Arrow[];
double Close_Trade_Marker[];

double bartime;


//+-------------+
//| Init        |
//+-------------+
int init()
  {
   IndicatorBuffers(5);

   SetIndexStyle(0,DRAW_LINE,STYLE_SOLID,2);
   SetIndexEmptyValue(0,0.0);
   SetIndexBuffer(0,MA);
   SetIndexLabel(0,"Trend_Ma_Periods ( "+Ma_Periods+" )");

   SetIndexEmptyValue(1,0.0);
   SetIndexStyle(1,DRAW_ARROW,STYLE_SOLID,1);
   SetIndexArrow(1,234);
   SetIndexBuffer(1,Sell_Arrow);
   SetIndexLabel(1,"Sell_Arrow ( RsiPeriods "+RsiPeriods+" )");

   SetIndexEmptyValue(2,0.0);
   SetIndexStyle(2,DRAW_ARROW,STYLE_SOLID,1);
   SetIndexArrow(2,233);
   SetIndexBuffer(2,Buy_Arrow);
   SetIndexLabel(2,"Buy_Arrow ( RsiPeriods "+RsiPeriods+" )");

   Print("Init complete");
  }


//+-------------+
//| De-init     |
//+-------------+
int deinit()
  {
   Print("De-init complete");
  }

//+-------------+
//| Start       |
//+-------------+
int start()
  {

   double    Today;
   double    Day1;
   double    Day2;
   double    Day3;
   double    sto;

   bool      C1, C2, C3, C4, C5, C6;

   int       shift;

   // bar counting
   if(bartime==Time[0]) return(0);
   bartime=Time[0];

   for ( shift = ShowBars; shift >= 0; shift-- )
     {

      //MA[shift] = iMA( Symbol(), 0, Ma_Periods, 0, Ma_Method, Ma_Applied_Price, shift);

      Day1  = iRSI(Symbol(),0,RsiPeriods,Rsi_Applied_Price,shift+3);
      Day2  = iRSI(Symbol(),0,RsiPeriods,Rsi_Applied_Price,shift+2);
      Day3  = iRSI(Symbol(),0,RsiPeriods,Rsi_Applied_Price,shift+1);
      //Today = iRSI(Symbol(),0,RsiPeriods,Rsi_Applied_Price,shift);
      sto   = iStochastic(Symbol(),0,5,3,3,MODE_SMA,1,MODE_MAIN,shift);

      //- Buy Arrows ---
      C1=false;
      C2=false;
      C3=false;
      C4=false;
      C5=false;
      C6=false;
      C1=true; //if(iOpen(Symbol(),0,shift+1) > MA[shift+1]) C1=true;
      if(Day1 < BuyIfDay1RsiBelow)                C2=true;
      if(Day2 < Day1)                             C3=true;
      if(Day3 < Day2)                             C4=true;
      if(Day3 < BuyIfDay3RsiBelow)                C5=true;
      if(sto  > 50)                               C6=true;
      if(C1&&C2&&C3&&C4&&C5&&C6) Buy_Arrow[shift] = iHigh(Symbol(),0,shift) + (20*Point); // Low arrow Buy

      //- Sell Arrows ---
      C1=false;
      C2=false;
      C3=false;
      C4=false;
      C5=false;
      C6=false;
      C1=true;//if(iOpen(Symbol(),0,shift+1) < MA[shift+1]) C1=true;
      if(Day1 > SellIfDay1RsiAbove)               C2=true;
      if(Day2 > Day1)                             C3=true;
      if(Day3 > Day2)                             C4=true;
      if(Day3 > SellIfDay3RsiAbove)               C5=true;
      if(sto  < 50)                               C6=true;
      if(C1&&C2&&C3&&C4&&C5&&C6) Sell_Arrow[shift] = iLow(Symbol(),0,shift) - (20*Point); // High arrow Sell

     }//for

  }//start
Comments