QQE_004
Download script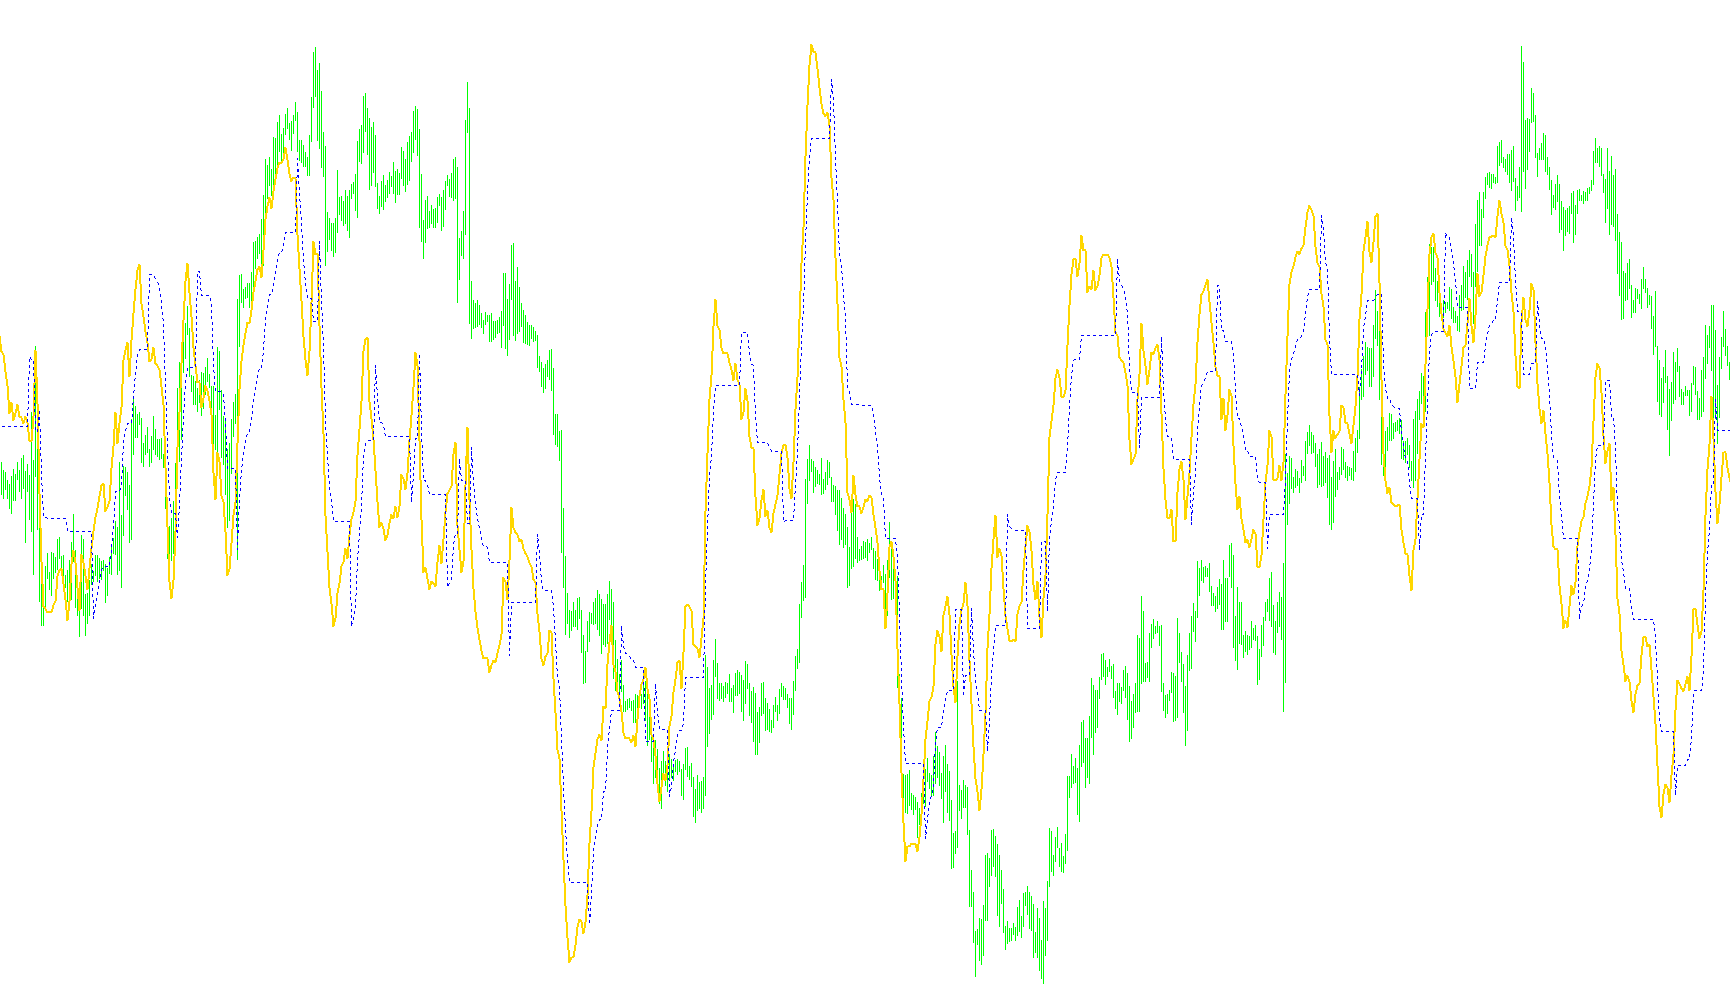
The Qualitative Quantitative Estimation (QQE) indicator is a sophisticated technical analysis tool designed to help traders identify momentum shifts and potential trend reversals in financial markets. Unlike standard indicators that only show price movement, the QQE combines multiple mathematical layers to filter out "market noise," providing a smoother and more reliable signal for entry and exit points.
Core Logic and Methodology
The indicator functions by processing data through four distinct stages of calculation:
1. Momentum Measurement (RSI) At its foundation, the script utilizes the Relative Strength Index (RSI). This measures the speed and change of price movements to determine whether an asset is overbought, oversold, or trending in a specific direction.
2. Smoothing and Sensitivity (EMA & SMA) To prevent the indicator from reacting too aggressively to minor price fluctuations, the script applies Exponential Moving Averages (EMA). It smooths out the raw RSI data, ensuring that the resulting trend lines are fluid rather than jagged.
3. Volatility Analysis (ATR Integration) A unique feature of this logic is how it accounts for market volatility. The script calculates the difference between moving average values to determine the "intensity" of the current price action. By incorporating a volatility component, the indicator can distinguish between a steady, healthy trend and erratic, high-volatility price swings.
4. Dynamic Thresholding (The Trend Filter) The most critical part of the logic is the "Slow Tracking Level." The script creates a dynamic threshold that follows the price momentum. It uses a specific multiplier to set a buffer zone:
- If the momentum moves upward, the indicator calculates a new level based on that growth.
- If the momentum drops, it adjusts downward accordingly.
- The logic includes a "memory" component where it compares current values against previous levels to ensure the trend line doesn't flip-flop prematurely.
Visual Representation and Interpretation
For the user, this complex math translates into a visual trend line on the trading chart:
- Trend Confirmation: When the primary line moves in one direction without frequent reversals, it confirms a sustained trend (bullish or bearish).
- Signal Identification: A significant change in the slope or a "hook" in the line often precedes a potential change in market direction.
- Noise Reduction: Because of the multi-layered smoothing, this indicator is specifically designed to help traders avoid "false starts," where the market looks like it is turning but quickly reverts to its previous path.
In summary, the QQE acts as a sophisticated filter that takes raw price data, calculates the momentum, measures the volatility, and produces a smoothed trend line that highlights the underlying "quality" of the current market move.
//+------------------------------------------------------------------+
//|   Qualitative Quantitative Estimation Indicator for Metatrader 4 |
//|                                     Copyright © 2006Roman Ignatov |
//|                                   mailto:roman.ignatov@gmail.com |
//+------------------------------------------------------------------+
#property copyright "Copyright © 200 Roman Ignatov"
#property link      "mailto:roman.ignatov@gmail.com"

#property indicator_separate_window

#property indicator_buffers 2

#property indicator_color1 Yellow
#property indicator_style1 STYLE_SOLID
#property indicator_width1 2

#property indicator_color2 Red
#property indicator_style2 STYLE_DOT

extern int SF = 5;

int RSI_Period = 14;
int Wilders_Period;
int StartBar;

double TrLevelSlow[];
double AtrRsi[];
double MaAtrRsi[];
double Rsi[];
double RsiMa[];

int init()
{
    Wilders_Period = RSI_Period * 2 - 1;
    if (Wilders_Period < SF)
        StartBar = SF;
    else
        StartBar = Wilders_Period;

    IndicatorBuffers(6);
    SetIndexBuffer(0, RsiMa);
    SetIndexStyle(0, DRAW_LINE, STYLE_SOLID, 2);
    SetIndexLabel(0, "Value 1");
    SetIndexDrawBegin(0, StartBar);
    SetIndexStyle(1, DRAW_LINE, STYLE_DOT);
    SetIndexBuffer(1, TrLevelSlow);
    SetIndexLabel(1, "Value 2");
    SetIndexDrawBegin(1, StartBar);
    SetIndexBuffer(2, AtrRsi);
    SetIndexBuffer(3, MaAtrRsi);
    SetIndexBuffer(4, Rsi);
    IndicatorShortName(StringConcatenate("QQE(", SF, ")"));
    return(0);
}


int start()
{
    int counted, i;
    double rsi0, rsi1, dar, tr, dv;

    if(Bars <= StartBar)
        return (0);

    counted = IndicatorCounted();
    if(counted < 1)
        for(i = Bars - StartBar; i < Bars; i++)
        {
            TrLevelSlow[i] = 0.0;
            AtrRsi[i] = 0.0;
            MaAtrRsi[i] = 0.0;
            Rsi[i] = 0.0;
            RsiMa[i] = 0.0;
        }

    counted = Bars - counted - 1;

    for (i = counted; i >= 0; i--)
        Rsi[i] = iRSI(NULL, 0, RSI_Period, PRICE_CLOSE, i);

    for (i = counted; i >= 0; i--)
    {
        RsiMa[i] = iMAOnArray(Rsi, 0, SF, 0, MODE_EMA, i);
        AtrRsi[i] = MathAbs(RsiMa[i + 1] - RsiMa[i]);
    }

    for (i = counted; i >= 0; i--)
        MaAtrRsi[i] = iMAOnArray(AtrRsi, 0, Wilders_Period, 0, MODE_EMA, i);

    i = counted + 1;
    tr = TrLevelSlow[i];
    rsi1 = iMAOnArray(Rsi, 0, SF, 0, MODE_EMA, i);
    while (i > 0)
    {
        i--;
        rsi0 = iMAOnArray(Rsi, 0, SF, 0, MODE_EMA, i);
        dar = iMAOnArray(MaAtrRsi, 0, Wilders_Period, 0, MODE_EMA, i) * 4.236;

        dv = tr;
        if (rsi0 < tr)
        {
            tr = rsi0 + dar;
            if (rsi1 < dv)
                if (tr > dv)
                    tr = dv;
        }
        else if (rsi0 > tr)
        {
            tr = rsi0 - dar;
            if (rsi1 > dv)
                if (tr < dv)
                    tr = dv;
        }
        TrLevelSlow[i] = tr;
        rsi1 = rsi0;
    }

    return(0);
}
Comments