Pj-over RSI
Download script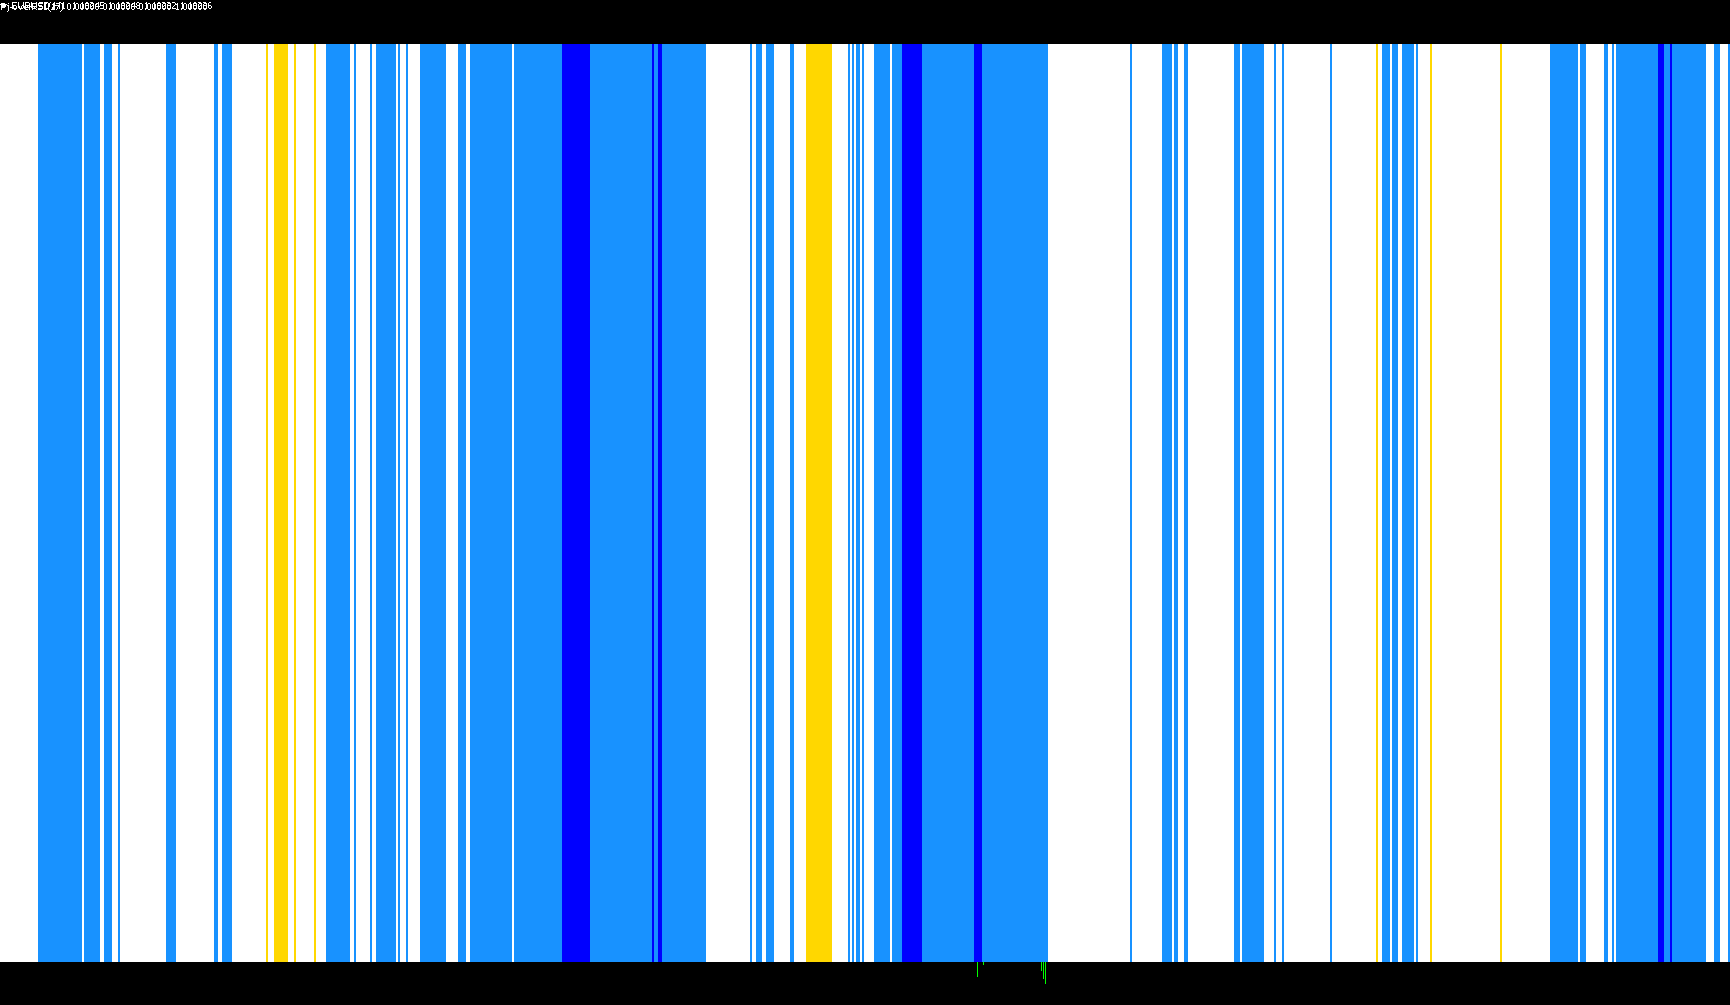
The Pj-over RSI tool is a specialized technical analysis indicator designed to help traders visualize market momentum and identify specific trading zones based on the Relative Strength Index (RSI). Instead of just providing a single line, this script categorizes market activity into four distinct states, represented by different visual bars on your chart.
How the Logic Works
The tool works by analyzing the RSI value—a common momentum oscillator—and comparing it against specific mathematical thresholds. By observing where the price "sits" relative to the Overbought and Oversold levels, the script automatically sorts the market into four different behaviors:
1. Strong Bullish Momentum (Overbought) When the RSI climbs into the highest territory (the "Overbought" zone), the tool identifies this as a state of extreme strength. It highlights that the buying pressure is very high, potentially reaching a peak.
2. Bullish Trend (Positive Momentum) When the RSI is high but has not yet reached the extreme overbought level (falling between the midpoint and the overbought limit), the script identifies a standard upward trend. This suggests a healthy, ongoing move to the upside.
3. Bearish Trend (Negative Momentum) Conversely, when the RSI is in the lower half of the range but hasn't hit the extreme "Oversold" floor, the tool flags a downward trend. This indicates that sellers are currently in control, but the market isn't necessarily "exhausted."
4. Strong Bearish Momentum (Oversold) When the RSI drops into the lowest territory (the "Oversold" zone), the tool recognizes this as extreme selling pressure. It marks a state where the downward move is very aggressive and may be reaching a bottom.
Summary of Visual Feedback
The indicator simplifies complex price movements into a clear visual summary:
- It distinguishes between "Trend" (the general direction the market is moving) and "Strong Momentum" (when that movement becomes extreme).
- By using these four distinct categories, it allows you to quickly see at a glance whether the market is in a steady climb, a steady decline, or if it is reaching an extreme "overheated" state in either direction.
//+------------------------------------------------------------------+
//|                                                  Pj-over RSI.mq4 |
//|                                      Copyright © 2007, PRIMAjaya |
//|                                   http://primaforex.blogspot.com |
//+------------------------------------------------------------------+
#property copyright "Copyright © 2007, PRIMAjaya"
#property link      "http://primaforex.blogspot.com"

#property indicator_separate_window
#property indicator_minimum 0
#property indicator_maximum 1
#property indicator_buffers 4
#property indicator_color1 DarkGreen
#property indicator_color2 Red
#property indicator_color3 MediumSeaGreen
#property indicator_color4 Tomato


//---- input parameters
extern int PeriodeRSI=17;
extern int OverboughtLevel=70;
extern int OversoldLevel=30;

//---- indicator buffers
double UpBuffer1[];
double DnBuffer1[];
double UpBuffer2[];
double DnBuffer2[];
//+------------------------------------------------------------------+
//| Custom indicator initialization function                         |
//+------------------------------------------------------------------+
  int init()
  {
   string indi_name;
//---- indicator line
   SetIndexStyle(0,DRAW_HISTOGRAM,STYLE_SOLID,2);
   SetIndexStyle(1,DRAW_HISTOGRAM,STYLE_SOLID,2);
   SetIndexStyle(2,DRAW_HISTOGRAM,STYLE_SOLID,2);
   SetIndexStyle(3,DRAW_HISTOGRAM,STYLE_SOLID,2);

   SetIndexBuffer(0,UpBuffer1);
   SetIndexBuffer(1,DnBuffer1);
   SetIndexBuffer(2,UpBuffer2);
   SetIndexBuffer(3,DnBuffer2);

   IndicatorDigits(MarketInfo(Symbol(),MODE_DIGITS));
//---- name for DataWindow and indicator subwindow label
   indi_name="Pj-overRSI("+PeriodeRSI+")";
   IndicatorShortName(indi_name);
   SetIndexLabel(0,"Overbought or Strong Bulls");
   SetIndexLabel(1,"Oversold or Strong Bears");
   SetIndexLabel(2,"Trend Bulls");
   SetIndexLabel(3,"Trend Bears");

//----
   SetIndexDrawBegin(0,PeriodeRSI);
   SetIndexDrawBegin(1,PeriodeRSI);
   SetIndexDrawBegin(2,PeriodeRSI);
   SetIndexDrawBegin(3,PeriodeRSI);
//----
   return(0);
  }

//+------------------------------------------------------------------+
//| ProSol Confirmation                                              |
//+------------------------------------------------------------------+
int start()
  {
   int shift,trend;
   double RSI0;


   for(shift=Bars-PeriodeRSI-1;shift>=0;shift--)
   {
   RSI0=iRSI(NULL,0,PeriodeRSI,PRICE_CLOSE,shift);

	  if (RSI0>(OverboughtLevel+OversoldLevel)/2 && RSI0<OverboughtLevel)  trend=1;
	  if (RSI0>=OverboughtLevel)  trend=2;
	  if (RSI0<=(OverboughtLevel+OversoldLevel)/2 && RSI0>OversoldLevel) trend=-1;
	  if (RSI0<OversoldLevel)  trend=-2;

	  if (trend==1)
	  {

	  UpBuffer1[shift]=0;
	  UpBuffer2[shift]=1;
	  DnBuffer1[shift]=0;
	  DnBuffer2[shift]=0;

	  }
	  if (trend==2)
	  {

	  UpBuffer1[shift]=1;
	  UpBuffer2[shift]=0;
	  DnBuffer1[shift]=0;
	  DnBuffer2[shift]=0;

	  }
	  if (trend==-1)
	  {

	  UpBuffer1[shift]=0;
	  UpBuffer2[shift]=0;
	  DnBuffer1[shift]=0;
	  DnBuffer2[shift]=1;
	  }

	  if (trend==-2)
	  {

	  UpBuffer1[shift]=0;
	  UpBuffer2[shift]=0;
	  DnBuffer1[shift]=1;
	  DnBuffer2[shift]=0;

	  }
	}
	return(0);
 }
Comments