QQE_v2
Download script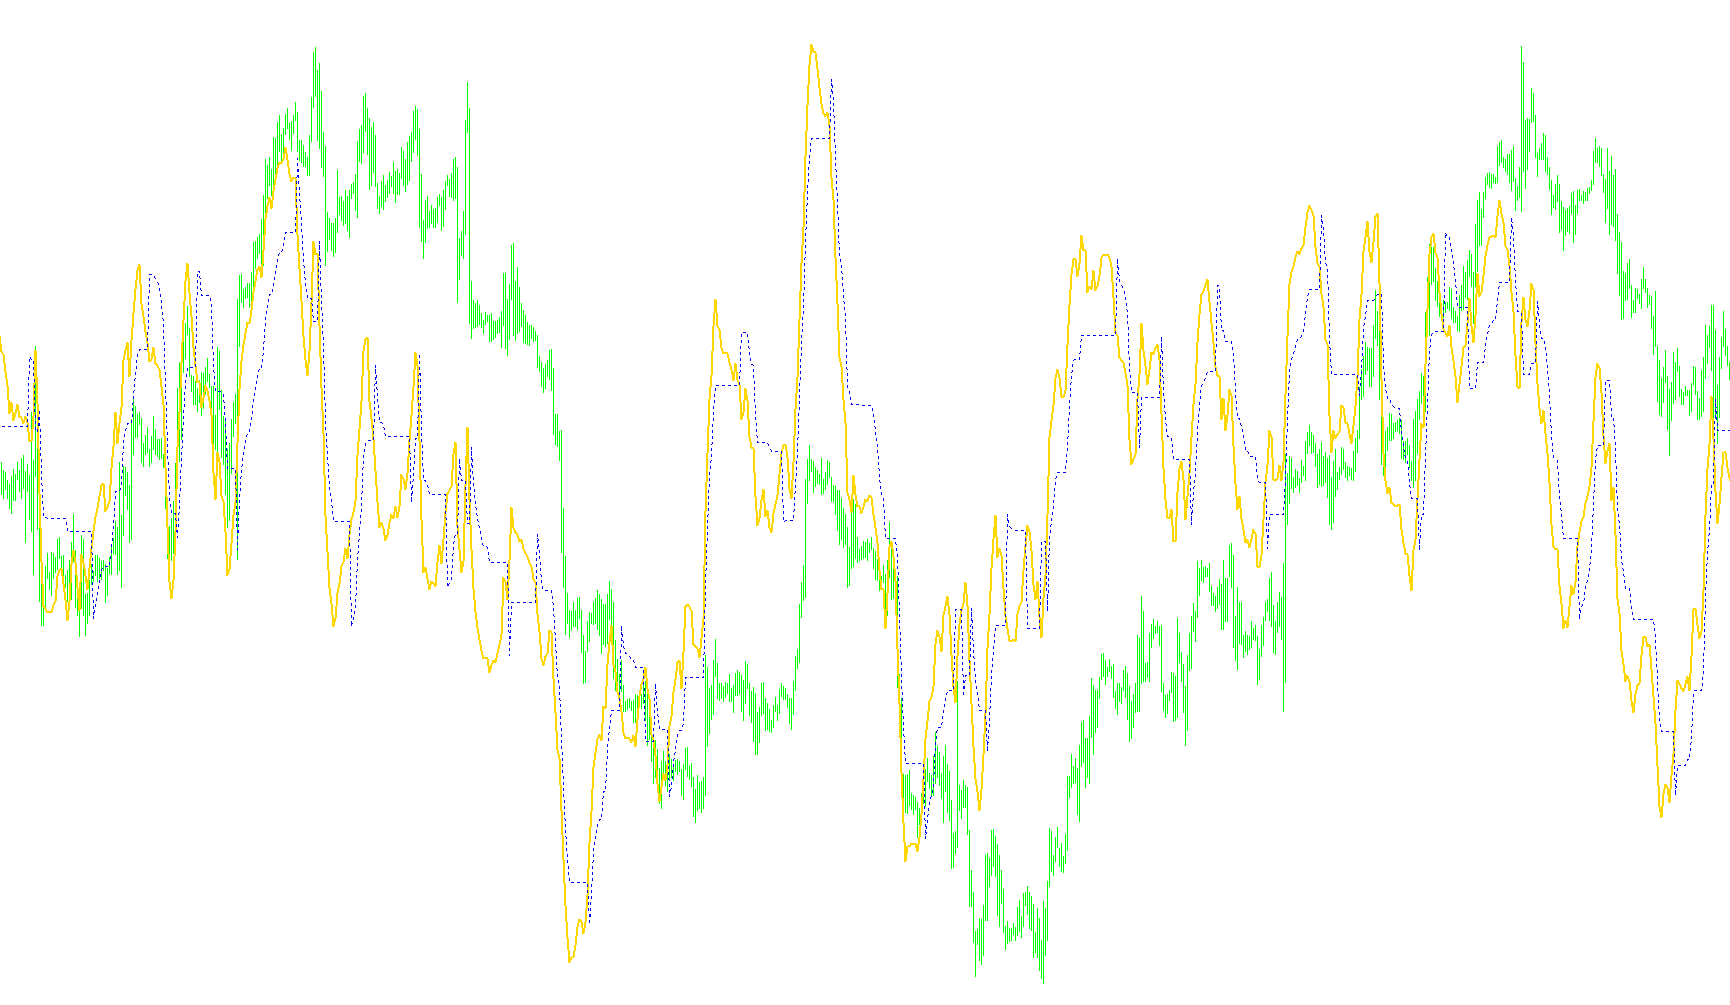
This indicator, known as the Qualitative Quantitative Estimation (QQE), is designed to help traders identify market trends and potential momentum shifts by smoothing out price noise. It operates by combining two well-known technical concepts—momentum (RSI) and volatility (ATR)—to create a more stable visual representation of where the price is heading.
How the Logic Works
The indicator functions through a multi-layered calculation process:
1. Foundation: Momentum Tracking The script begins by calculating the Relative Strength Index (RSI). In simple terms, the RSI measures how quickly and strongly an asset's price is moving up or down. However, because raw momentum data can be "jittery" and provide many false signals, the indicator applies a moving average to this data to smooth it out into a cleaner trend line.
2. Volatility Measurement Next, the logic looks at the rate of change in that smoothed momentum. It calculates the difference between current momentum values and previous ones to determine volatility. This helps the tool understand not just which direction the market is moving, but also how "active" or "lazy" that movement is.
3. Dynamic Smoothing (The Core Logic) This is where the script becomes unique. Instead of using a static line, it employs a dynamic "threshold" system. It compares the smoothed momentum against a calculated level that adjusts automatically based on market volatility.
- If the momentum moves significantly beyond this threshold, the indicator recognizes a strengthening trend.
- The logic includes a safety check: it prevents the indicator from making erratic jumps by ensuring that the new trend levels don't deviate too drastically from the previous values in a single step.
Visual Interpretation for Traders
The result of these complex calculations is displayed as two distinct lines in a separate window:
- Trend Direction: The main line serves as a primary guide. When it moves upward, it suggests bullish (upward) momentum; when it moves downward, it suggests bearish (downward) momentum.
- Signal Sensitivity: Because the indicator uses smoothed data and volatility thresholds, it is designed to filter out "market noise"—those small, insignificant price wiggles that often lead to false signals in simpler indicators.
In essence, the QQE acts as a sophisticated filter that attempts to show the "true" underlying trend of an asset by balancing the speed of price movement against its overall stability.
//+------------------------------------------------------------------+
//|   Qualitative Quantitative Estimation Indicator for Metatrader 4 |
//|                                     Copyright © 2006Roman Ignatov |
//|                                   mailto:roman.ignatov@gmail.com |
//+------------------------------------------------------------------+
#property copyright "Copyright © 200 Roman Ignatov"
#property link      "mailto:roman.ignatov@gmail.com"
//----
#property indicator_separate_window
#property indicator_buffers 2
#property indicator_color1 Navy
#property indicator_style1 STYLE_SOLID
#property indicator_width1 2
#property indicator_color2 Navy
#property indicator_style2 STYLE_DOT
//----
extern int SF=5;
//----
int RSI_Period=14;
int Wilders_Period;
int StartBar;
//----
double TrLevelSlow[];
double AtrRsi[];
double MaAtrRsi[];
double Rsi[];
double RsiMa[];
//+------------------------------------------------------------------+
//|                                                                  |
//+------------------------------------------------------------------+
int init()
  {
   Wilders_Period=RSI_Period * 2 - 1;
   if (Wilders_Period < SF)
      StartBar=SF;
   else
      StartBar=Wilders_Period;
//----
   IndicatorBuffers(6);
   SetIndexBuffer(0, RsiMa);
   SetIndexStyle(0, DRAW_LINE, STYLE_SOLID, 2);
   SetIndexLabel(0, "Value 1");
   SetIndexDrawBegin(0, StartBar);
   SetIndexStyle(1, DRAW_LINE, STYLE_DOT);
   SetIndexBuffer(1, TrLevelSlow);
   SetIndexLabel(1, "Value 2");
   SetIndexDrawBegin(1, StartBar);
   SetIndexBuffer(2, AtrRsi);
   SetIndexBuffer(3, MaAtrRsi);
   SetIndexBuffer(4, Rsi);
   IndicatorShortName(StringConcatenate("QQE(", SF, ")"));
   return(0);
  }
//+------------------------------------------------------------------+
//|                                                                  |
//+------------------------------------------------------------------+
int start()
  {
   int counted, i;
   double rsi0, rsi1, dar, tr, dv;
//----
   if(Bars<=StartBar)
      return(0);
//----
   counted=IndicatorCounted();
   if(counted < 1)
      for(i=Bars - StartBar; i < Bars; i++)
        {
         TrLevelSlow[i]=0.0;
         AtrRsi[i]=0.0;
         MaAtrRsi[i]=0.0;
         Rsi[i]=0.0;
         RsiMa[i]=0.0;
        }
   counted=Bars - counted - 1;
//----
   for(i=counted; i>=0; i--)
      Rsi[i]=iRSI(NULL, 0, RSI_Period, PRICE_CLOSE, i);
   for(i=counted; i>=0; i--)
     {
      RsiMa[i]=iMAOnArray(Rsi, 0, SF, 0, MODE_EMA, i);
      AtrRsi[i]=MathAbs(RsiMa[i + 1] - RsiMa[i]);
     }
   for(i=counted; i>=0; i--)
      MaAtrRsi[i]=iMAOnArray(AtrRsi, 0, Wilders_Period, 0, MODE_EMA, i);
   i=counted + 1;
   tr=TrLevelSlow[i];
   rsi1=iMAOnArray(Rsi, 0, SF, 0, MODE_EMA, i);
   while(i > 0)
     {
      i--;
      rsi0=iMAOnArray(Rsi, 0, SF, 0, MODE_EMA, i);
      dar=iMAOnArray(MaAtrRsi, 0, Wilders_Period, 0, MODE_EMA, i) * 4.236;
      dv=tr;
      if (rsi0 < tr)
        {
         tr=rsi0 + dar;
         if (rsi1 < dv)
            if (tr > dv)
               tr=dv;
        }
      else if (rsi0 > tr)
           {
            tr=rsi0 - dar;
            if (rsi1 > dv)
               if (tr < dv)
                  tr=dv;
           }
      TrLevelSlow[i]=tr;
      rsi1=rsi0;
     }
//----
   return(0);
  }
//+------------------------------------------------------------------+
Comments