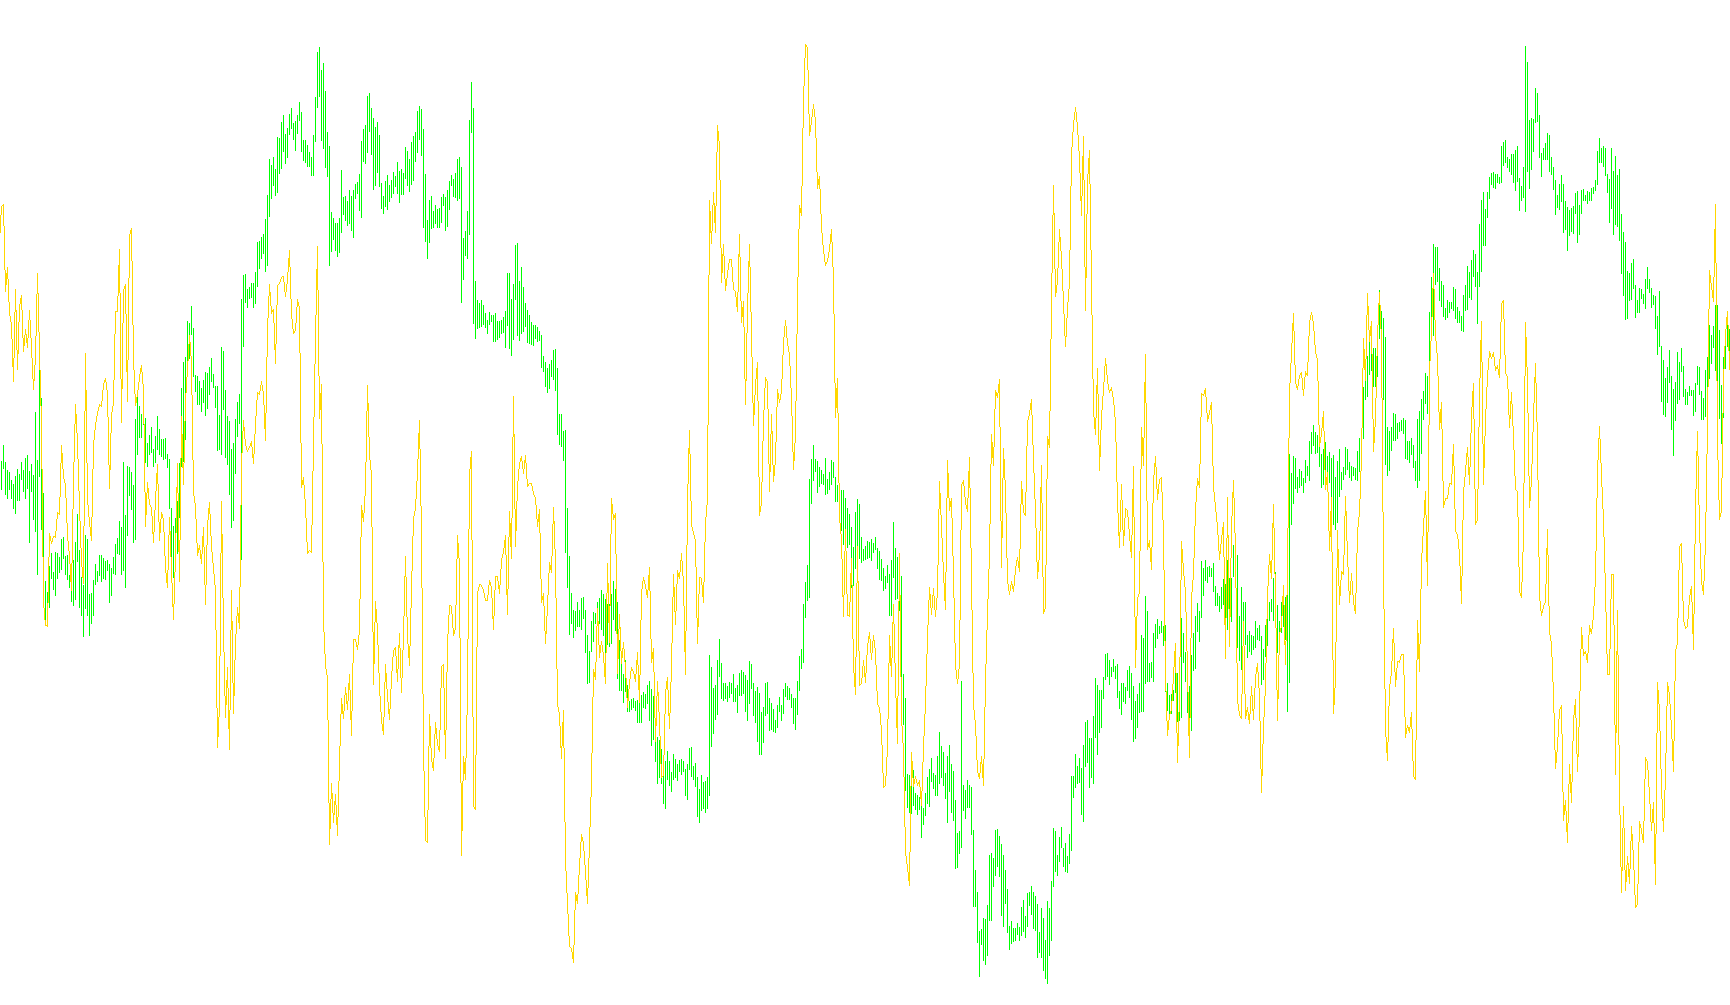
This technical indicator, known as the Pivot Detector Oscillator, is designed to provide traders with a visual representation of market momentum by analyzing price trends and relative strength. Rather than showing simple price movements, it filters out "noise" to highlight specific trend directions and potential turning points.
Core Logic Overview
The tool operates by combining three distinct types of market data: the current price action, a long-term moving average, and a Relative Strength Index (RSI). It uses these components to categorize the market into "Upward" or "Downward" regimes and then scales the resulting momentum onto a 0–100 scale for easier interpretation.
How it Works
The script follows a systematic three-step process to determine the value displayed on your chart:
1. Trend Identification First, the indicator looks at the relationship between the current market price and a long-term average (set by default to 200 periods).
- If the current price is trading above this long-term average, the tool assumes the market is in an Upward Trend.
- If the price is trading below that average, it assumes the market is in a Downward Trend.
2. Momentum Calculation Once the trend is identified, the indicator pulls data from the RSI (Relative Strength Index), which measures the speed and change of price movements. However, instead of showing the raw RSI value, the tool applies a specific mathematical formula based on the detected trend:
- In an Upward Trend, it focuses on a specific "entry" and "exit" zone (e.g., between 35 and 85). It calculates how far the current momentum has moved within this range.
- In a Downward Trend, it shifts its focus to a different set of zones (e.g., between 20 and 70) to measure the strength of the decline.
3. Normalization (The Oscillator) Finally, the indicator converts these calculations into a standardized percentage-like value displayed in a separate window. By "normalizing" the data, it allows you to see whether the current momentum is becoming overextended or if it is gaining strength relative to the prevailing trend.
Summary for the User
Essentially, this tool tells you not just where the price is going, but how strongly it is moving in that direction. By distinguishing between up-trend momentum and down-trend momentum, it helps traders identify when a move is healthy or when it may be reaching a point of exhaustion based on the pre-defined thresholds.
//+------------------------------------------------------------------+
//|                                        pivot detector oscillator |
//|                                                                  |
//| developed by Giorgos Siligardos,                                 |
//| published in TASC, September, 2009                               |
//+------------------------------------------------------------------+
#property copyright "copyleft mladen"
#property link      "mladenfx@gmail.com"

#property indicator_separate_window
#property indicator_buffers    1
#property indicator_color1     DeepSkyBlue
#property indicator_width1     2
#property indicator_level1     0
#property indicator_level2     100
#property indicator_levelcolor DimGray


//
//
//
//
//

extern int pdoPrice          = PRICE_CLOSE;
extern int pdoRsiLength      = 14;
extern int pdoAverageLength  = 200;
extern int pdoUpTrendEntry   = 35;
extern int pdoUpTrendExit    = 85;
extern int pdoDownTrendEntry = 20;
extern int pdoDownTrendExit  = 70;

double pdo[];

//+------------------------------------------------------------------+
//|                                                                  |
//+------------------------------------------------------------------+
//
//
//
//
//

int init()
{
   SetIndexBuffer(0,pdo);
   IndicatorShortName("pdo ("+pdoRsiLength+","+pdoAverageLength+","+pdoUpTrendEntry+","+pdoUpTrendExit+","+pdoDownTrendEntry+","+pdoDownTrendExit+")");
   return(0);
}
int deinit() { return(0); }
int start()
{
   int i,limit;
   int counted_bars=IndicatorCounted();
   if (counted_bars>0) counted_bars--;
            limit=MathMin(Bars-counted_bars,Bars-1);

   //
   //
   //
   //
   //

   for(i=limit; i>=0; i--)
   {
      double rsi   = iRSI(NULL,0,pdoRsiLength,pdoPrice,i);
      double avg   = iMA(NULL,0,pdoAverageLength,0,MODE_SMA,pdoPrice,i);
      double price = iMA(NULL,0,1               ,0,MODE_SMA,pdoPrice,i);

      if (price>avg)
            pdo[i] = 100*(rsi-pdoUpTrendEntry)/(pdoUpTrendExit-pdoUpTrendEntry);
      else  pdo[i] = 100*(rsi-pdoDownTrendEntry)/(pdoDownTrendExit-pdoDownTrendEntry);
   }
   return(0);
}
Comments