R2_Arrows_v2
Download script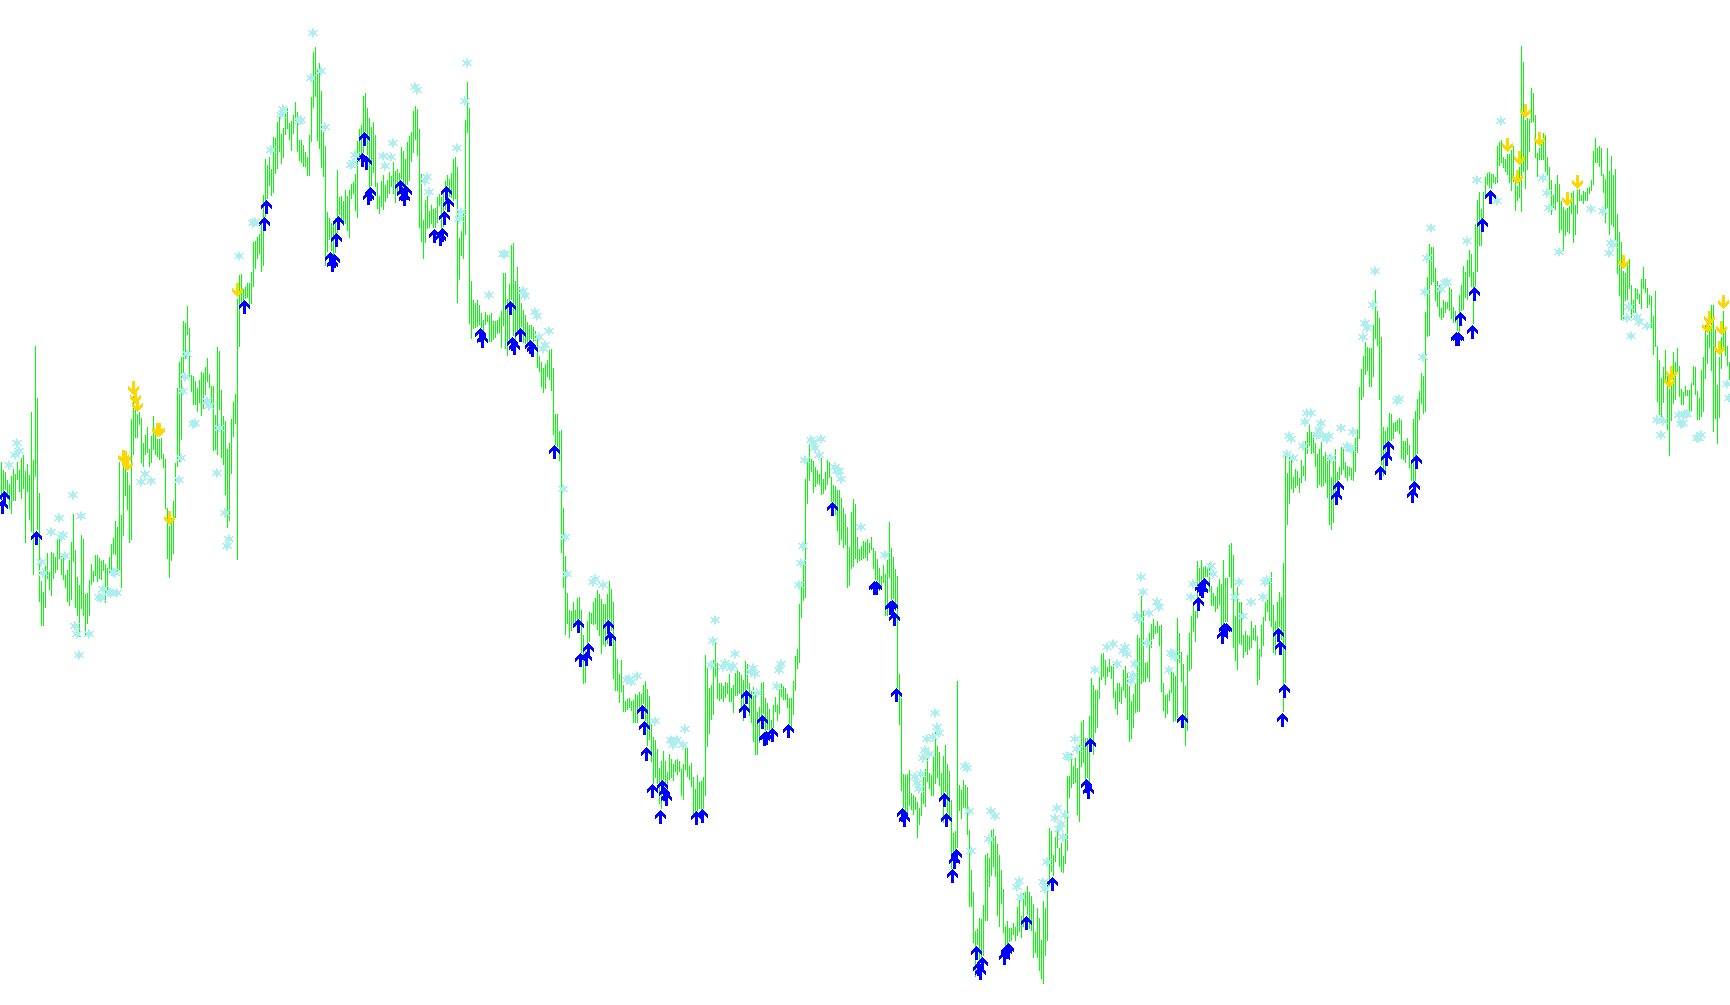
This custom indicator for MetaTrader is designed to identify potential trading opportunities and exit signals by analyzing two primary market factors: the long-term price trend and short-term momentum shifts. It translates complex technical data into visual cues (arrows) directly on your chart to help navigate market movements.
Core Trading Logic
The tool operates based on three distinct categories of signals:
1. Sell Signals (Bearish Momentum) The script identifies potential opportunities to sell when three specific conditions align simultaneously:
- Trend Confirmation: The current closing price must be trading below a long-term moving average. This ensures the tool is only looking for "sells" during a primary downward trend.
- Momentum Surge: It monitors a momentum indicator (RSI) to see if it has crossed above a specific high threshold.
- Sequential Growth: Crucially, the tool looks for three consecutive days of increasing momentum. This suggests that the selling pressure is accelerating rather than just fluctuating.
2. Buy Signals (Bullish Momentum) Conversely, the script identifies potential opportunities to buy when these conditions are met:
- Trend Confirmation: The current closing price must be trading above a long-term moving average, indicating a primary upward trend.
- Momentum Drop: It monitors the momentum indicator to see if it has dropped below a specific low threshold.
- Sequential Decline: Similar to the sell logic, it looks for three consecutive days of decreasing momentum values. This suggests that the buying interest is gaining strength in a steady pattern.
3. Trade Exit Markers Beyond just entering trades, the script provides visual "Close" markers to help traders identify when a move might be reaching an exhaustion point:
- For Sells: If the price is in a downward trend but the momentum indicator drops significantly low, it suggests the downward move may be overextended.
- For Buys: If the price is in an upward trend but the momentum indicator rises significantly high, it suggests the upward move may be reaching a peak.
Technical Foundation
The logic is built upon a "Day" timeframe analysis, meaning it looks at historical daily data to provide signals. By combining a slow-moving average (to define the "big picture") with a fast-moving momentum oscillator (to define the "immediate move"), the indicator attempts to filter out market noise and highlight points where short-term speed aligns with long-term direction.
//+------------------------------------------------------------------+
//|                                                 R2_Arrows_v2.mq4 |
//|            Copyright © 2006, transport_david , David W Honeywell |
//|                                     hellonwheels.trans@gmail.com |
//+------------------------------------------------------------------+

#property copyright "transport_david , David W Honeywell"
#property link      "hellonwheels.trans@gmail.com"

#property indicator_chart_window
#property indicator_buffers 3
#property indicator_color1 Coral
#property indicator_color2 White
#property indicator_color3 SlateGray

//---- input parameters

extern int Trend_Ma_Periods    = 200;
extern int RsiPeriods          =   2;
extern int Applied_Price       =   0;
extern string s1 = "---------------";
extern int BuyIfRsiBelow       =  65;
extern int SellIfRsiAbove      =  35;
extern string s2 = "---------------";
extern int CloseBuyIfRsiAbove  =  75;
extern int CloseSellIfRsiBelow =  25;

//---- buffers

double ExtMapBuffer0[];
double ExtMapBuffer1[];
double ExtMapBuffer2[];

//+------------------------------------------------------------------+
//| Custom indicator initialization function                         |
//+------------------------------------------------------------------+

int init()
  {
//---- indicators

   IndicatorBuffers(3);

   SetIndexEmptyValue(0,0.0);
   SetIndexStyle(0,DRAW_ARROW);
   SetIndexArrow(0,234);
   SetIndexBuffer(0,ExtMapBuffer0);

   SetIndexEmptyValue(1,0.0);
   SetIndexStyle(1,DRAW_ARROW);
   SetIndexArrow(1,233);
   SetIndexBuffer(1,ExtMapBuffer1);

   SetIndexEmptyValue(2,0.0);
   SetIndexStyle(2,DRAW_ARROW);
   SetIndexArrow(2,172);
   SetIndexBuffer(2,ExtMapBuffer2);

   IndicatorShortName("R2_Arrows_v2");

//----
   return(0);
  }

//+------------------------------------------------------------------+
//| Custor indicator deinitialization function                       |
//+------------------------------------------------------------------+

int deinit()
  {
//----

//----
   return(0);
  }

//+------------------------------------------------------------------+
//| Custom indicator iteration function                              |
//+------------------------------------------------------------------+

int start()
  {

//----
   for (int i=Bars-50; i>=0; i--)
      {

      double prevtime;
      if (prevtime != Time[0]) { RefreshRates(); prevtime=Time[0]; }

      double Trend_Ma = iMA(Symbol(),PERIOD_D1,Trend_Ma_Periods,0,MODE_SMA,Applied_Price,i);

      double Day1 = iRSI(Symbol(),PERIOD_D1,RsiPeriods,Applied_Price,i+3);
      double Day2 = iRSI(Symbol(),PERIOD_D1,RsiPeriods,Applied_Price,i+2);
      double Day3 = iRSI(Symbol(),PERIOD_D1,RsiPeriods,Applied_Price,i+1);

      //- Sell Arrows ---
      if ( (Close[i+1] < Trend_Ma) && (Day1 > SellIfRsiAbove) && (Day2 > Day1) && (Day3 > Day2) )
         ExtMapBuffer0[i]=High[i]+(20*Point);//High arrow Sell

      //- Buy Arrows ---
      if ( (Close[i+1] > Trend_Ma) && (Day1 < BuyIfRsiBelow) && (Day2 < Day1) && (Day3 < Day2) )
         ExtMapBuffer1[i]=Low[i]-(20*Point);//Low arrow Buy

      //- Close Trades Marker ---
      if ( (Close[i+1] < Trend_Ma) && (Day3 < CloseSellIfRsiBelow) )
         ExtMapBuffer2[i]=Low[i]-(50*Point);

      if ( (Close[i+1] > Trend_Ma) && (Day3 > CloseBuyIfRsiAbove) )
         ExtMapBuffer2[i]=High[i]+(50*Point);

      }

//----
   return(0);
  }
//+------------------------------------------------------------------+
Comments