my_squeeze_Light_001
Download script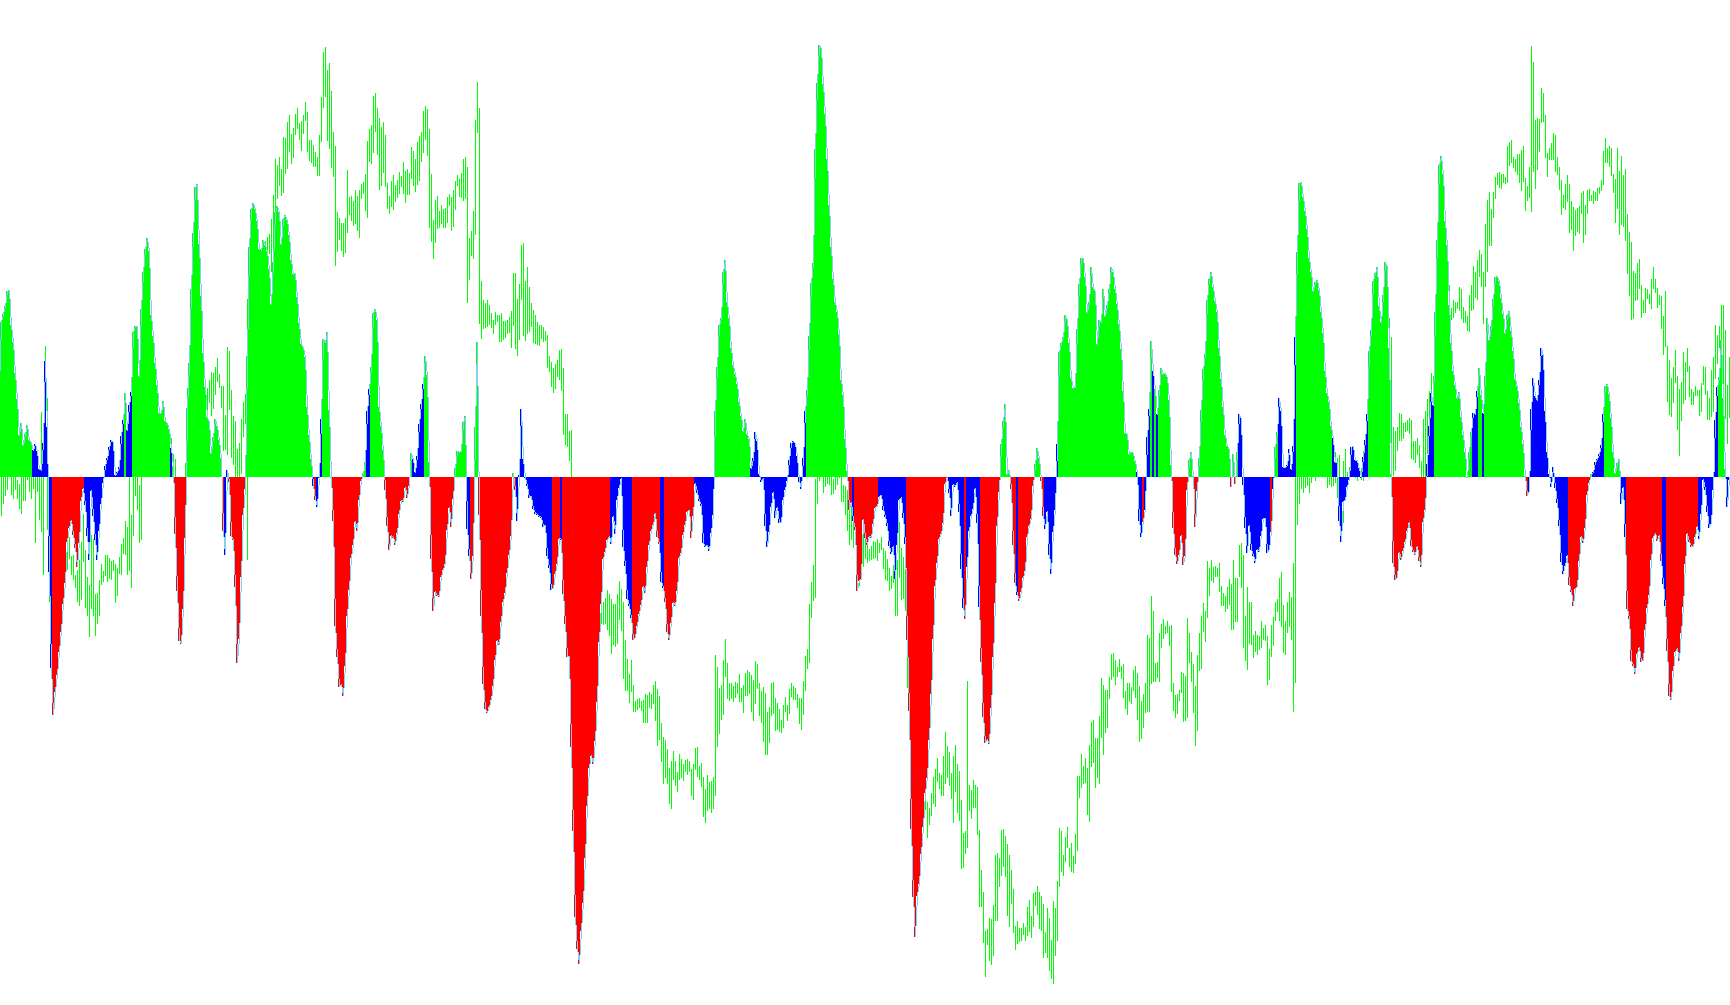
The Bollinger Squeeze v9 is a specialized trading indicator designed to help traders identify periods of low market volatility—often referred to as "squeezes"—which frequently precede significant explosive price movements. By combining the principles of Bollinger Bands with various momentum oscillators, it provides a visual tool to distinguish between "quiet" consolidation phases and active market trends.
Core Logic Overview
The indicator operates by monitoring two primary market conditions simultaneously: volatility (the "Squeeze") and momentum (the "Trigger").
1. Volatility Analysis (The Squeeze) The script calculates the relationship between the current market volatility and a historical average. It specifically compares the standard deviation of price movements against the Average True Range (ATR).
- When the market is extremely quiet and price action is compressed, the indicator identifies this as a "Squeeze."
- During these squeeze periods, the script generates specific visual markers (arrows) to alert the trader that the market may be preparing for a breakout.
2. Momentum Tracking (The Trigger) Unlike standard indicators that only show volatility, this tool allows you to select one of five different technical oscillators to determine the direction of the potential move. You can choose from:
- Stochastic
- CCI (Commodity Channel Index)
- RSI (Relative Strength Index)
- MACD (Moving Average Convergence Divergence)
- Momentum
The script takes the data from your chosen oscillator and plots it as a histogram. This tells you whether the underlying "pressure" in the market is currently leaning bullish (positive) or bearish (negative).
How the Components Interact
The script categorizes market activity into different visual states based on how these two forces interact:
- Active Trends: When volatility is high and the momentum is positive, the indicator highlights the bullish strength. Conversely, if volatility is high but momentum is negative, it highlights the bearish pressure.
- Squeeze States: If the volatility falls below a specific threshold (the "squeeze"), the indicator distinguishes these moments from normal trading. It effectively separates "normal" price movement from "coiled" spring movements.
- Visual Signaling: By using different colors and histogram types, the script separates active trend strength from squeezed potential, allowing you to see at a glance whether the market is moving, consolidating, or about to explode in a specific direction.
Summary for the Trader
In short, this tool acts as a "dual-filter" system. It filters for when a big move might happen (the Squeeze) and predicts which direction that move is likely to go (the Trigger). This helps reduce noise by highlighting significant structural changes in the market rather than every minor price fluctuation.
/*

*********************************************************************

                      Bollinger Squeeze v9
                  Original code by Nick Bilak
                   Modifications by Akuma99
                   Copyright © 2006  Akuma99
                  http://www.beginnertrader.com

       For help on this indicator, tutorials and information
               visit http://www.beginnertrader.com

   Trigger types: 1-stochastic, 2-cci, 3-rsi, 4-macd, 5-momentum

*********************************************************************

*/

#property copyright "Copyright © 2006, Akuma99"
#property link      "http://www.beginnertrader.com "

#property indicator_separate_window
#property indicator_buffers 6
#property indicator_color1 Lime
#property indicator_color2 Red
#property indicator_color3 Blue
#property indicator_color4 Blue
#property indicator_color5 Red
#property indicator_color6 SkyBlue

int       bolPrd=20;
double    bolDev=2.0;
int       keltPrd=20;
double    keltFactor=1.5;
extern int       triggerType=4;
extern int       stochPeriod_trigger1=14;
extern int       cciPeriod_trigger2=50;
extern int       rsiPeriod_trigger3=10;
extern int       macd_fastEMA_trigger4=5;
extern int       macd_slowEMA_trigger4=13;
extern int       macd_macdEMA_trigger4=1;
extern int       momentumPeriod_trigger5=14;

int       cciPeriod=50;

double upB[];
double loB[];
double upB2[];
double loB2[];
double mm[];
double histoLine[];
double arrowBuffer[];

int i,j,slippage=3;
double breakpoint=0.0;
double ema=0.0;
int peakf=0;
int peaks=0;
int valleyf=0;
int valleys=0, limit=0;
double ccis[61],ccif[61];
double delta=0;
double ugol=0;

int init() {

   IndicatorBuffers(6);

   SetIndexStyle(0,DRAW_HISTOGRAM,STYLE_SOLID,4,indicator_color1);
   SetIndexBuffer(0,upB);
   SetIndexEmptyValue(0,EMPTY_VALUE);

   SetIndexStyle(1,DRAW_HISTOGRAM,STYLE_SOLID,4,indicator_color2);
   SetIndexBuffer(1,loB);
   SetIndexEmptyValue(1,EMPTY_VALUE);

   SetIndexStyle(2,DRAW_HISTOGRAM,STYLE_SOLID,4,indicator_color3);
   SetIndexBuffer(2,upB2);
   SetIndexEmptyValue(2,EMPTY_VALUE);

   SetIndexStyle(3,DRAW_HISTOGRAM,STYLE_SOLID,4,indicator_color4);
   SetIndexBuffer(3,loB2);
   SetIndexEmptyValue(3,EMPTY_VALUE);

   SetIndexStyle(5,DRAW_LINE,0,1,indicator_color5);
   SetIndexBuffer(4,mm);

   SetIndexStyle(5,DRAW_LINE,0,1,indicator_color6);
   SetIndexBuffer(5,histoLine);

   SetIndexStyle(6,DRAW_ARROW);
   SetIndexArrow(6,159);
   SetIndexBuffer(6,arrowBuffer);

   return(0);

}

int deinit() {

   SetLevelValue(1,NULL);
   SetLevelValue(2,NULL);
   SetLevelValue(3,NULL);
   SetLevelValue(4,NULL);

}
int start() {

   int counted_bars=IndicatorCounted();
   int shift,limit;
   double diff,d,std,bbs;

   if (counted_bars<0) return(-1);
   if (counted_bars>0) counted_bars--;
   limit=Bars-31;
   if(counted_bars>=31) limit=Bars-counted_bars-1;

   for (shift=limit;shift>=0;shift--)   {

      switch (triggerType) {
         case 1:
         d=iStochastic(NULL,0,stochPeriod_trigger1,3,3,MODE_SMA,0,MODE_MAIN,shift)-50;
         SetLevelValue(1,30);
         SetLevelValue(2,-30);
         IndicatorShortName("Bollinger Squeeze with Stochastic ("+stochPeriod_trigger1+",3,3)");
         break;
         case 2:
         d=iCCI(NULL,0,cciPeriod_trigger2,PRICE_CLOSE,shift);
         SetLevelValue(1,-200);
         SetLevelValue(2,-100);
         SetLevelValue(3,100);
         SetLevelValue(4,200);
         IndicatorShortName("Bollinger Squeeze with CCI ("+cciPeriod_trigger2+",CLOSE)");
         break;
         case 3:
         d=iRSI(NULL,0,rsiPeriod_trigger3,PRICE_CLOSE,shift)-50;
         SetLevelValue(1,20);
         SetLevelValue(2,-20);
         IndicatorShortName("Bollinger Squeeze with RSI ("+rsiPeriod_trigger3+",CLOSE)");
         break;
         case 4:
         d=iMACD(NULL,0,5,13,1,PRICE_CLOSE,MODE_MAIN,shift);
         IndicatorShortName("Bollinger Squeeze with MACD (5,13,1,CLOSE)");
         mm[shift]=iMACD(NULL,0,macd_fastEMA_trigger4,macd_slowEMA_trigger4,macd_macdEMA_trigger4,PRICE_CLOSE,MODE_SIGNAL,shift);
         break;
         case 5:
         d=iMomentum(NULL,0,momentumPeriod_trigger5,PRICE_CLOSE,shift)-100;
         SetLevelValue(1,1);
         SetLevelValue(2,-1);
         IndicatorShortName("Bollinger Squeeze with Momentum ("+momentumPeriod_trigger5+",CLOSE)");
         break;
      }

      histoLine[shift]=d;

      if(d>0) {

         upB[shift]=d;

      } else if (d<0){

         loB[shift]=d;

      }

      diff = iATR(NULL,0,keltPrd,shift)*keltFactor;
      std = iStdDev(NULL,0,bolPrd,MODE_SMA,0,PRICE_CLOSE,shift);
      bbs = bolDev * std / diff;

      if(bbs<1) {

         arrowBuffer[shift] = High[shift]+15*Point;

         if (d > 0) {
            upB2[shift]=d;
            upB[shift]=0;
            loB[shift]=0;
            loB2[shift]=0;
         } else {
            loB2[shift]=d;
            loB[shift]=0;
            upB[shift]=0;
            upB2[shift]=0;
         }
      } else {

         if (d > 0) {
            upB[shift]=d;
            upB2[shift]=0;
            loB[shift]=0;
            loB2[shift]=0;
         } else {
            loB[shift]=d;
            loB2[shift]=0;
            upB[shift]=0;
            upB2[shift]=0;
         }
      }
   }

   return(0);

}
Comments