Regular RSI Div
Indicator

Regular RSI Div

iMAiMAOnArrayiRSI

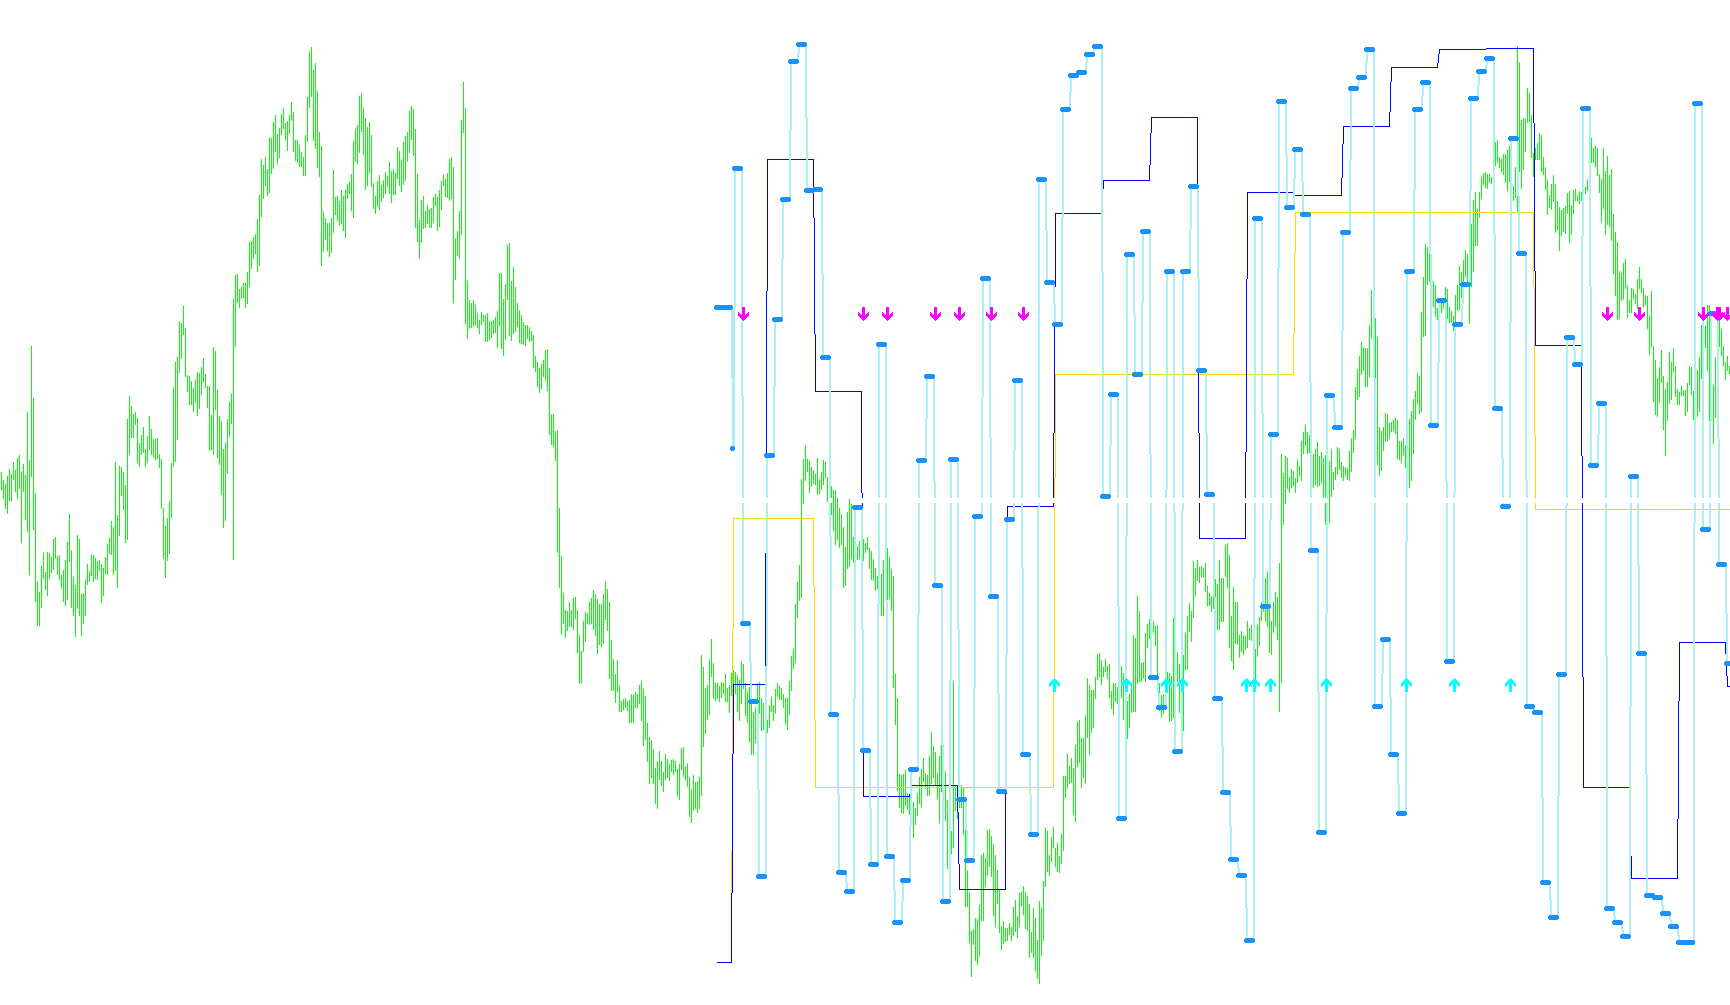
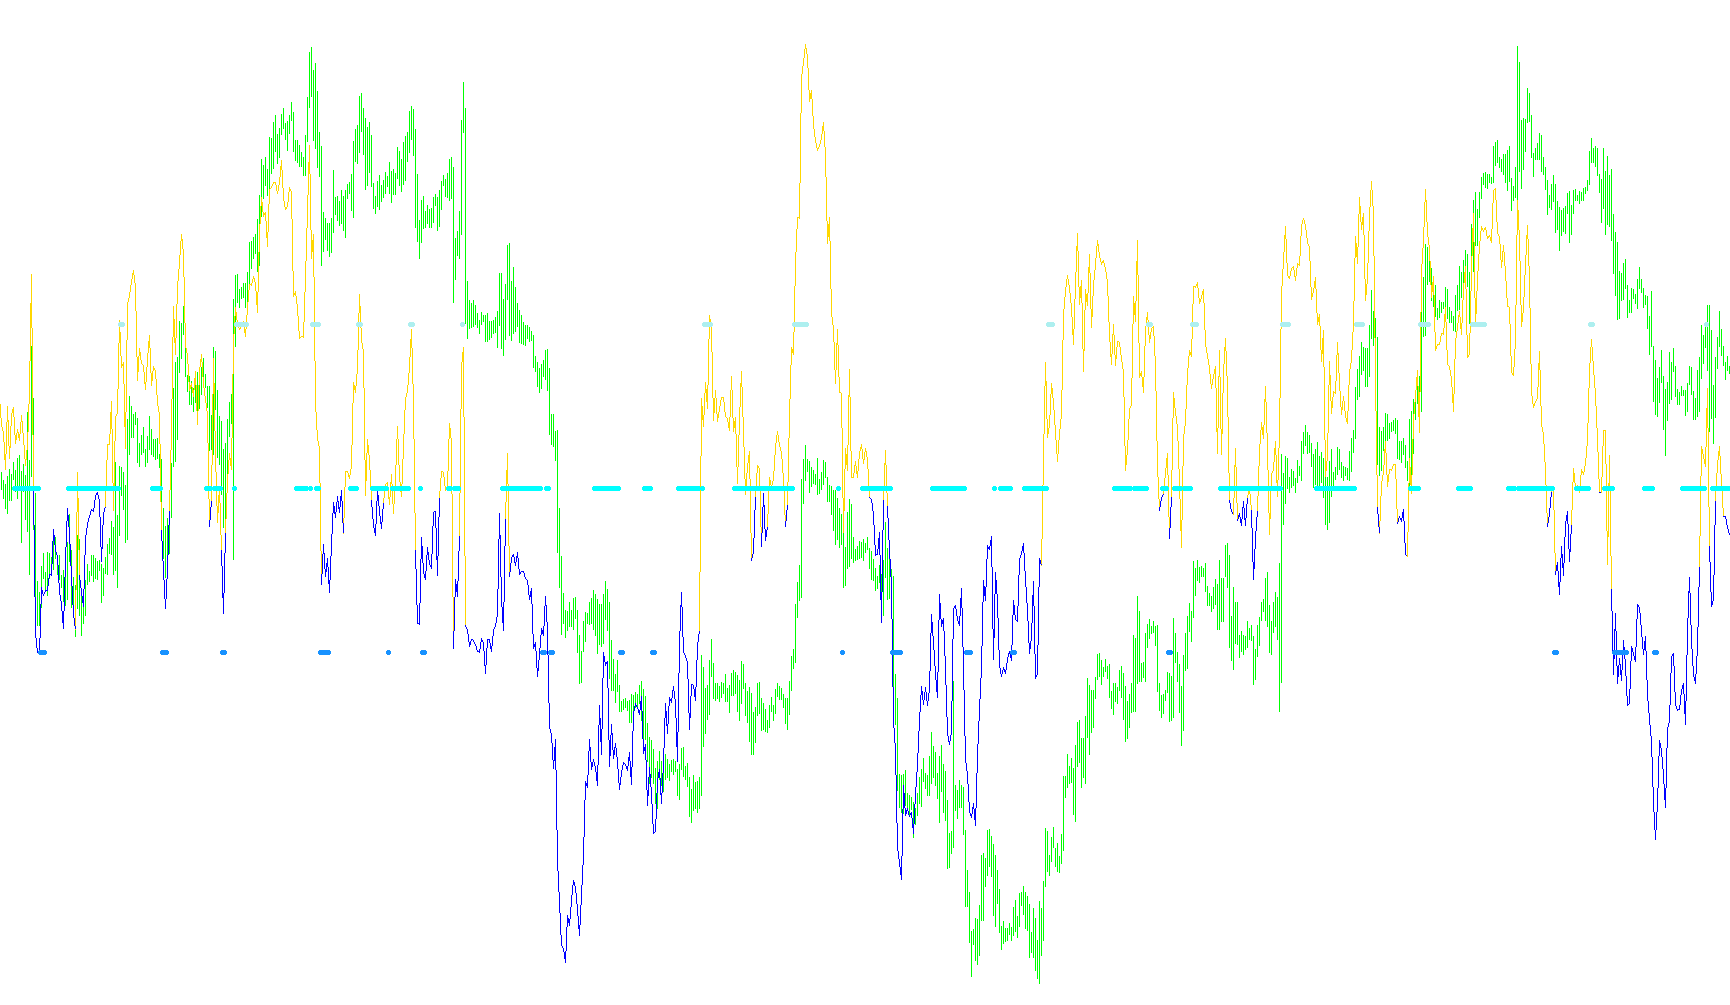
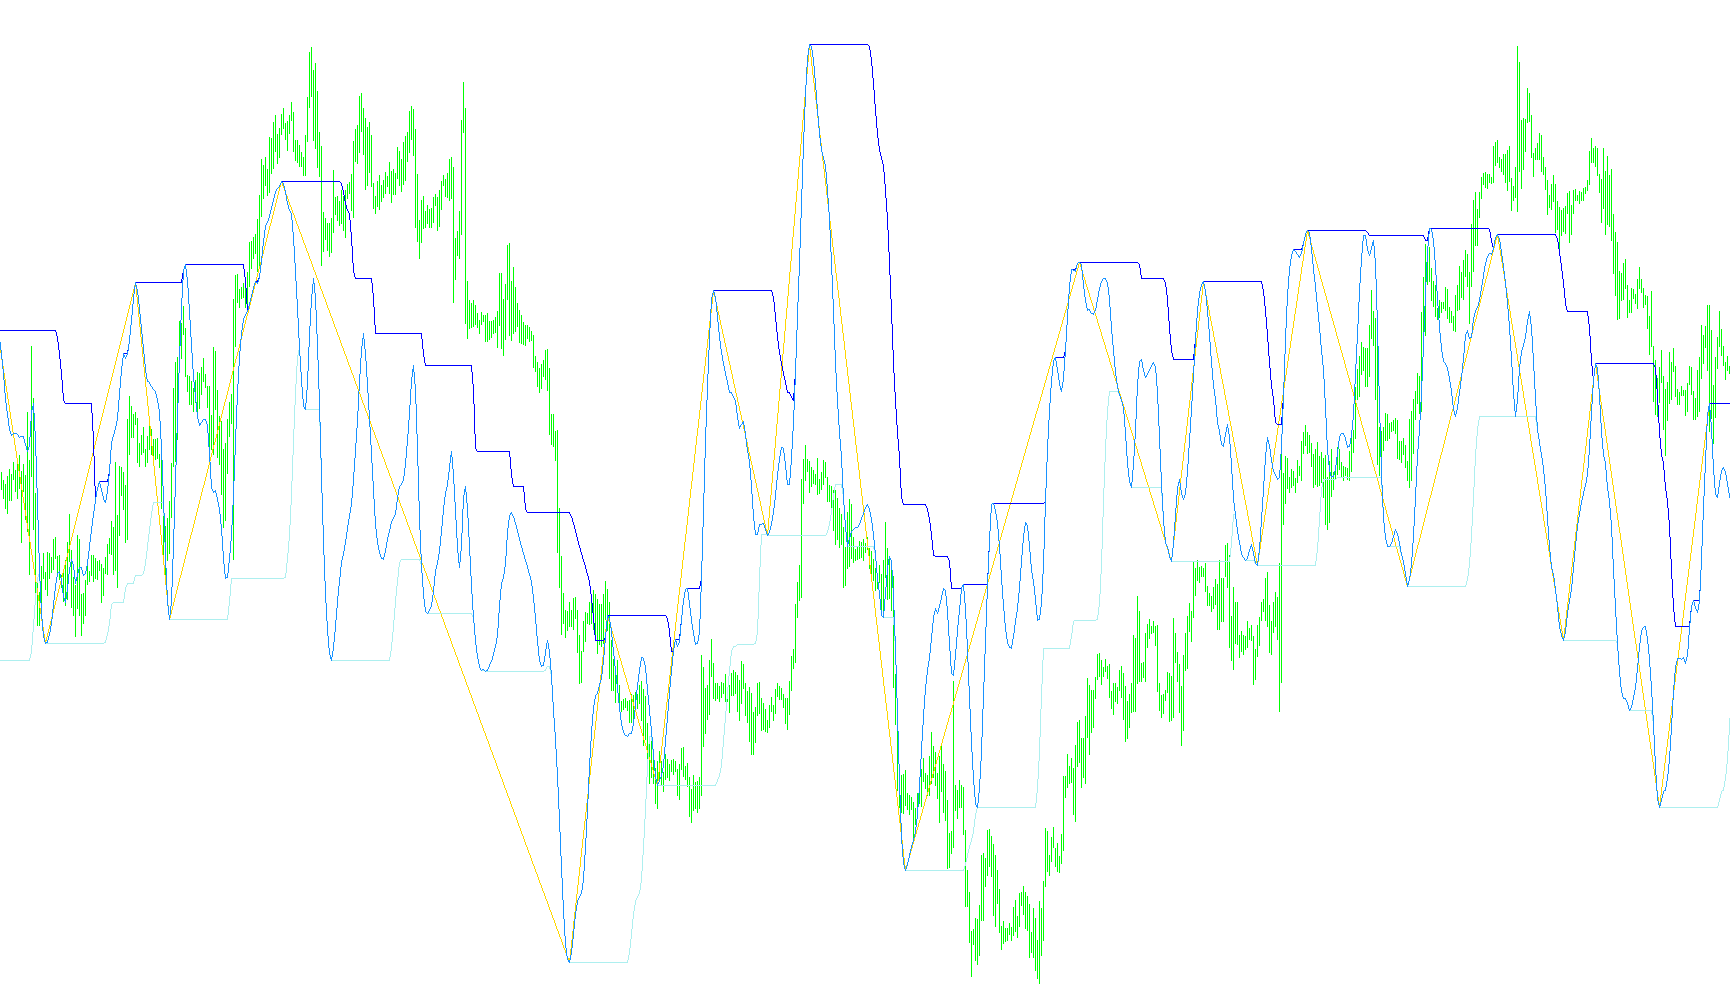
This indicator identifies structural market reversals by detecting geometric discrepancies between price action extremes and weighted RSI-based momentum oscillations.
RSI BAR CHARTv2
Indicator

RSI BAR CHARTv2

iRSI

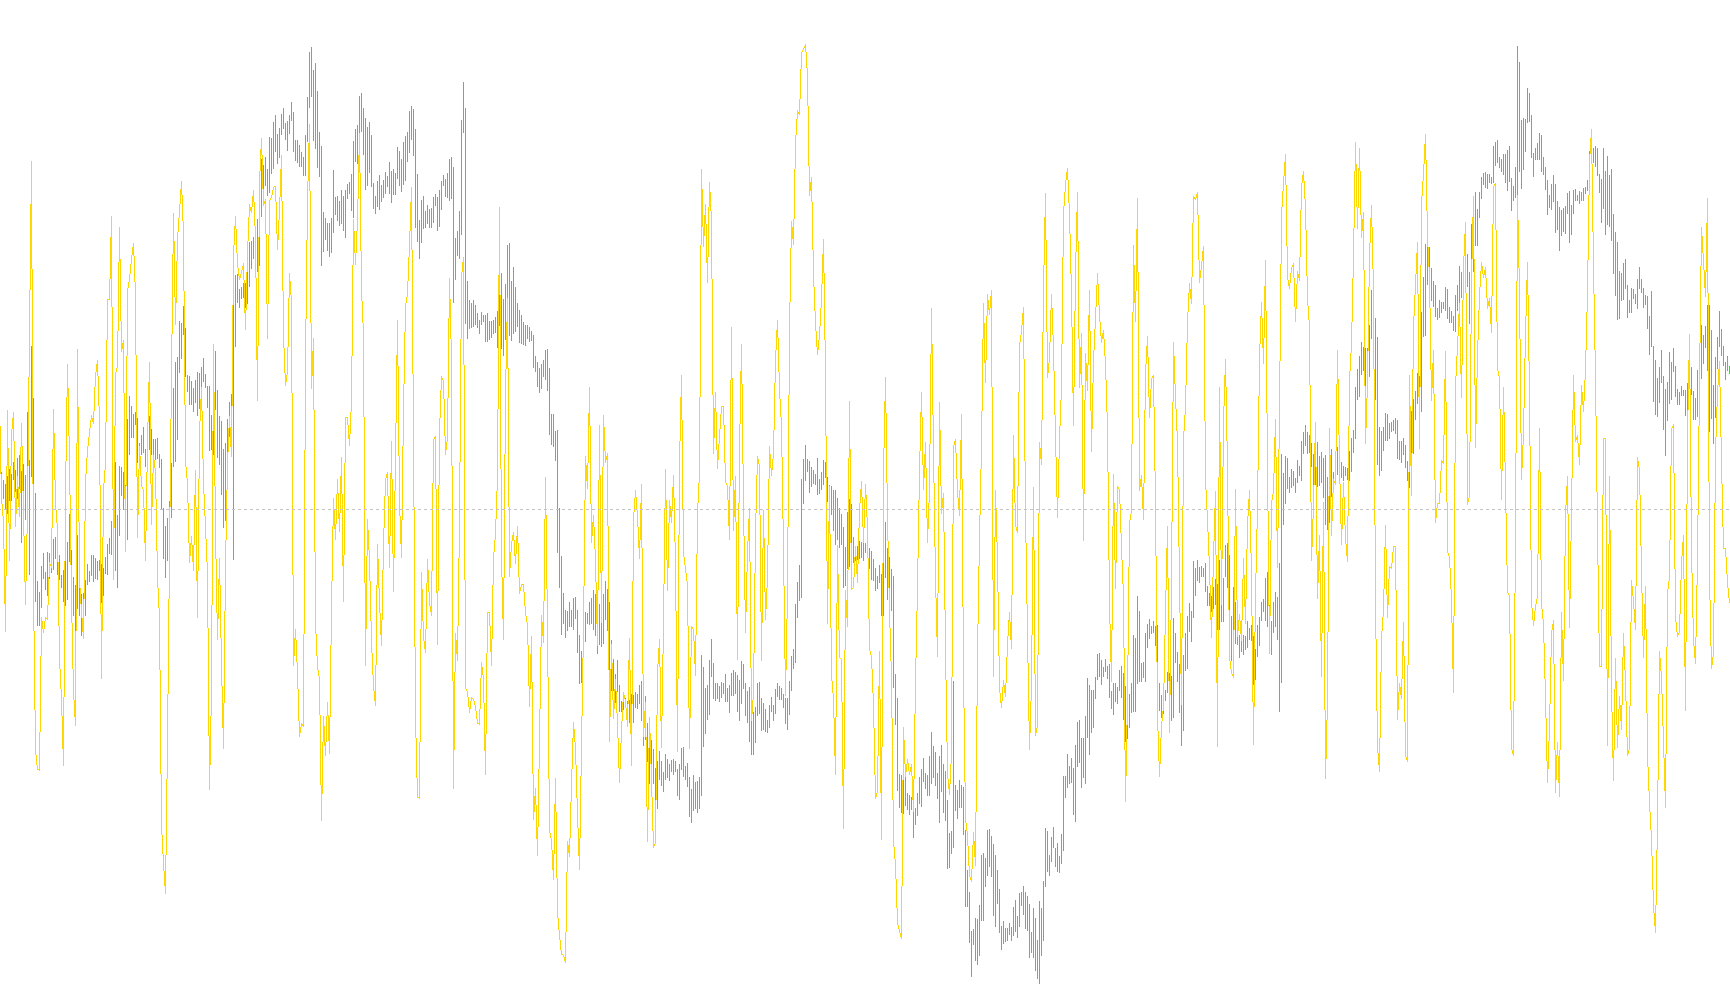
This indicator visualizes Relative Strength Index dynamics by constructing candlestick-style bars that represent price action sentiment within a separate sub-window.

RSI BNN Predictor
Indicator

RSI BNN Predictor

iRSI

This indicator utilizes a Backpropagation Neural Network (BPNN) to forecast future price action by training on normalized RSI data using Fibonacci-spaced historical delays.

RSI Candles
Indicator

RSI Candles

iRSI
Indicator

RSI CROSS

iRSI
Indicator

RSI CROSS1

iRSI
RSI HistoAlert v2
Indicator

RSI HistoAlert v2

iMAOnArrayiRSI

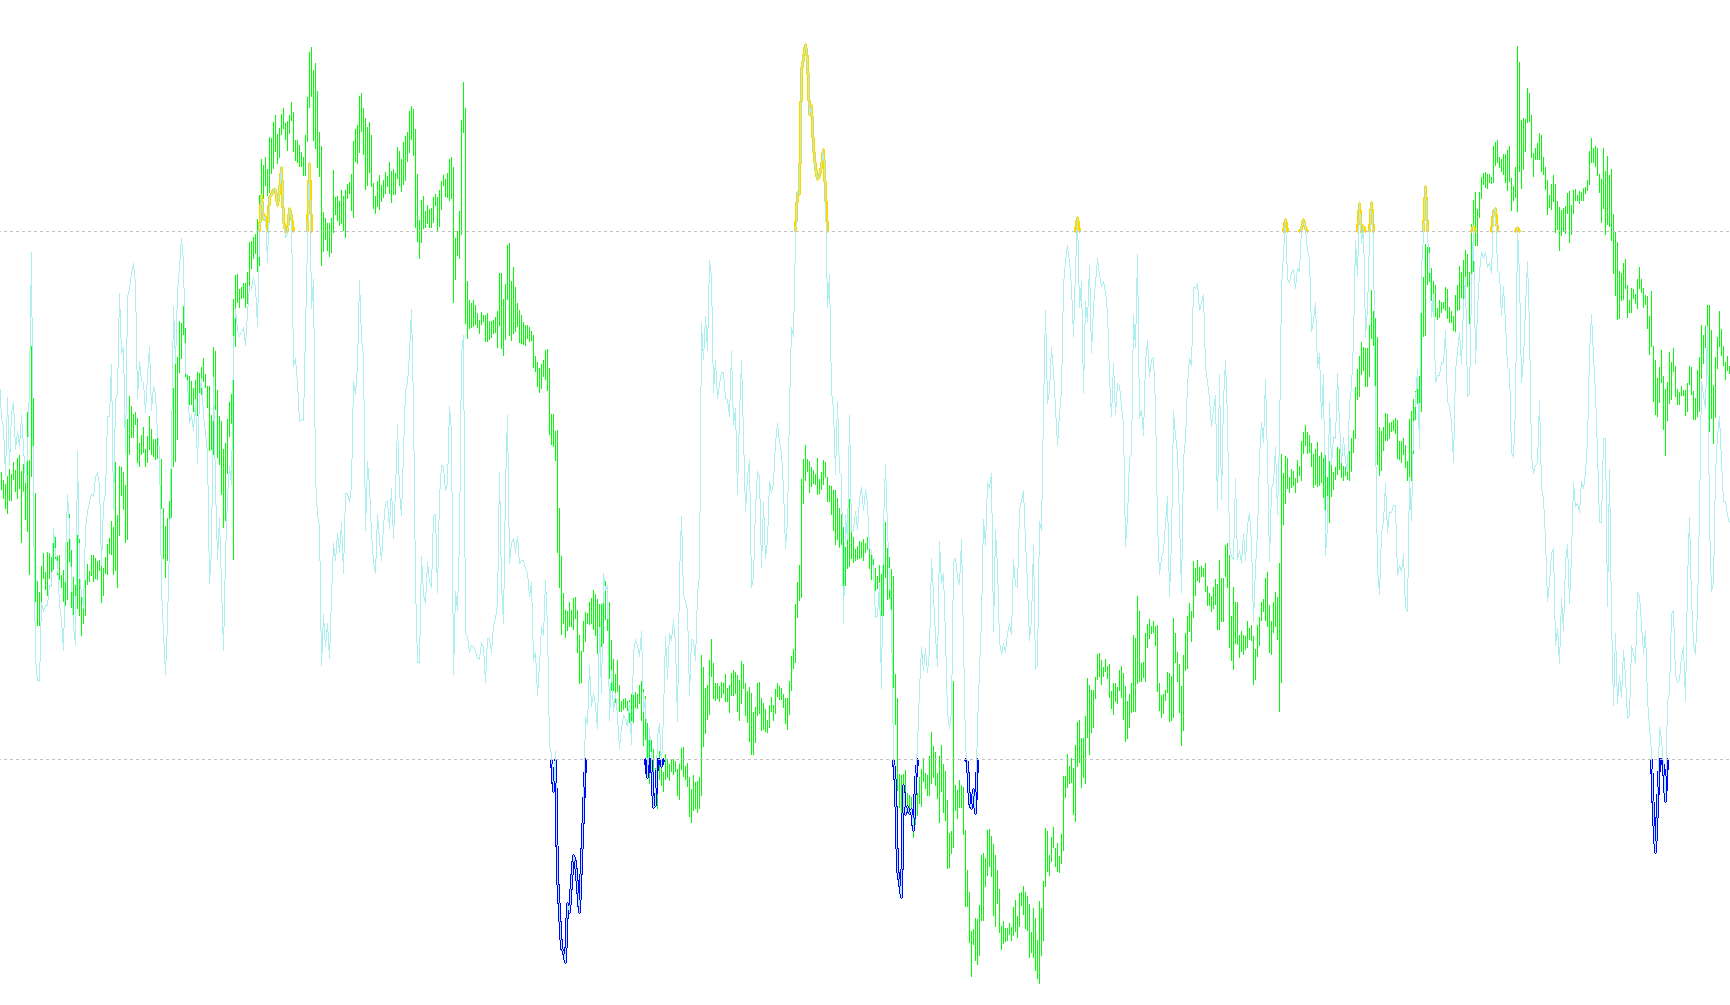
This indicator quantifies RSI price deviations into a zero-centered histogram to identify directional momentum shifts and extreme overbought/oversold thresholds.

Indicator

RSI THV

iRSI
RSI+MA+LABEL
Indicator

RSI+MA+LABEL

iMAOnArrayiRSI
RSI-2TF
Indicator

RSI-2TF

iRSI

This indicator overlays the current timeframe's Relative Strength Index with a higher timeframe RSI to identify multi-horizon price strength and potential divergence.

RSI-3TF
Indicator

RSI-3TF

iRSI

This indicator synchronizes Relative Strength Index values across multiple timeframes to identify overlapping momentum extremes and trend exhaustion.

RSI-3TF_ALERT_22
Indicator

RSI-3TF_ALERT_22

iRSI

This indicator identifies high-probability trend shifts by validating simultaneous Relative Strength Index (RSI) momentum alignment across three distinct multi-timeframe horizons.

RSI-3TF_v1
Indicator

RSI-3TF_v1

iRSI

This indicator synchronizes Relative Strength Index values across multiple timeframes to identify overlapping momentum trends and potential exhaustion zones.

Indicator

RSI-8_CROSS_Sound

iRSI
RSI-Alert
Indicator

RSI-Alert

iRSI

Monitors real-time Relative Strength Index fluctuations to trigger instantaneous notifications when price action breaches predefined overbought or oversold boundaries.

RSI-Alert_001
Indicator

RSI-Alert_001

iRSI

This script triggers real-time notifications when the Relative Strength Index crosses predefined high and low threshold boundaries to identify potential reversal points.

RSI-Alert_003
Indicator

RSI-Alert_003

iRSI

This indicator monitors the Relative Strength Index to trigger instantaneous notifications when momentum oscillates between predefined exhaustion boundaries.

RSI-Alert_004
Indicator

RSI-Alert_004

iRSI

This indicator identifies precise reversal points by monitoring when the Relative Strength Index crosses high-velocity overbought and oversold boundaries.

RSI-R2_voting_Ron3a
Indicator

RSI-R2_voting_Ron3a

iRSI

This indicator aggregates a plurality of relative strength index values across multiple timeframes to identify high-probability trend continuations based on sequential momentum shifts.

RSI-R2_voting_Ron4a
Indicator

RSI-R2_voting_Ron4a

iRSI

This indicator calculates a cumulative voting score by identifying sequential momentum shifts across multiple nested daily RSI periods to pinpoint high-probability trend reversals.

RSI-TC
Indicator

RSI-TC

iBandsiATRiMAiRSI
RSI-TC_001
Indicator

RSI-TC_001

iBandsiATRiMAiRSI
RSI-TC_NEW
Indicator

RSI-TC_NEW

iBandsiATRiMAiRSI
RSI-TC_NEW1
Indicator

RSI-TC_NEW1

iBandsiATRiMAiRSI

This indicator identifies high-probability trend reversals by detecting volatility expansion from a 'squeeze' state combined with multi-layered RSI momentum filtering.

RSI-TC_NEWd
Indicator

RSI-TC_NEWd

iBandsiATRiMAiRSI
RSI-TC_NEW[1]
Indicator

RSI-TC_NEW[1]

iBandsiATRiMAiRSI
RSI-TC_NEW_Alert2
Indicator

RSI-TC_NEW_Alert2

iBandsiATRiMAiRSI
RSI-TC_NEW_v2
Indicator

RSI-TC_NEW_v2

iBandsiATRiMAiRSI
RSI-TC_v1
Indicator

RSI-TC_v1

iBandsiATRiMAiRSI
Indicator

RSIArrows

iRSI
RSIFilter_v1
Indicator

RSIFilter_v1

iRSI

This indicator identifies trend reversals by monitoring RSI breaches of extreme boundaries and maintains visual signals based on secondary momentum levels.

RSIFilter_v1_001
Indicator

RSIFilter_v1_001

iRSI
RSIFilter_v1_v1
Indicator

RSIFilter_v1_v1

iRSI
RSIFilter_v1_v2
Indicator

RSIFilter_v1_v2

iRSI
RSIFilter_v1_v3
Indicator

RSIFilter_v1_v3

iRSI

This indicator identifies directional bias by capturing RSI extremes and validating trend persistence through specific overbought/oversold corridor thresholds.

RSI_2SigMAs_mtf
Indicator

RSI_2SigMAs_mtf

iMAOnArrayiRSI

This indicator calculates a Relative Strength Index on a higher timeframe and applies dual moving average smoothing to visualize momentum trends across multiple intervals.

RSI_2SigMA_mtf
Indicator

RSI_2SigMA_mtf

iMAOnArrayiRSI

This indicator calculates a Relative Strength Index across specified higher timeframes and applies nested moving average smoothing to filter out noise and identify primary momentum shifts.

rsi_2tf
Indicator

rsi_2tf

iRSI

This indicator synchronizes current timeframe price momentum with a higher temporal horizon to identify multi-layered trend strength and potential exhaustion points.

Rsi_Bands_B
Indicator

Rsi_Bands_B

iATRiRSI

This indicator projects asymmetrical price corridors by modulating a Moving Average with Weighted RSI values scaled by ATR-based volatility variance.

Rsi_Bands_B2
Indicator

Rsi_Bands_B2

iATRiRSI
RSI_C
Indicator

RSI_C

iRSI

This indicator isolates and visualizes specific RSI price movements that exceed predefined upper and lower volatility boundaries.

RSI_channel_
Indicator

RSI_channel_

iRSI

This indicator identifies trend extremes by applying a T3 smoothing filter to the Relative Strength Index and overlaying a dynamic volatility channel with integrated ZigZag structure identification.

RSI_channel_sig
Indicator

RSI_channel_sig

iATRiRSI

This indicator identifies trend reversals and momentum shifts by applying a T3 moving average filter to Relative Strength Index values within a dynamic high-low price channel.

RSI_channel_sig_2
Indicator

RSI_channel_sig_2

iATRiRSI

This indicator identifies momentum reversals by applying a T3 smoothing filter to the Relative Strength Index and detecting breaches of dynamically calculated high-low price channels.

RSI_CL
Indicator

RSI_CL

iRSI

This indicator monitors Relative Strength Index levels and dynamically renders colored horizontal line objects to visually flag persistent overbought or oversold conditions.

RSI_Coloured_Final
Indicator

RSI_Coloured_Final

iRSI

This indicator identifies and visualizes price momentum extremes by dynamically tracking and isolating instances where the Relative Strength Index penetrates pre-defined overbought and oversold boundaries.

RSI_Cross50_Alert
Indicator

RSI_Cross50_Alert

iRSI

The system triggers real-time notifications when the Relative Strength Index transitions through the neutral 50-level threshold, identifying shifts in market momentum.

Indicator

RSI_Crosses_Lib_Sample

iMAOnArrayiRSI
RSI_Crossing_50_plus_ATR_ver1.2_FXA0
Indicator

RSI_Crossing_50_plus_ATR_ver1.2_FXA0

iATRiRSI

This indicator identifies trend reversals and position additions by detecting RSI crossings at the 50 midline, using ATR-based volatility to project dynamic entry and stop-loss levels.

RSI_Cross_Alert
Indicator

RSI_Cross_Alert

iMAOnArrayiRSIiStochastic