iVAR_v1
Download script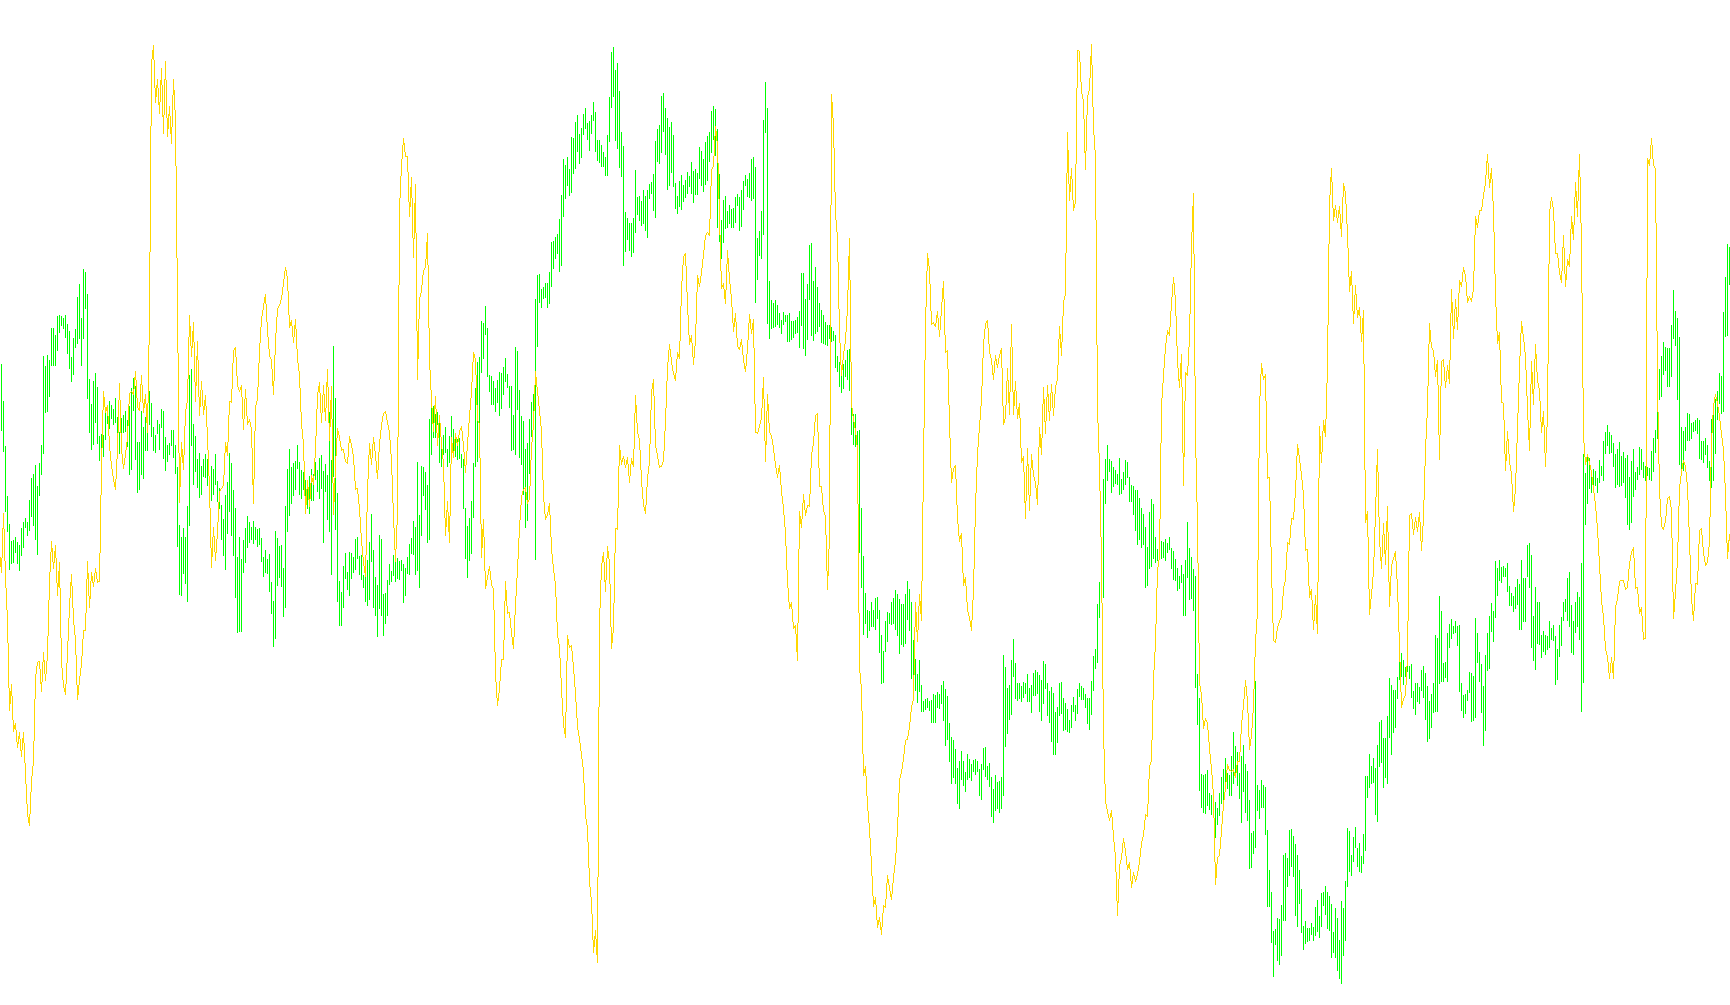
This script functions as a sophisticated mathematical tool designed to analyze the underlying structure of price movements. Rather than simply looking at whether the price is going up or down in the short term, it evaluates the "texture" of the market data to determine its fundamental nature.
How the Logic Works
The core objective of this tool is to distinguish between three distinct types of market behavior:
- Trending: Clear, sustained movements in a specific direction.
- Flat/Sideways: Movement that lacks significant direction but contains activity.
- Random: Price action that lacks any discernible pattern or predictable structure.
The Mathematical Process
To achieve this, the script performs the following steps:
- Multi-Scale Analysis: The tool doesn't just look at one timeframe. It breaks down the price data into various "intervals" based on powers of two (e.g., looking at very small chunks of time versus much larger chunks).
- Price Variation Measurement: For each of these intervals, the script calculates the difference between the highest and lowest prices. This measures the "volatility" or "spread" occurring at different scales.
- Logarithmic Mapping: The data collected from these different scales is then converted into a logarithmic scale. This allows the tool to compare very small price changes with very large ones on an equal footing, making it easier to see patterns that are otherwise hidden by market noise.
- Regression Analysis: Finally, the script applies a statistical method called "Least Squares Regression." It plots the relationship between the size of the time interval and the magnitude of the price variation.
How to Interpret the Results
The final output is a calculated Variation Index. This index represents the slope of the trend line generated by the regression analysis:
- If the index shows a strong lean toward one side, it indicates that the market has a dominant "trend" component.
- If the index remains neutral or sits near the center, it suggests the market is in a "flat" state or is behaving "randomly," meaning there is no significant organized movement currently forming.
In essence, this tool acts as a diagnostic lens, helping traders understand the quality of the current price action by stripping away minor fluctuations to see the underlying mathematical behavior of the asset.
//+------------------------------------------------------------------+
//| iVAR.mq4 |
//| (C)opyright © 2008, Ilnur |
//| http://www.metaquotes.net |
//+------------------------------------------------------------------+
// Èíäèêàòîð îòîáðàæàåò èíäåêñ âàðèàöèè öåíîâîãî ðÿäà, âû÷èñëåííîãî
// íà ìèíèìàëüíîì ïðåäøåñòâóþùåì èíòåðâàëå äëèíû 2^n. Èíäåêñ âàðèàöèè
// ïîêàçûâàåò, ÷òî ïðåîáëàäàåò âî âðåìåííîì ðÿäó òðåíäîâàÿ èëè ôëåòîâàÿ
// ñîñòàâëÿþùàÿ, èëè æå ðÿä âåäåò ñåáÿ ñëó÷àéíî.
// Ì.Ì. Äóáîâèêîâ è äð. - Ðàçìåðíîñòü ìèíèìàëüíîãî ïîêðûòèÿ è ëîêàëüíûé
// àíàëèç ôðàêòàëüíûõ âðåìåííûõ ðÿäîâ.
#property copyright "(C)opyright © 2008, Ilnur"
#property link "http://www.metaquotes.net"
//---- íàñòðîéêè èíäèêàòîðà
#property indicator_separate_window
#property indicator_buffers 1
#property indicator_color1 Red
#property indicator_level1 0.5
//---- âõîäíûå ïàðàìåòðû
extern int n = 5;
extern int nBars = 1000;
//---- áóôåð èíäèêàòîðà
double ibuffer[];
//+------------------------------------------------------------------+
//| Ôóíêöèÿ èíèöèàëèçàöèè èíäèêàòîðà |
//+------------------------------------------------------------------+
int init()
{
//---- íàñòðîéêà ïàðàìåòðîâ îòðèñîâêè
SetIndexBuffer(0,ibuffer);
SetIndexStyle(0,DRAW_LINE);
SetIndexDrawBegin(0,Bars-nBars);
SetIndexLabel(0,"iVAR");
//---- "êîðîòêîå èìÿ" îòîáðàæàåìîå â îêíå èíäèêàòîðà
IndicatorShortName("iVAR("+n+")");
return(0);
}
//+------------------------------------------------------------------+
//| Îñíîâíàÿ ôóíêöèÿ èíäèêàòîðà |
//+------------------------------------------------------------------+
int start()
{
int i, j, k, nTotal, nCountedBars = IndicatorCounted();
int ihigh, ilow, nInterval;
double Delta, Xñ, Yñ, Sx, Sy, Sxx, Sxy;
//---- ïîñëåäíèé ïîñ÷èòàííûé áàð áóäåò ïåðåñ÷èòàí
if(nCountedBars==0) nTotal = nBars;
if(nCountedBars>0) nTotal = Bars-nCountedBars-1;
//---- îñíîâíîé öèêë èíäèêàòîðà
for(j=nTotal; j>=0; j--)
{
Sx = 0; Sy = 0; Sxx = 0; Sxy = 0;
for(i=0; i<=n; i++)
{
nInterval = MathPow(2,n-i);
//---- ñóììèðóåì ðàçíèöû ìàêñèìàëüíîé è ìèíèìàëüíîé öåí íà èíòåðâàëå
for(Delta=0, k=0; k<MathPow(2,i); k++)
{
ihigh = iHighest(Symbol(),0,MODE_HIGH,nInterval,nInterval*k+j);
ilow = iLowest(Symbol(),0,MODE_LOW,nInterval,nInterval*k+j);
Delta += High[ihigh]-Low[ilow];
}
//---- âû÷èñëÿåì êîîðäèíàòû âàðèàöèè â äâîéíîì ëîãàðèôìè÷åñêîì ìàñøòàáå
Xñ = (n-i)*MathLog(2.0);
Yñ = MathLog(Delta);
//---- íàêàïëèâàåì äàííûå äëÿ íàõîæäåíèÿ êîýôôèöèåíòîâ ëèíèè ðåãðåññèè ñ ïîìîùüþ ÌÍÊ
Sx += Xñ;
Sy += Yñ;
Sxx += Xñ*Xñ;
Sxy += Xñ*Yñ;
}
//---- âû÷èñëÿåì èíäåêñ âàðèàöèè (êîýôôèöèåíò íàêëîíà ëèíèè ðåãðåññèè)
ibuffer[j] = -(Sx*Sy-(n+1)*Sxy)/(Sx*Sx-(n+1)*Sxx);
}
return(0);
}
Comments