JE_TwoPoleButterworthFilter
Download script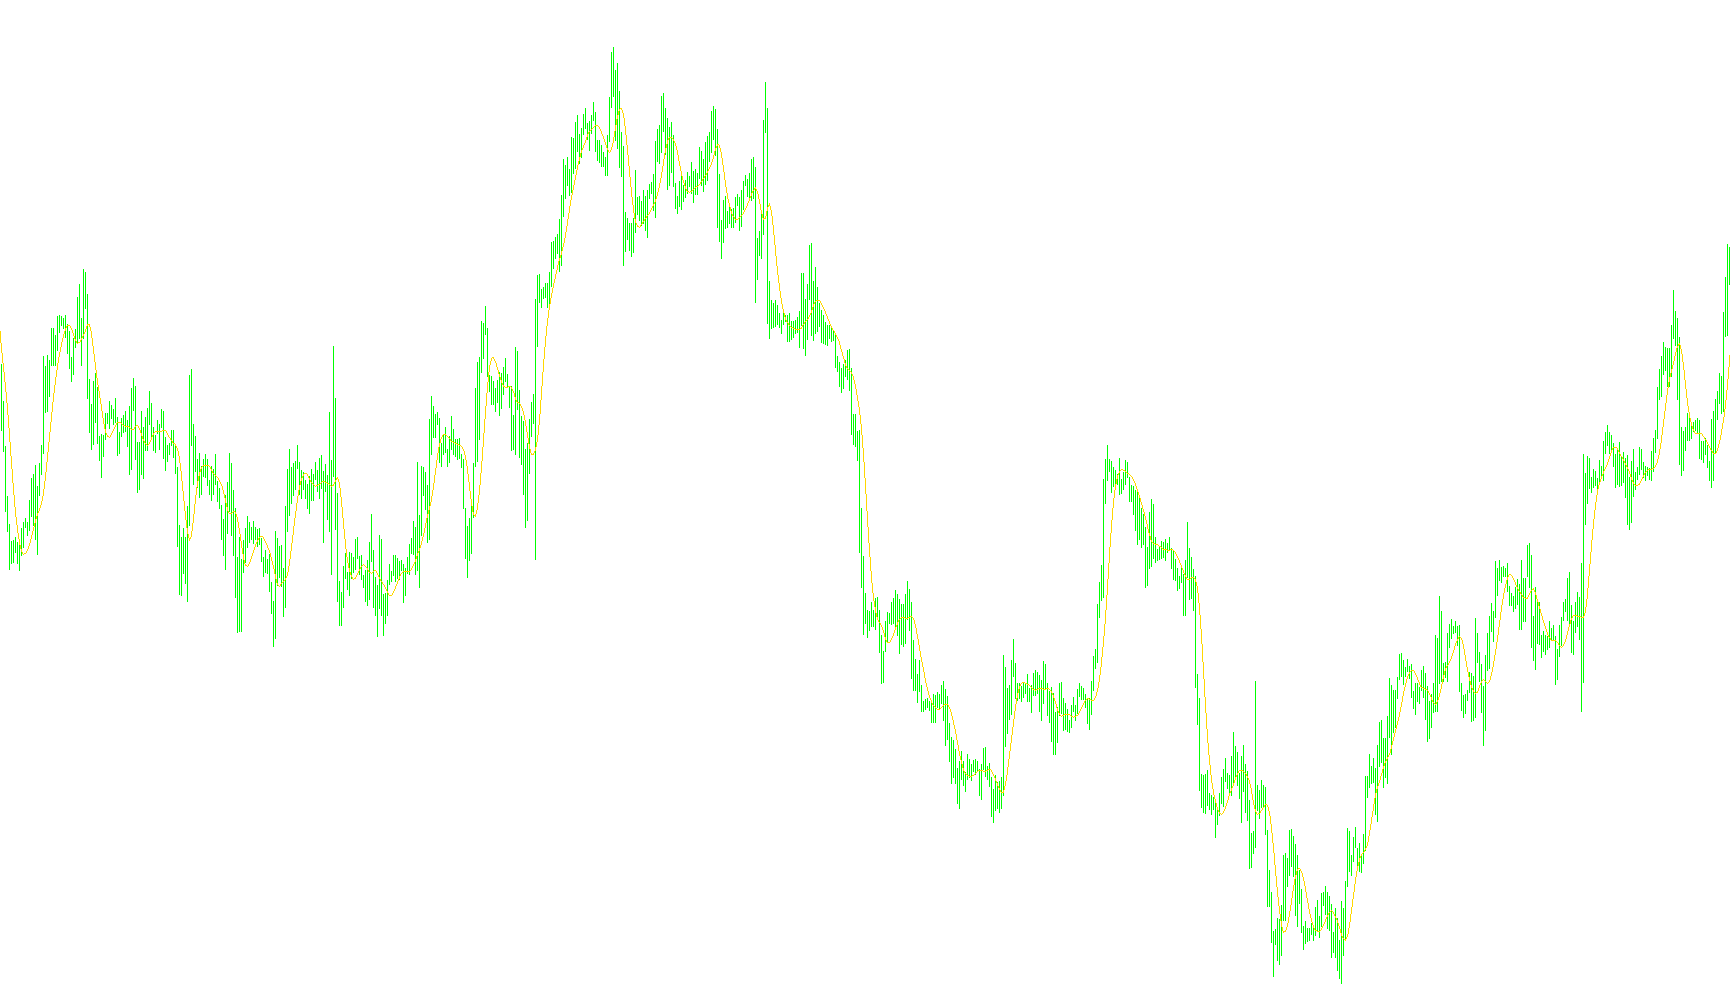
This technical indicator is designed to provide a smoother representation of price action on your trading chart by filtering out market "noise." It utilizes a specific mathematical approach known as a Two-Pole Butterworth Filter, which is highly regarded for its ability to remove erratic fluctuations while maintaining the integrity of the primary price trend.
How the Logic Works
1. Identifying the Core Price Data The indicator begins by looking at the most basic unit of price movement: the midpoint between the highest and lowest prices reached during each time period (the candle). By focusing on this center point rather than just the closing price, the filter establishes a more balanced baseline for its calculations.
2. The Filtering Mechanism (Smoothing) The primary goal of this script is to eliminate "jitter"—those small, rapid price movements that can often mislead traders about the actual direction of the market. It achieves this by applying a sophisticated weighting system:
- Look-Back Analysis: The indicator doesn't just look at where the price is right now; it examines the current midpoint along with the midpoints from the previous two periods.
- Weighted Averaging: It calculates a new value based on a blend of these historical points. This ensures that the resulting line moves more fluidly, resisting sudden spikes and reacting only to sustained shifts in price.
3. The "Cutoff" Concept The logic is governed by a user-defined "Cutoff Period." This acts as the sensitivity dial for the filter:
- A shorter period allows the indicator to react more quickly to recent price changes but remains more sensitive to noise.
- A longer period creates a much smoother line that ignores smaller fluctuations, focusing exclusively on the broader, long-term trend.
4. Mathematical Precision Behind the scenes, the script uses specific coefficients (pre-calculated during the initial setup) to ensure the curve is mathematically consistent. These coefficients determine exactly how much "weight" to give to past data versus current data, ensuring that the resulting red line on your chart represents a clean, continuous flow of price momentum.
Summary for the Trader
Essentially, this tool acts like a high-quality lens. It takes the chaotic, jagged movement of raw market prices and refines it into a smooth, readable path. By following the line generated by this filter, you can more easily identify the underlying trend of the market, making it easier to spot significant movements while staying shielded from minor, insignificant price vibrations.
//+------------------------------------------------------------------+
//|                                     TwoPoleButterworthFilter.mq4 |
//|                                                                  |
//| Two-Pole Butterworth Filter                                      |
//|                                                                  |
//| Algorithm taken from book                                        |
//|     "Cybernetics Analysis for Stock and Futures"                 |
//| by John F. Ehlers                                                |
//|                                                                  |
//|                                              contact@mqlsoft.com |
//|                                          http://www.mqlsoft.com/ |
//+------------------------------------------------------------------+
#property copyright "Coded by Witold Wozniak"
#property link      "www.mqlsoft.com"

#property indicator_chart_window
#property indicator_buffers 1
#property indicator_color1 Red

extern int CutoffPeriod = 15;

double Filter[];

int buffers = 0;
int drawBegin = 0;

double tempReal, rad2Deg, deg2Rad;
double coef1, coef2, coef3;

int init() {
    drawBegin = 4;
    initBuffer(Filter, "Two-Pole Butterworth Filter", DRAW_LINE);
    IndicatorBuffers(buffers);
    IndicatorShortName("Two-Pole Butterworth Filter [" + CutoffPeriod + "]");
    tempReal = MathArctan(1.0);
    rad2Deg = 45.0 / tempReal;
    deg2Rad = 1.0 / rad2Deg;
    double a1 = MathExp(-1.414 * 3.14159 / CutoffPeriod);
    double b1 = 2 * a1 * MathCos(deg2Rad * 1.414 * 180 / CutoffPeriod);
    coef2 = b1;
    coef3 = -a1 * a1;
    coef1 = (1.0 - b1 + a1 * a1) / 4.0;
    return (0);
}

int start() {
    if (Bars <= drawBegin) return (0);
    int countedBars = IndicatorCounted();
    if (countedBars < 0) return (-1);
    if (countedBars > 0) countedBars--;
    int s, limit = Bars - countedBars - 1;
    for (s = limit; s >= 0; s--) {
        Filter[s] = coef1 * (P(s) + 2.0 * P(s + 1) + P(s + 2)) +
                    coef2 * Filter[s + 1] +
                    coef3 * Filter[s + 2];
        if (s > Bars - 4) {
            Filter[s] = P(s);
        }
    }
    return (0);
}

double P(int index) {
    return ((High[index] + Low[index]) / 2.0);
}

void initBuffer(double array[], string label = "", int type = DRAW_NONE, int arrow = 0, int style = EMPTY, int width = EMPTY, color clr = CLR_NONE) {
    SetIndexBuffer(buffers, array);
    SetIndexLabel(buffers, label);
    SetIndexEmptyValue(buffers, EMPTY_VALUE);
    SetIndexDrawBegin(buffers, drawBegin);
    SetIndexShift(buffers, 0);
    SetIndexStyle(buffers, type, style, width);
    SetIndexArrow(buffers, arrow);
    buffers++;
}
Comments