i_Trend_002
Download script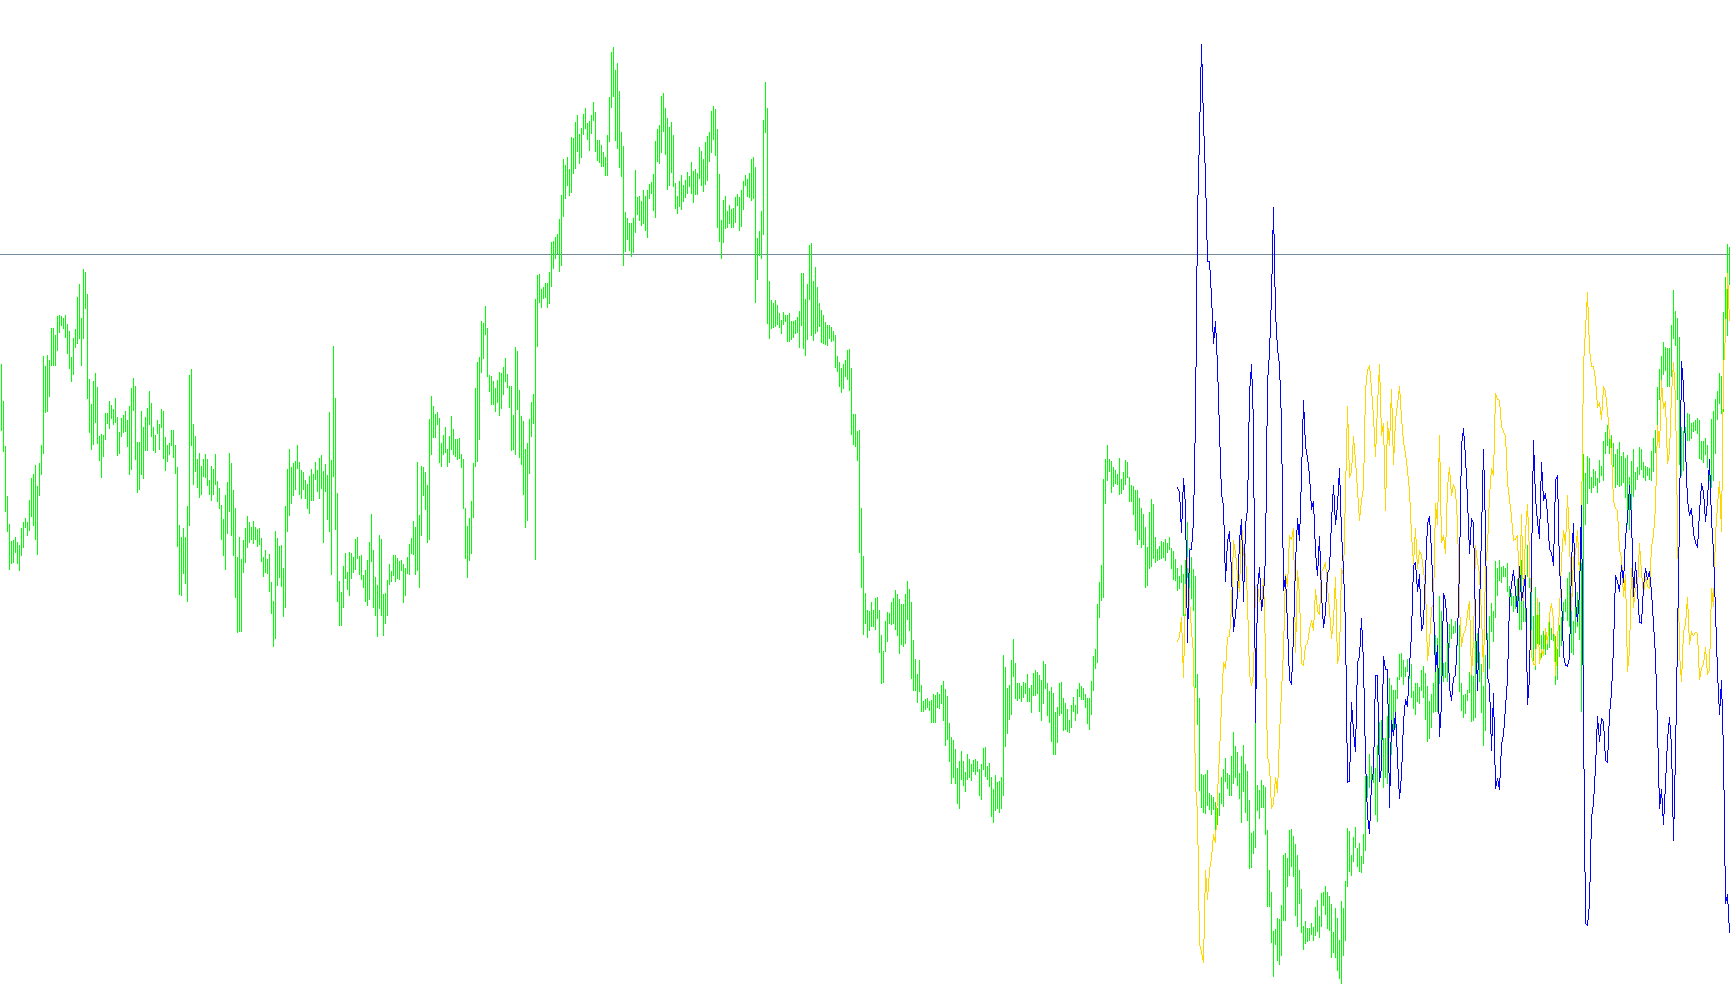
The iTrend indicator is designed to provide traders with a visual representation of market momentum and price positioning relative to volatility boundaries. It works by processing historical price data and calculating two distinct types of information that help identify the overall direction and "strength" of a currency pair or asset.
How the Logic Works
The script operates by analyzing several key components of the market:
1. Price Reference Selection Instead of relying solely on the closing price, the logic allows for customization regarding which data point to analyze. You can choose between different price types—such as the opening price, the highest/lowest points of a candle, or weighted averages. This flexibility ensures that the indicator responds to the specific type of price action you find most relevant.
2. Volatility and Band Analysis The script calculates dynamic "bands" based on a specific period and deviation level. By measuring where the current price sits in relation to these bands, the indicator helps identify whether the market is moving significantly away from its average or staying within a stable range. It essentially provides a sense of the "room" available for price movement.
3. Momentum Tracking (Bulls vs. Bears) A significant part of this script's logic involves separating the forces of buyers (bulls) and sellers (bears). It calculates the power exerted by each side over a specific timeframe. By combining these two forces, the indicator creates a secondary metric that represents the net momentum of the market.
4. The Visual Output The final result is displayed as two distinct lines in a separate window below your main chart:
- Price Deviation: This line tracks the difference between the current price and the calculated volatility bands. It helps highlight how much the price is "stretching" beyond normal behavior.
- Combined Momentum: The second line reflects the net power of market participants. By looking at these two lines together, a user can determine if a price move is backed by strong momentum or if it is becoming exhausted.
Summary for the User
In simple terms, this tool tells you where the price is relative to its recent boundaries and how much force is behind the current move. It aims to filter out market "noise" so that you can better see whether the trend is healthy or if the market is becoming overextended.
//+------------------------------------------------------------------+
//|                                                       iTrend.mq4 |
//|                      Copyright © 2004, MetaQuotes Software Corp. |
//|                                        http://www.metaquotes.net |
//+------------------------------------------------------------------+
#property copyright "Copyright © 2004, MetaQuotes Software Corp."
#property link      "http://www.metaquotes.net"

#property indicator_separate_window
#property indicator_buffers 2
#property indicator_color1 LimeGreen
#property indicator_color2 Red
//---- input parameters
extern int Bands_Mode_0_2=0;  // =0-2 MODE_MAIN, MODE_LOW, MODE_HIGH
extern int Power_Price_0_6=0; // =0-6 PRICE_CLOSE,PRICE_OPEN,PRICE_HIGH,PRICE_LOW,PRICE_MEDIAN,PRICE_TYPICAL,PRICE_WEIGHTED
extern int Price_Type_0_3=0;  // =0-3 PRICE_CLOSE,PRICE_OPEN,PRICE_HIGH,PRICE_LOW
extern int Bands_Period=21;
extern int Bands_Deviation=2;
extern int Power_Period=13;
extern int CountBars=300;
//---- buffers
double value[];
double value2[];
//+------------------------------------------------------------------+
//| Custom indicator initialization function                         |
//+------------------------------------------------------------------+
int init()
  {
//   string short_name;
//---- indicator line
   IndicatorBuffers(2);
   SetIndexStyle(0,DRAW_LINE);
   SetIndexStyle(1,DRAW_LINE);
   SetIndexBuffer(0,value);
   SetIndexBuffer(1,value2);
//----

//----
   return(0);
  }
//+------------------------------------------------------------------+
//| Trend                                                         |
//+------------------------------------------------------------------+
int start()
  {
   SetIndexDrawBegin(0,Bars-CountBars+Bands_Period+1);
   SetIndexDrawBegin(1,Bars-CountBars+Bands_Period+1);
   int i,CurrentBar,Bands_Mode,counted_bars=IndicatorCounted();
   double Power_Price,CurrentPrice;
//----
   if(Bars<=Bands_Period) return(0);
//---- initial zero
   if(counted_bars<Bands_Period)
   {
      for(i=1;i<=Bands_Period;i++) value[Bars-i]=0.0;
      for(i=1;i<=Bands_Period;i++) value2[Bars-i]=0.0;
   }
//----
   i=CountBars-Bands_Period-1;
//   if(counted_bars>=Bands_Period) i=Bars-counted_bars-1;


if (Bands_Mode_0_2==1) Bands_Mode=MODE_LOW;
if (Bands_Mode_0_2==2) Bands_Mode=MODE_HIGH;
if (Bands_Mode_0_2==0) Bands_Mode=MODE_MAIN;

if (Power_Price_0_6==1) Power_Price=PRICE_OPEN;
if (Power_Price_0_6==2) Power_Price=PRICE_HIGH;
if (Power_Price_0_6==3) Power_Price=PRICE_LOW;
if (Power_Price_0_6==4) Power_Price=PRICE_MEDIAN;
if (Power_Price_0_6==5) Power_Price=PRICE_TYPICAL;
if (Power_Price_0_6==6) Power_Price=PRICE_WEIGHTED;
if (Power_Price_0_6==0) Power_Price=PRICE_CLOSE;

for (i=CountBars-1; i>=0; i--)
{
  if (Price_Type_0_3==1) CurrentPrice=Open[i];

  if (Price_Type_0_3==2) CurrentPrice=High[i];

  if (Price_Type_0_3==3) CurrentPrice=Low[i];
  if (Price_Type_0_3==0) CurrentPrice=Close[i];

  value[i]=CurrentPrice-iBands(NULL,0,Bands_Period,Bands_Deviation,0,Bands_Mode,Power_Price,i);
  value2[i]=-(iBearsPower(NULL,0,Power_Period,Power_Price,i)+iBullsPower(NULL,0,Power_Period,Power_Price,i));

}


   return(0);
  }
//+------------------------------------------------------------------+
Comments