i_DCG_ModStDev
Download script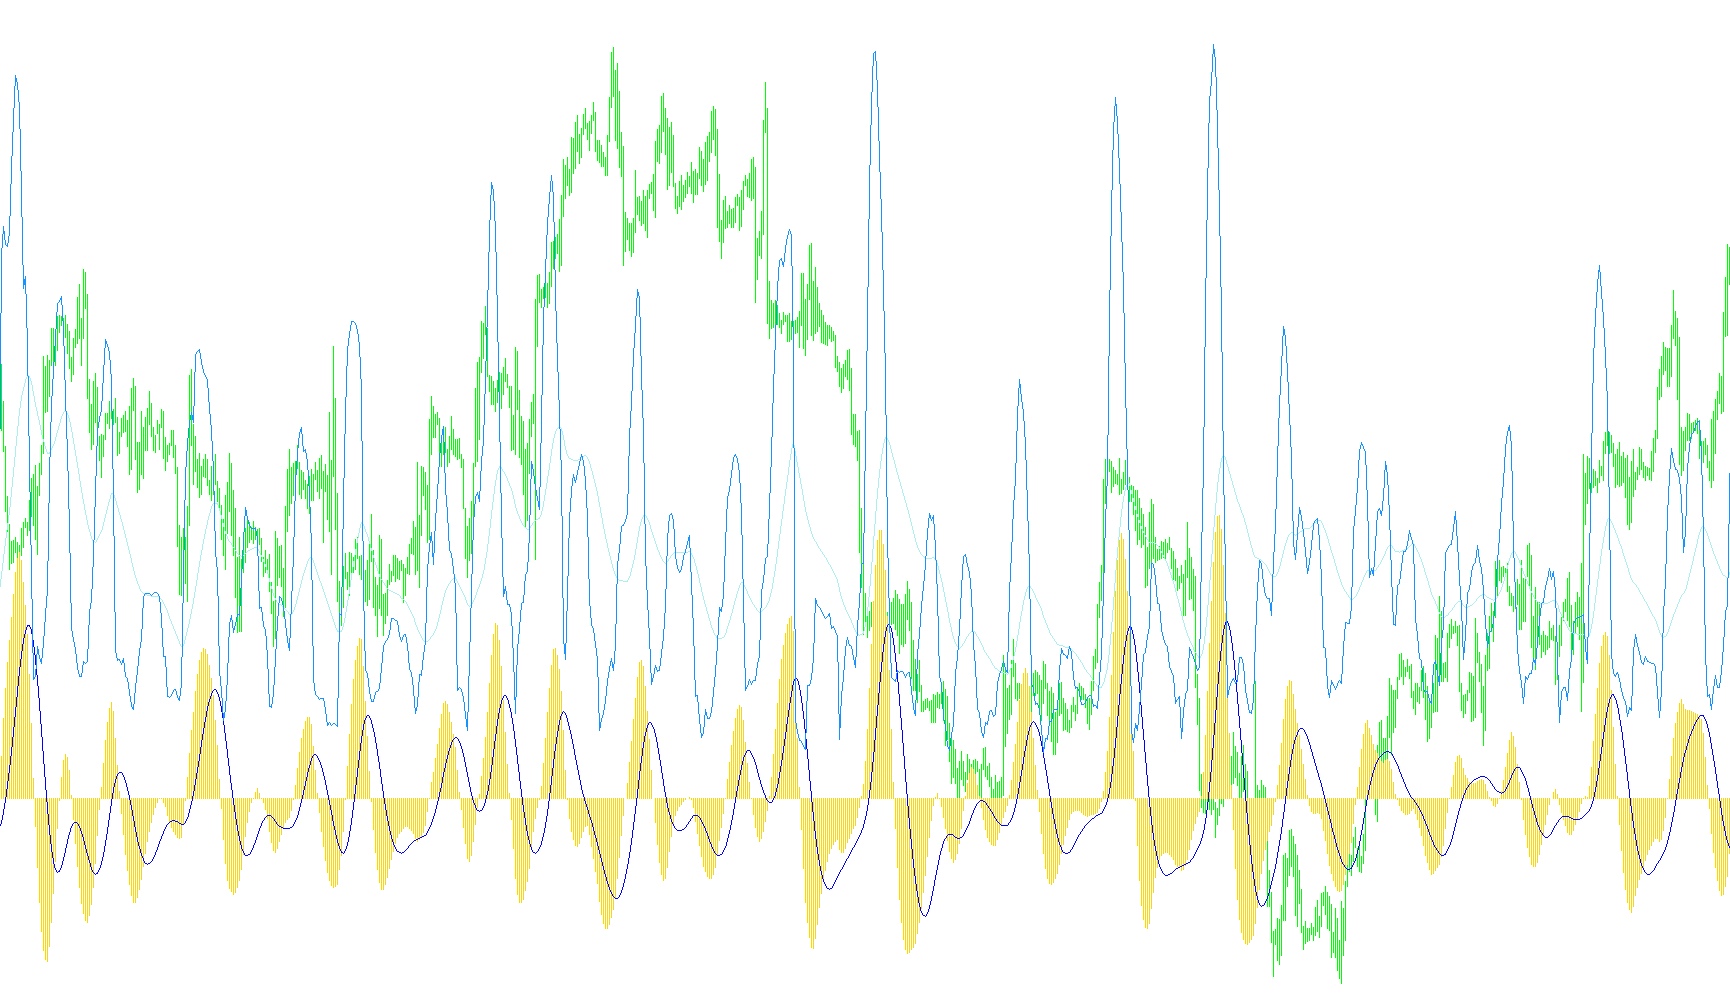
This tool is designed to help traders analyze market volatility and momentum by tracking how much price movement deviates from the norm. Rather than looking at the raw price of an asset, it focuses on the "energy" or "strength" behind price trends, making it easier to identify significant shifts in market behavior.
How the Logic Works
The script processes data through several layers of calculation to arrive at its final visual output:
1. Measuring Volatility (Standard Deviation) The foundation of the tool is based on Standard Deviation. It looks at a specific window of recent price history to see how much the price is "swinging" away from its average. If the swings are large, it indicates high volatility; if they are small, it indicates a quieter market.
2. Smoothing the Data Because raw volatility data can be very jagged and noisy, the script applies "Linear Weighted Moving Averages." This smooths out the erratic jumps, allowing the user to see the underlying trend of the volatility rather than every tiny price flicker. It uses two different types of smoothing:
- One follows the standard period set by the user.
- A second, longer-term smoothing is calculated using a mathematical square root of that period to provide a broader perspective on the trend.
3. Calculating "Power" The core logic then subtracts these two smoothed averages from one another. By calculating the difference between a short-term trend and a long-term trend in volatility, the script identifies "Power." This represents the momentum of the market's intensity—essentially showing whether the volatility is accelerating or decelerating.
4. Final Momentum Filtering To ensure the data is as clean as possible for trading decisions, the script applies one final smoothing layer to this "Power" value. This results in a stabilized indicator that highlights the most significant trends in market strength.
Visual Representation
The tool provides several visual components in a separate window below the main chart:
- Histograms and Lines: These represent different stages of the calculation—from the raw volatility to the final smoothed "Power" momentum.
- Trend Identification: By observing these lines, traders can identify whether the market is gaining strength (increasing power), losing steam (decreasing power), or remaining in a state of equilibrium.
/*+------------------------------------------------------------------+
 | FileName: i_DCG_ModStDev.mq4
 | Author: Copyright © 2005, Fermin Da Costa Gomez
 | Description: This indicator measures
 |
 | Version: 000 20050728 14:52 GMT
 +------------------------------------------------------------------------------------------+*/
#property copyright "Copyright © 2005, Fermin Da Costa Gomez"
#property link      "http://forex.viahetweb.nl"

#property indicator_separate_window
#property indicator_buffers 2

#property indicator_color1 Silver
#property indicator_color2 Red
#property indicator_color3 Lime
#property indicator_color4 SkyBlue

//---- External parameters
extern int _maPeriod=12;

//---- indicator buffers
double _sd[];
double _sdMa[];
double _sdMa2[];
double _sdPower[];
double _sdPowerMa[];

//----
int ExtCountedBars=0;

//+------------------------------------------------------------------+
//| Custom indicator initialization function                         |
//+------------------------------------------------------------------+
int init() {
	int    draw_begin;
	string short_name;
	IndicatorBuffers(5);

	//---- indicator buffers mapping
	SetIndexBuffer(0, _sdPower);
	SetIndexEmptyValue(0, 0.0);
	SetIndexStyle(0, DRAW_HISTOGRAM);

	SetIndexBuffer(1, _sdPowerMa);
	SetIndexEmptyValue(1, 0.0);
	SetIndexStyle(1, DRAW_LINE);

	SetIndexBuffer(3, _sd);
	SetIndexEmptyValue(3, 0.0);
	SetIndexStyle(3, DRAW_LINE);

	SetIndexBuffer(4, _sdMa);
	SetIndexEmptyValue(4, 0.0);
	SetIndexStyle(4, DRAW_LINE);

	SetIndexBuffer(2, _sdMa2);
	SetIndexEmptyValue(2, 0.0);
	SetIndexStyle(2, DRAW_LINE);

	IndicatorDigits(MarketInfo(Symbol(),MODE_DIGITS));

	//---- initialization done
	return(0);
}

//+------------------------------------------------------------------+
//| CalculateIndicators                                                                 |
//+------------------------------------------------------------------+
void calculateIndicators(int i) {
	double m10, m11, m20, m21;
	int fastPeriod=_maPeriod*0.382;

	_sd[i] = iStdDev(Symbol(), 0, _maPeriod, MODE_LWMA, 0, PRICE_CLOSE, i);
	_sdMa[i] = iMAOnArray(_sd, 0, _maPeriod, 0, MODE_LWMA, i);
	_sdMa2[i] = iMAOnArray(_sd, 0, _maPeriod*MathSqrt(_maPeriod), 0, MODE_LWMA, i);
	_sdPower[i]= _sdMa[i]-_sdMa2[i];
	_sdPowerMa[i] = iMAOnArray(_sdPower, 0, _maPeriod*1.618, 0, MODE_LWMA, i);
}

//+------------------------------------------------------------------+
//|                                                                  |
//+------------------------------------------------------------------+
int start() {
	int i, shift, counted_bars=IndicatorCounted();

	//---- last counted bar will be recounted
	int limit=Bars-counted_bars;
	if(counted_bars>0) limit++;

	//---- moving average
	for(i=limit; i>=0; i--) {
		//calculateIndicators(i);

		double m10, m11, m20, m21;
		int fastPeriod=_maPeriod*0.382;

		_sd[i] = iStdDev(Symbol(), 0, _maPeriod, MODE_LWMA, 0, PRICE_CLOSE, i);
		_sdMa[i] = iMAOnArray(_sd, 0, _maPeriod, 0, MODE_LWMA, i);
		_sdMa2[i] = iMAOnArray(_sd, 0, _maPeriod*MathSqrt(_maPeriod), 0, MODE_LWMA, i);
		_sdPower[i]= _sdMa[i]-_sdMa2[i];
		_sdPowerMa[i] = iMAOnArray(_sdPower, 0, _maPeriod*1.618, 0, MODE_LWMA, i);
	}

	return(0);
}
Comments