i_Trend_v1
Download script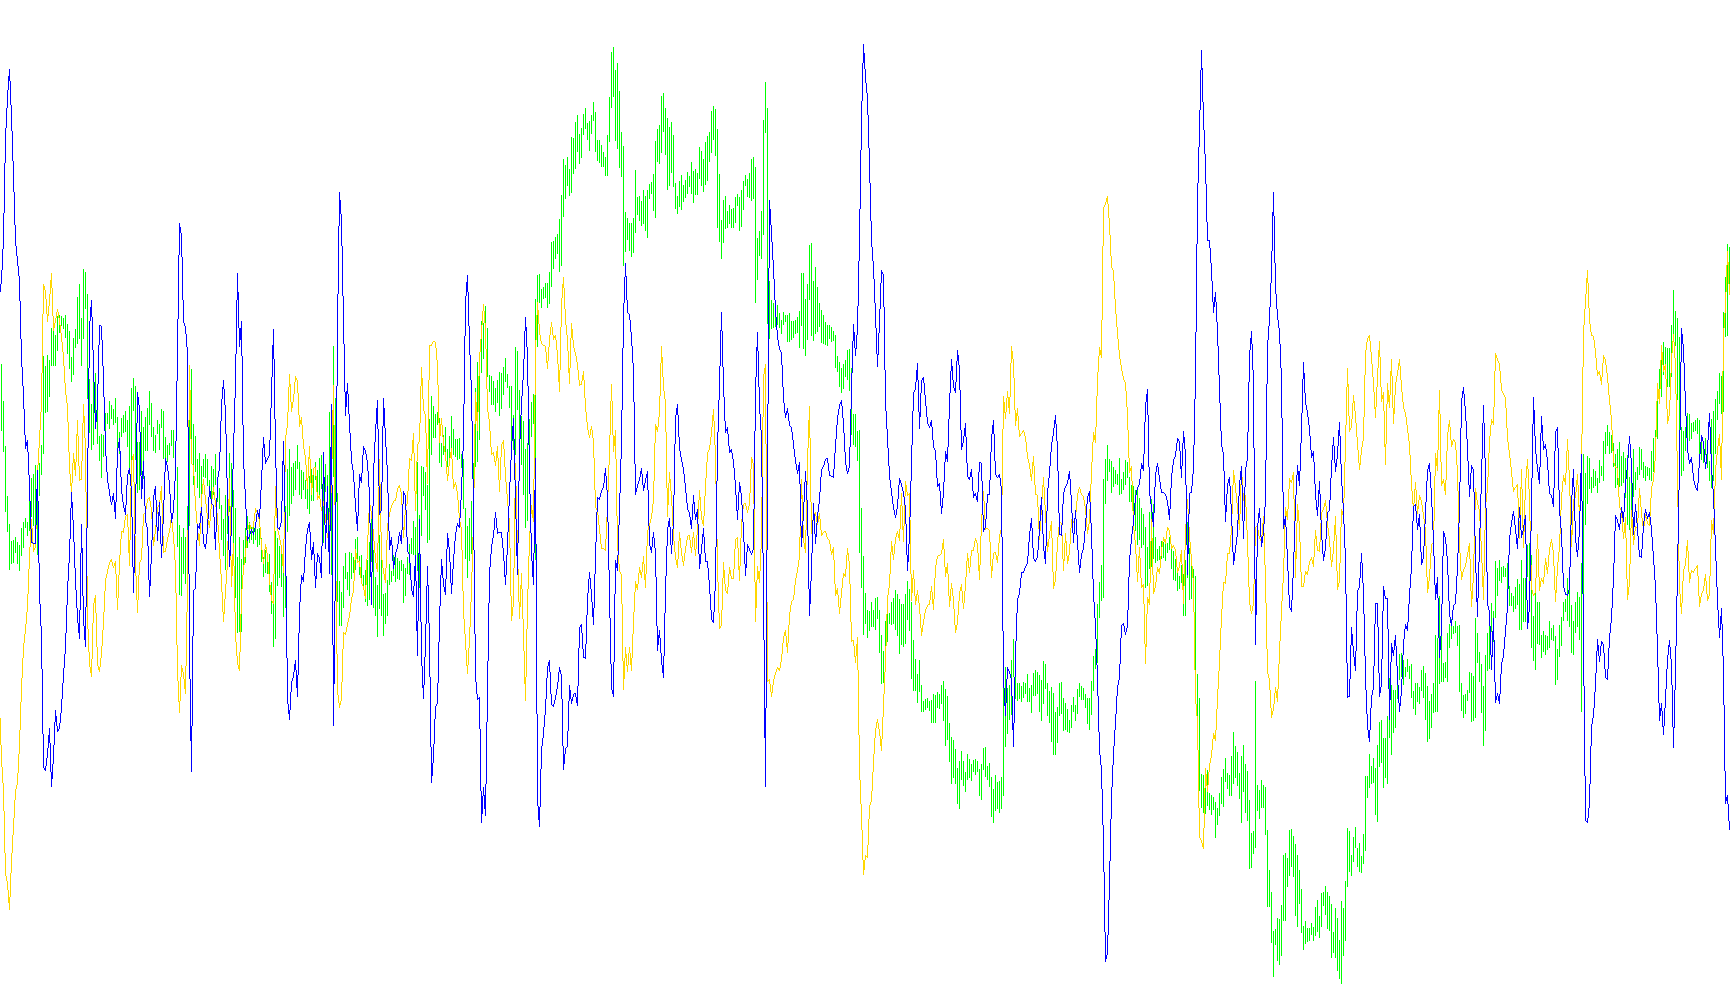
This technical tool is designed to provide visual analysis of market trends by calculating and plotting specific price behaviors on a separate indicator window. It works by analyzing historical price data to identify the momentum and structural positioning of an asset.
Core Functionality
The script operates by processing two distinct sets of calculations simultaneously, which are then displayed as two separate lines on your chart.
1. Price Band Positioning The first component of the logic measures the relationship between the current market price and a dynamic "Band" (a statistical range). Depending on your settings, the script can focus on the main band, the upper boundary, or the lower boundary. By subtracting this band value from the current price, the tool helps visualize where the market is currently positioned relative to its established trend boundaries. This allows you to see if the price is overextended or following a standard path.
2. Power Momentum Analysis The second component of the logic focuses on "Power." It calculates the combined strength of both bullish (買い) and bearish (売り) forces within a specific timeframe. By aggregating these forces and applying a mathematical inversion, the script creates a visual representation of the underlying momentum. This helps traders distinguish between a price move driven by strong volume/momentum versus one that is lagging or weak.
Key Customization Features
The logic allows for significant flexibility through several user-adjustable parameters:
- Price Source Selection: You can choose which specific data point the script monitors (e.g., Open, High, Low, Close, or weighted averages). This ensures the indicator aligns with your specific trading style.
- Sensitivity Controls: The script features dedicated periods for both the "Bands" and the "Power" calculations. By adjusting these timeframes, you can choose to see short-term "noise" and rapid fluctuations or long-term, smoother trend movements.
- Deviation & Mode: Users can define how far the bands deviate from the norm, allowing for a more customized view of market volatility.
Summary of Use
In plain terms, this script takes raw price data and translates it into two visual signals: one that shows where the price is in relation to its historical trend (Positioning), and one that shows how much strength is behind the current move (Momentum). By observing these two lines together, you can better understand the "health" of a market trend.
//+------------------------------------------------------------------+
//|                                                       iTrend.mq4 |
//|                      Copyright © 2004, MetaQuotes Software Corp. |
//|                                        http://www.metaquotes.net |
//+------------------------------------------------------------------+
#property copyright "Copyright © 2004, MetaQuotes Software Corp."
#property link      "http://www.metaquotes.net"

#property indicator_separate_window
#property indicator_buffers 2
#property indicator_color1 LimeGreen
#property indicator_color2 Red
//---- input parameters
extern int Bands_Mode_0_2=0;  // =0-2 MODE_MAIN, MODE_LOW, MODE_HIGH
extern int Power_Price_0_6=0; // =0-6 PRICE_CLOSE,PRICE_OPEN,PRICE_HIGH,PRICE_LOW,PRICE_MEDIAN,PRICE_TYPICAL,PRICE_WEIGHTED
extern int Price_Type_0_3=0;  // =0-3 PRICE_CLOSE,PRICE_OPEN,PRICE_HIGH,PRICE_LOW
extern int Bands_Period=20;
extern int Bands_Deviation=2;
extern int Power_Period=13;
extern int CountBars=3000;
//---- buffers
double value[];
double value2[];
//+------------------------------------------------------------------+
//| Custom indicator initialization function                         |
//+------------------------------------------------------------------+
int init()
  {
//   string short_name;
//---- indicator line
   IndicatorBuffers(2);
   SetIndexStyle(0,DRAW_LINE);
   SetIndexStyle(1,DRAW_LINE);
   SetIndexBuffer(0,value);
   SetIndexBuffer(1,value2);
//----

//----
   return(0);
  }
//+------------------------------------------------------------------+
//| Trend                                                         |
//+------------------------------------------------------------------+
int start()
  {
   SetIndexDrawBegin(0,Bars-CountBars+Bands_Period+1);
   SetIndexDrawBegin(1,Bars-CountBars+Bands_Period+1);
   int i,CurrentBar,Bands_Mode,counted_bars=IndicatorCounted();
   double Power_Price,CurrentPrice;
//----
   if(Bars<=Bands_Period) return(0);
//---- initial zero
   if(counted_bars<Bands_Period)
   {
      for(i=1;i<=Bands_Period;i++) value[Bars-i]=0.0;
      for(i=1;i<=Bands_Period;i++) value2[Bars-i]=0.0;
   }
//----
   i=CountBars-Bands_Period-1;
//   if(counted_bars>=Bands_Period) i=Bars-counted_bars-1;


if (Bands_Mode_0_2==1) Bands_Mode=MODE_LOW;
if (Bands_Mode_0_2==2) Bands_Mode=MODE_HIGH;
if (Bands_Mode_0_2==0) Bands_Mode=MODE_MAIN;

if (Power_Price_0_6==1) Power_Price=PRICE_OPEN;
if (Power_Price_0_6==2) Power_Price=PRICE_HIGH;
if (Power_Price_0_6==3) Power_Price=PRICE_LOW;
if (Power_Price_0_6==4) Power_Price=PRICE_MEDIAN;
if (Power_Price_0_6==5) Power_Price=PRICE_TYPICAL;
if (Power_Price_0_6==6) Power_Price=PRICE_WEIGHTED;
if (Power_Price_0_6==0) Power_Price=PRICE_CLOSE;

for (i=CountBars-1; i>=0; i--)
{
  if (Price_Type_0_3==1) CurrentPrice=Open[i];

  if (Price_Type_0_3==2) CurrentPrice=High[i];

  if (Price_Type_0_3==3) CurrentPrice=Low[i];
  if (Price_Type_0_3==0) CurrentPrice=Close[i];

  value[i]=CurrentPrice-iBands(NULL,0,Bands_Period,Bands_Deviation,0,Bands_Mode,Power_Price,i);
  value2[i]=-(iBearsPower(NULL,0,Power_Period,Power_Price,i)+iBullsPower(NULL,0,Power_Period,Power_Price,i));

}


   return(0);
  }
//+------------------------------------------------------------------+
Comments