i_Trend_v3
Download script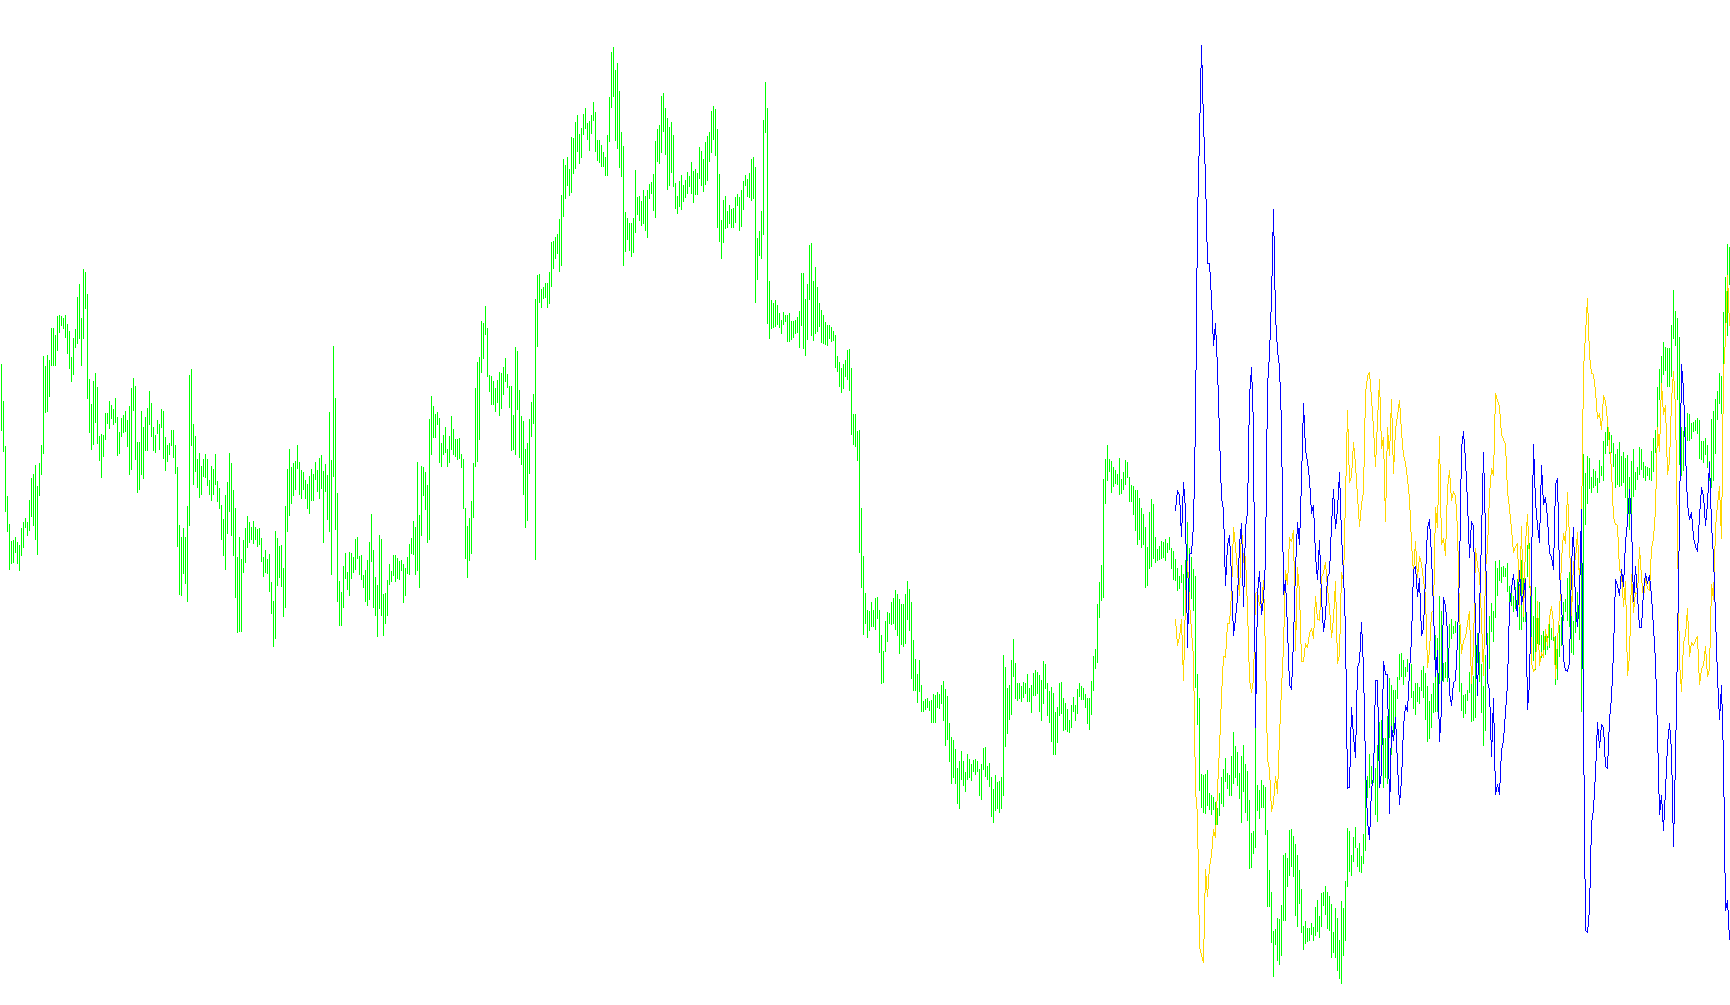
This indicator is designed to help traders visualize market trends by analyzing price movements and momentum. It operates by calculating two distinct types of data on a separate window, providing a clearer picture of whether the market is trending strongly in one direction or experiencing shifts in pressure.
Core Logic Overview
The script processes historical price data to generate two primary visual lines. Here is how it interprets the market:
1. Trend Band Analysis The first component of the logic focuses on "Trend Bands." It calculates the difference between the current market price and a specific band level (which can be adjusted to focus on high, low, or main price averages).
- What this tells you: By measuring how far the current price is deviating from these bands, the indicator helps identify the intensity of a trend. It essentially quantifies how "stretched" the price is relative to its recent historical average.
2. Power Momentum Balance The second component measures "Power," which identifies the relationship between bullish (買い) and bearish (売り) forces in the market. It looks at specific price types—such as the opening, closing, or high/low points—over a set period to determine who is currently in control.
- What this tells you: This part of the logic subtracts the bearish power from the bullish power. A positive result indicates that buyers are dominating the move, while a negative result suggests that sellers have the upper hand.
Key Customizations
The logic allows for significant flexibility through several adjustable settings:
- Price Sensitivity: You can choose which specific price data to track (e.g., the exact price at which the candle closed, the highest point reached, or the opening price).
- Timeframes and Periods: Users can define how far back the indicator should look to calculate its averages and momentum.
- Deviation and Mode: You can choose whether the indicator focuses on the "main" trend, the upper limits (highs), or the lower limits (lows) of price movement.
Summary for the Trader
In simple terms, this script acts as a dual-lens tool. One lens tells you where the price is relative to its historical bounds, and the other lens tells you how much force is behind the current move. By watching these two lines together, traders can better identify when a trend is becoming exhausted or when a new wave of momentum is beginning.
//+------------------------------------------------------------------+
//|                                                       iTrend.mq4 |
//|                      Copyright © 2004, MetaQuotes Software Corp. |
//|                                        http://www.metaquotes.net |
//+------------------------------------------------------------------+
#property copyright "Copyright © 2004, MetaQuotes Software Corp."
#property link      "http://www.metaquotes.net"
//----
#property indicator_separate_window
#property indicator_buffers 2
#property indicator_color1 LimeGreen
#property indicator_color2 Red
//---- input parameters
extern int Bands_Mode_0_2=0;  // =0-2 MODE_MAIN, MODE_LOW, MODE_HIGH
extern int Power_Price_0_6=0; // =0-6 PRICE_CLOSE,PRICE_OPEN,PRICE_HIGH,PRICE_LOW,PRICE_MEDIAN,PRICE_TYPICAL,PRICE_WEIGHTED
extern int Price_Type_0_3=0;  // =0-3 PRICE_CLOSE,PRICE_OPEN,PRICE_HIGH,PRICE_LOW
extern int Bands_Period=20;
extern int Bands_Deviation=2;
extern int Power_Period=13;
extern int CountBars=300;
//---- buffers
double value[];
double value2[];
//+------------------------------------------------------------------+
//| Custom indicator initialization function                         |
//+------------------------------------------------------------------+
int init()
  {
   //   string short_name;
//---- indicator line
   IndicatorBuffers(2);
   SetIndexStyle(0,DRAW_LINE);
   SetIndexStyle(1,DRAW_LINE);
   SetIndexBuffer(0,value);
   SetIndexBuffer(1,value2);
//----
//----
   return(0);
  }
//+------------------------------------------------------------------+
//| Trend                                                         |
//+------------------------------------------------------------------+
int start()
  {
   SetIndexDrawBegin(0,Bars-CountBars+Bands_Period+1);
   SetIndexDrawBegin(1,Bars-CountBars+Bands_Period+1);
   int i,CurrentBar,Bands_Mode,counted_bars=IndicatorCounted();
   double Power_Price,CurrentPrice;
//----
   if(Bars<=Bands_Period) return(0);
//---- initial zero
   if(counted_bars<Bands_Period)
     {
      for(i=1;i<=Bands_Period;i++) value[Bars-i]=0.0;
      for(i=1;i<=Bands_Period;i++) value2[Bars-i]=0.0;
     }
//----
   i=CountBars-Bands_Period-1;
   //   if(counted_bars>=Bands_Period) i=Bars-counted_bars-1;
   if (Bands_Mode_0_2==1) Bands_Mode=MODE_LOW;
   if (Bands_Mode_0_2==2) Bands_Mode=MODE_HIGH;
   if (Bands_Mode_0_2==0) Bands_Mode=MODE_MAIN;
   if (Power_Price_0_6==1) Power_Price=PRICE_OPEN;
   if (Power_Price_0_6==2) Power_Price=PRICE_HIGH;
   if (Power_Price_0_6==3) Power_Price=PRICE_LOW;
   if (Power_Price_0_6==4) Power_Price=PRICE_MEDIAN;
   if (Power_Price_0_6==5) Power_Price=PRICE_TYPICAL;
   if (Power_Price_0_6==6) Power_Price=PRICE_WEIGHTED;
   if (Power_Price_0_6==0) Power_Price=PRICE_CLOSE;
//----
   for(i=CountBars-1; i>=0; i--)
     {
      if (Price_Type_0_3==1) CurrentPrice=Open[i];
      if (Price_Type_0_3==2) CurrentPrice=High[i];
      if (Price_Type_0_3==3) CurrentPrice=Low[i];
      if (Price_Type_0_3==0) CurrentPrice=Close[i];
//----
      value[i]=CurrentPrice-iBands(NULL,0,Bands_Period,Bands_Deviation,0,Bands_Mode,Power_Price,i);
      value2[i]=-(iBearsPower(NULL,0,Power_Period,Power_Price,i)+iBullsPower(NULL,0,Power_Period,Power_Price,i));
     }
   return(0);
  }
//+------------------------------------------------------------------+
Comments