iVAR1-
Download script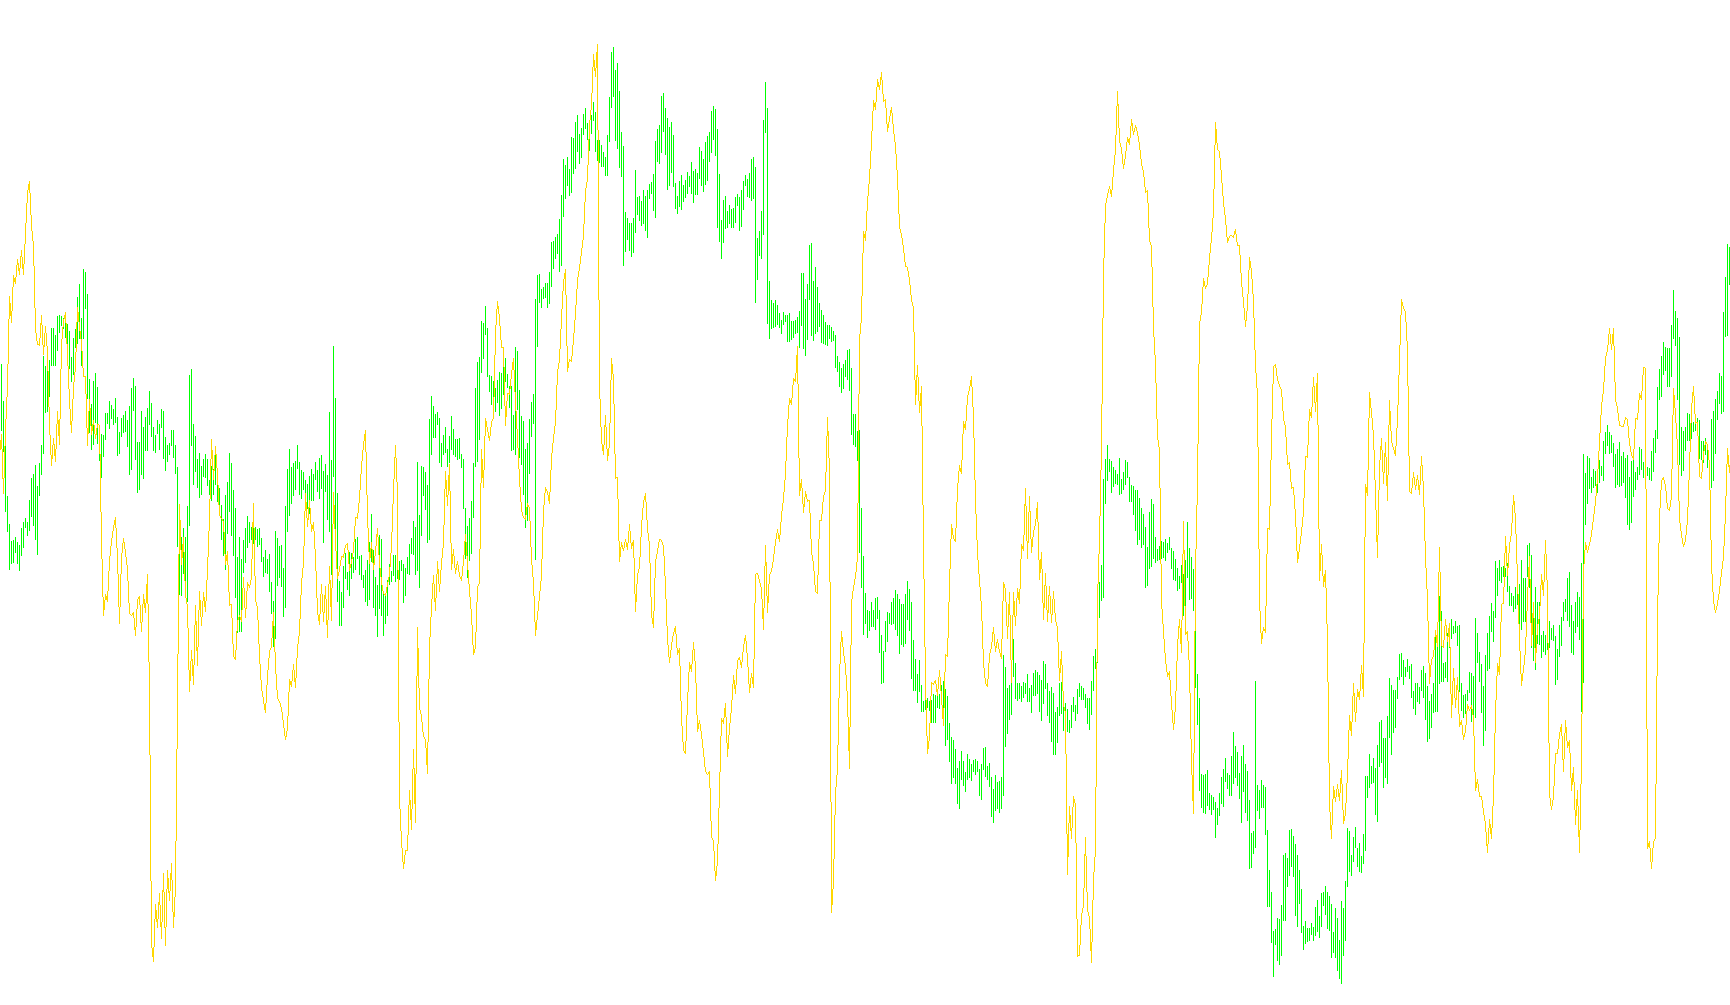
This technical indicator is designed to analyze the underlying nature of price movements by determining whether the current market behavior is trending, ranging, or purely random. It achieves this by calculating a specific mathematical value known as a "Variation Index."
How it Works
Instead of looking at standard price fluctuations over a single candle, this script examines price data across multiple different time scales simultaneously. It does this by breaking the price history into various intervals that increase exponentially (based on a user-defined power setting).
For each of these intervals, the tool calculates the difference between the highest and lowest prices. By measuring these "swings" across many different scales at once, the script can identify patterns that are often hidden to the naked eye.
The Logic Behind the Analysis
The core logic follows three main steps:
- Multi-Scale Data Collection: The indicator looks at various time windows and calculates the total price range (Delta) for each.
- Logarithmic Mapping: It then converts these differences into a logarithmic scale. This is done to normalize the data, ensuring that small fluctuations and large swings are treated in a way that allows for accurate mathematical comparison.
- Regression Analysis: Finally, it applies a linear regression formula to this data. In simple terms, it tries to draw a "line of best fit" through the results.
How to Interpret the Results
The final output is a single line shown in a separate window on your chart:
- Trending Behavior: If the resulting index shows a clear upward or downward inclination, it suggests that the market has a prevailing trend. This means the price is moving with a specific direction over time.
- Ranging/Sideways Behavior: If the index remains relatively flat or stable, it indicates that the price is "ranging" or consolidating, meaning there is no dominant trend and the price is moving back and forth within a specific boundary.
- Randomness: The tool helps filter out market "noise," allowing you to see if the current movement is significant enough to be considered a trend or if it is just random market fluctuation.
By using this approach, the indicator provides a more sophisticated view of market dynamics than standard moving averages, as it evaluates the stability and consistency of price changes across multiple dimensions at once.
//+------------------------------------------------------------------+
//| iVAR.mq4 |
//| (C)opyright © 2008, Ilnur |
//| http://www.metaquotes.net |
//+------------------------------------------------------------------+
// Èíäèêàòîð îòîáðàæàåò èíäåêñ âàðèàöèè öåíîâîãî ðÿäà, âû÷èñëåííîãî
// íà ìèíèìàëüíîì ïðåäøåñòâóþùåì èíòåðâàëå äëèíû 2^n. Èíäåêñ âàðèàöèè
// ïîêàçûâàåò, ÷òî ïðåîáëàäàåò âî âðåìåííîì ðÿäó òðåíäîâàÿ èëè ôëåòîâàÿ
// ñîñòàâëÿþùàÿ, èëè æå ðÿä âåäåò ñåáÿ ñëó÷àéíî.
// Ì.Ì. Äóáîâèêîâ è äð. - Ðàçìåðíîñòü ìèíèìàëüíîãî ïîêðûòèÿ è ëîêàëüíûé
// àíàëèç ôðàêòàëüíûõ âðåìåííûõ ðÿäîâ.
#property copyright "(C)opyright © 2008, Ilnur"
#property link "http://www.metaquotes.net"
//---- íàñòðîéêè èíäèêàòîðà
#property indicator_separate_window
#property indicator_buffers 1
#property indicator_color1 Maroon
#property indicator_level1 0.5
#property indicator_levelcolor SlateGray
//---- âõîäíûå ïàðàìåòðû
extern int n = 5;
//---- áóôåð èíäèêàòîðà
double ibuffer[];
//+------------------------------------------------------------------+
//| Ôóíêöèÿ èíèöèàëèçàöèè èíäèêàòîðà |
//+------------------------------------------------------------------+
int init()
{
//---- íàñòðîéêà ïàðàìåòðîâ îòðèñîâêè
SetIndexBuffer(0,ibuffer);
SetIndexStyle(0,DRAW_LINE);
SetIndexDrawBegin(0,MathPow(2,n));
SetIndexLabel(0,"iVAR");
//---- "êîðîòêîå èìÿ" îòîáðàæàåìîå â îêíå èíäèêàòîðà
IndicatorShortName("iVAR1- ("+n+")");
return(0);
}
//+------------------------------------------------------------------+
//| Îñíîâíàÿ ôóíêöèÿ èíäèêàòîðà |
//+------------------------------------------------------------------+
int start()
{
int i, j, k, nTotal, nCountedBars = IndicatorCounted();
int ihigh, ilow, nInterval, nWindow = MathPow(2,n);
double Delta, Xñ, Yñ, Sx, Sy, Sxx, Sxy;
//---- ïîñëåäíèé ïîñ÷èòàííûé áàð áóäåò ïåðåñ÷èòàí
nTotal = Bars-nWindow;
if(nCountedBars>nWindow) nTotal = Bars-nCountedBars-1;
//---- îñíîâíîé öèêë èíäèêàòîðà
for(j=nTotal; j>=0; j--)
{
Sx = 0; Sy = 0; Sxx = 0; Sxy = 0;
for(i=0; i<=n; i++)
{
nInterval = MathPow(2,n-i);
//---- ñóììèðóåì ðàçíèöû ìàêñèìàëüíîé è ìèíèìàëüíîé öåí íà èíòåðâàëå
for(Delta=0, k=0; k<MathPow(2,i); k++)
{
ihigh = iHighest(Symbol(),0,MODE_HIGH,nInterval,nInterval*k+j);
ilow = iLowest(Symbol(),0,MODE_LOW,nInterval,nInterval*k+j);
Delta += High[ihigh]-Low[ilow];
}
//---- âû÷èñëÿåì êîîðäèíàòû âàðèàöèè â äâîéíîì ëîãàðèôìè÷åñêîì ìàñøòàáå
Xñ = (n-i)*MathLog(2.0);
Yñ = MathLog(Delta);
//---- íàêàïëèâàåì äàííûå äëÿ íàõîæäåíèÿ êîýôôèöèåíòîâ ëèíèè ðåãðåññèè ñ ïîìîùüþ ÌÍÊ
Sx += Xñ;
Sy += Yñ;
Sxx += Xñ*Xñ;
Sxy += Xñ*Yñ;
}
//---- âû÷èñëÿåì èíäåêñ âàðèàöèè (êîýôôèöèåíò íàêëîíà ëèíèè ðåãðåññèè)
ibuffer[j] =1 +(Sx*Sy-(n+1)*Sxy)/(Sx*Sx-(n+1)*Sxx);
}
return(0);
}
Comments