i_GAP
Download script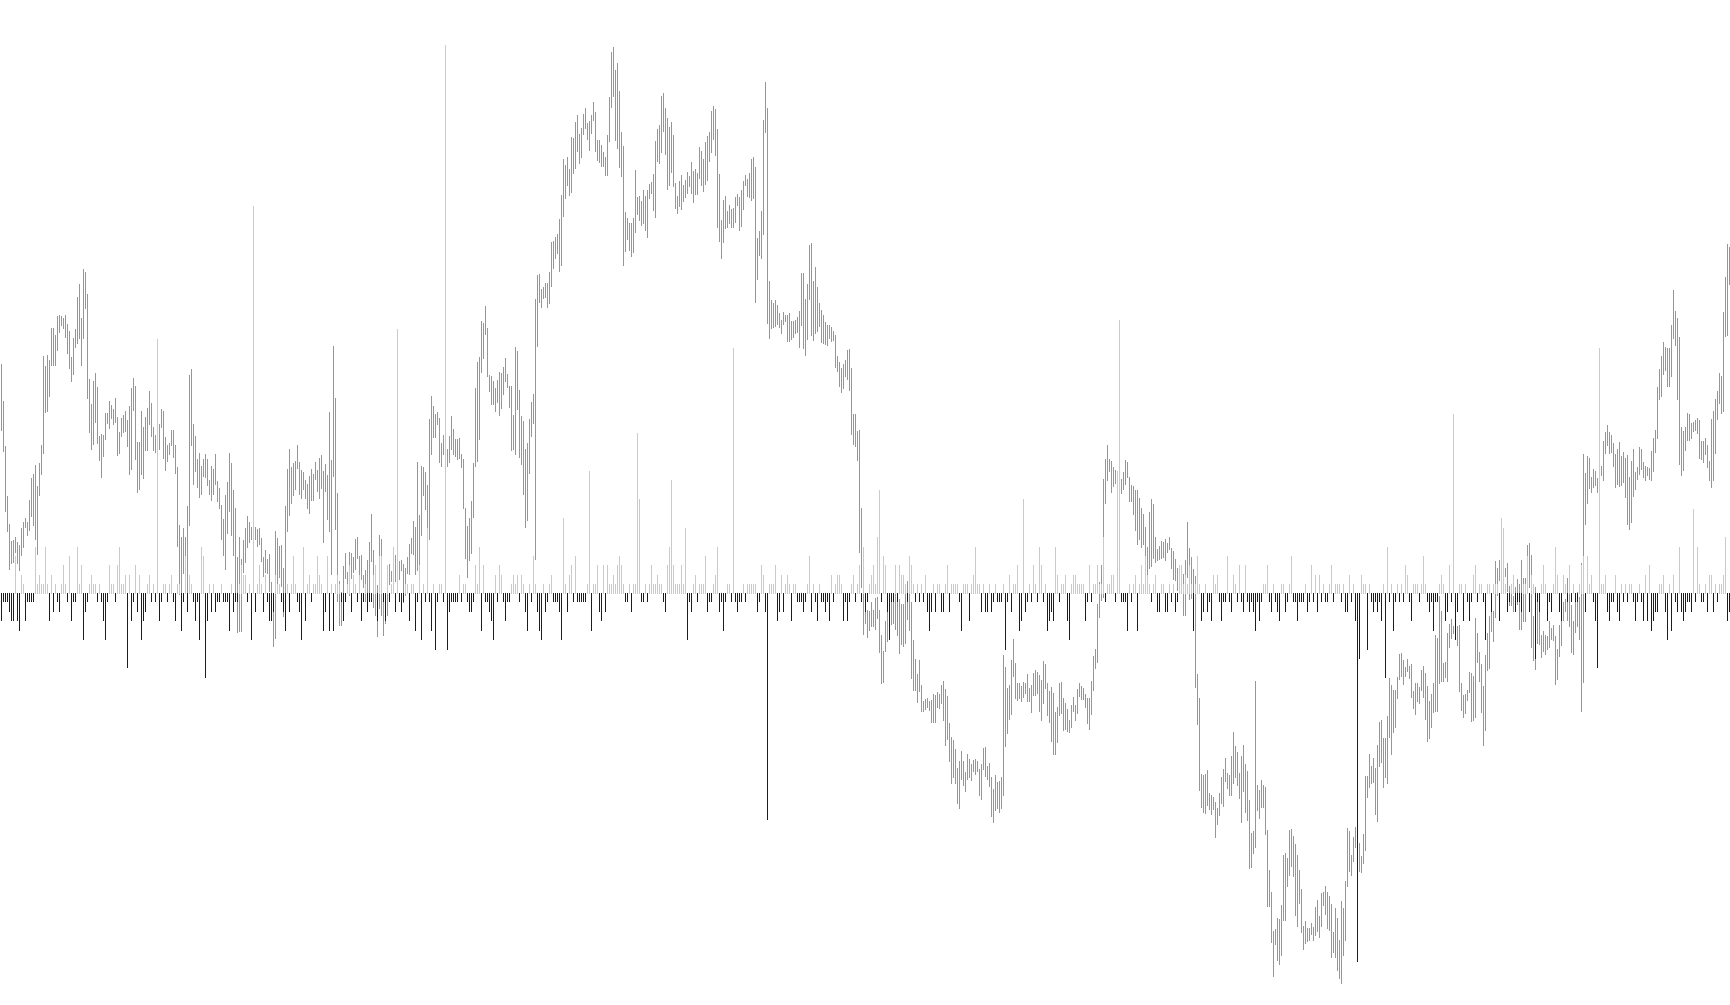
This custom trading indicator is designed to provide a visual representation of price movement dynamics by analyzing the relationship between current and previous candles. It operates as an independent window on your chart, displaying two distinct data streams represented as histograms in Blue and Red.
Core Logic Overview
The primary objective of this script is to measure the "gap" or transition between the closing price of one candle and the opening price of the next. By focusing on this specific transition point, the indicator helps visualize whether the market is moving forward, pulling back, or shifting in a specific direction.
How the Calculation Works
The logic processes every candle on the chart to determine the following:
- Directional Tracking: The script looks at the difference between the Current Candle's Opening Price and the Previous Candle's Closing Price.
- Positive Movement (Blue Histogram): If the current opening price is higher than the previous closing price, it signifies an upward movement. The script calculates the magnitude of this jump in "points" (the smallest price increment) and plots it as a Blue histogram.
- Negative Movement (Red Histogram): Conversely, if the current opening price is lower than the previous closing price, it signifies a downward move. The script calculates this drop in points and plots it as a Red histogram.
Visual Interpretation
Instead of just showing price lines, this indicator converts these movements into measurable "heights" on your screen:
- Magnitude: The taller the bars in the histogram appear, the larger the gap was between the previous close and the current open. This allows you to see at a glance where significant price jumps or "gaps" have occurred.
- Color Coding: By separating these into Blue (positive) and Red (negative) colors, the tool provides an immediate visual distinction between bullish momentum and bearish pressure.
In summary, this tool serves as a momentum and volatility tracker that highlights the intensity of price transitions, making it easier for traders to identify sudden shifts in market direction.
//+------------------------------------------------------------------+
//|                            Èíäèêàòîð ãýïîâ                       |
//|                              FOREX&STOX                          |
//|                           ram-kr@krastalk.ru                     |
//+------------------------------------------------------------------+
#property copyright "ram-kr@krastalk.ru"
#property link      ""
#property indicator_separate_window
#property indicator_buffers 2
#property indicator_color1 Blue
#property indicator_color2 Red
#property indicator_width1 2
#property indicator_width2 2

double ExtMapBuffer1[];
double ExtMapBuffer2[];

//+------------------------------------------------------------------+
//| Custom indicator initialization function                         |
//+------------------------------------------------------------------+
int init()
  {
//---- indicators
   IndicatorBuffers(2);
   SetIndexStyle(0,DRAW_HISTOGRAM);
   SetIndexBuffer(0,ExtMapBuffer1);
   SetIndexLabel(0,"Blue");
   SetIndexStyle(1,DRAW_HISTOGRAM);
   SetIndexBuffer(1,ExtMapBuffer2);
   SetIndexLabel(1,"Red");
//----
   IndicatorShortName("Èíäèêàòîð ãýïîâ FOREX&STOX");
//----
   return(0);
  }
//+------------------------------------------------------------------+
//| Custor indicator deinitialization function                       |
//+------------------------------------------------------------------+
int deinit()
  {
   return(0);
  }
//+------------------------------------------------------------------+
//| Custom indicator iteration function                              |
//+------------------------------------------------------------------+
int start()
  {
   int    counted_bars=IndicatorCounted();
   double BandsMode,BandsPrice,PowerPrice;

   //+----Main Section--------------------------------------------------+
   double value1, value2;
   for(int i=0;i<=Bars;i++)
    {
     value1=0;   value2=0;
//  ãýï ÂÍÈÇ \---------------------------------------------
       if(   (Open[i]-Close[i+1])>0  ) value1=(Open[i]-Close[i+1])/Point;
//  ãýï ÂÂÅÐÕ /----------------------------------------------
       if(   (Open[i]-Close[i+1])<0    )   value2=(Open[i]-Close[i+1])/Point;
//--------------------------------------------------------
     ExtMapBuffer1[i]=value1;
     ExtMapBuffer2[i]=value2;
     } //end for
   //+------------------------------------------------------------------+
  return(0);
  }
//+------------------------------------------------------------------+
Comments