Pivot Points
Indicator

Pivot Points

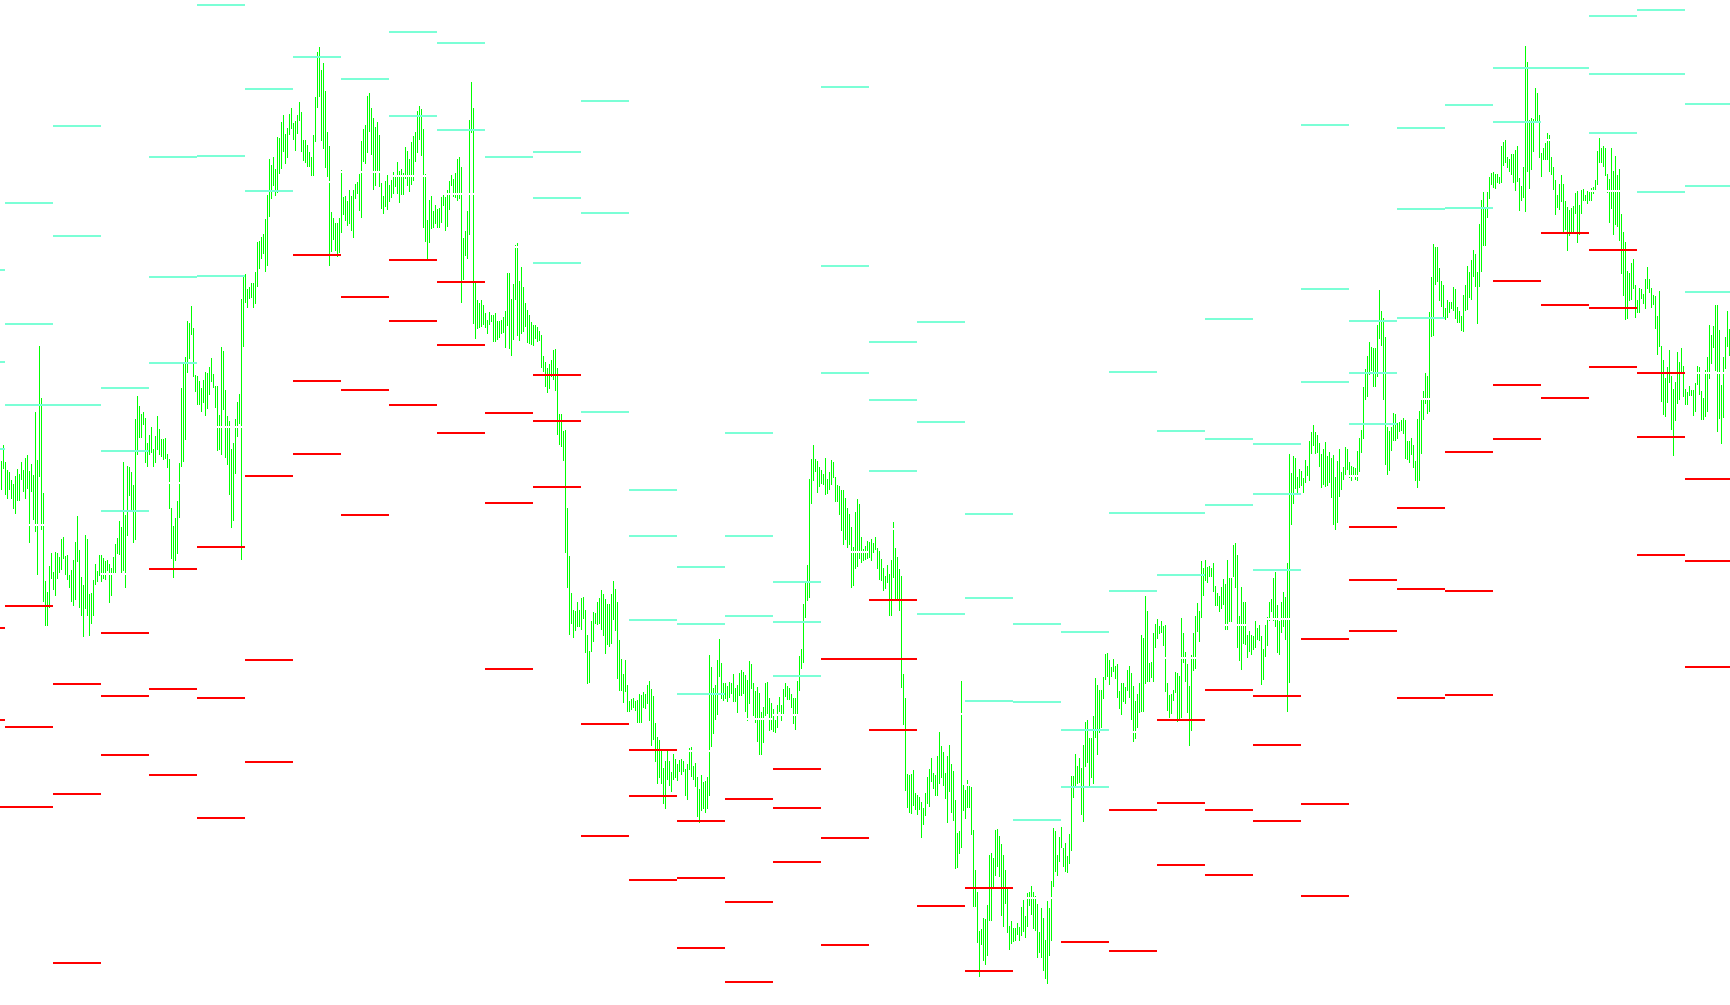
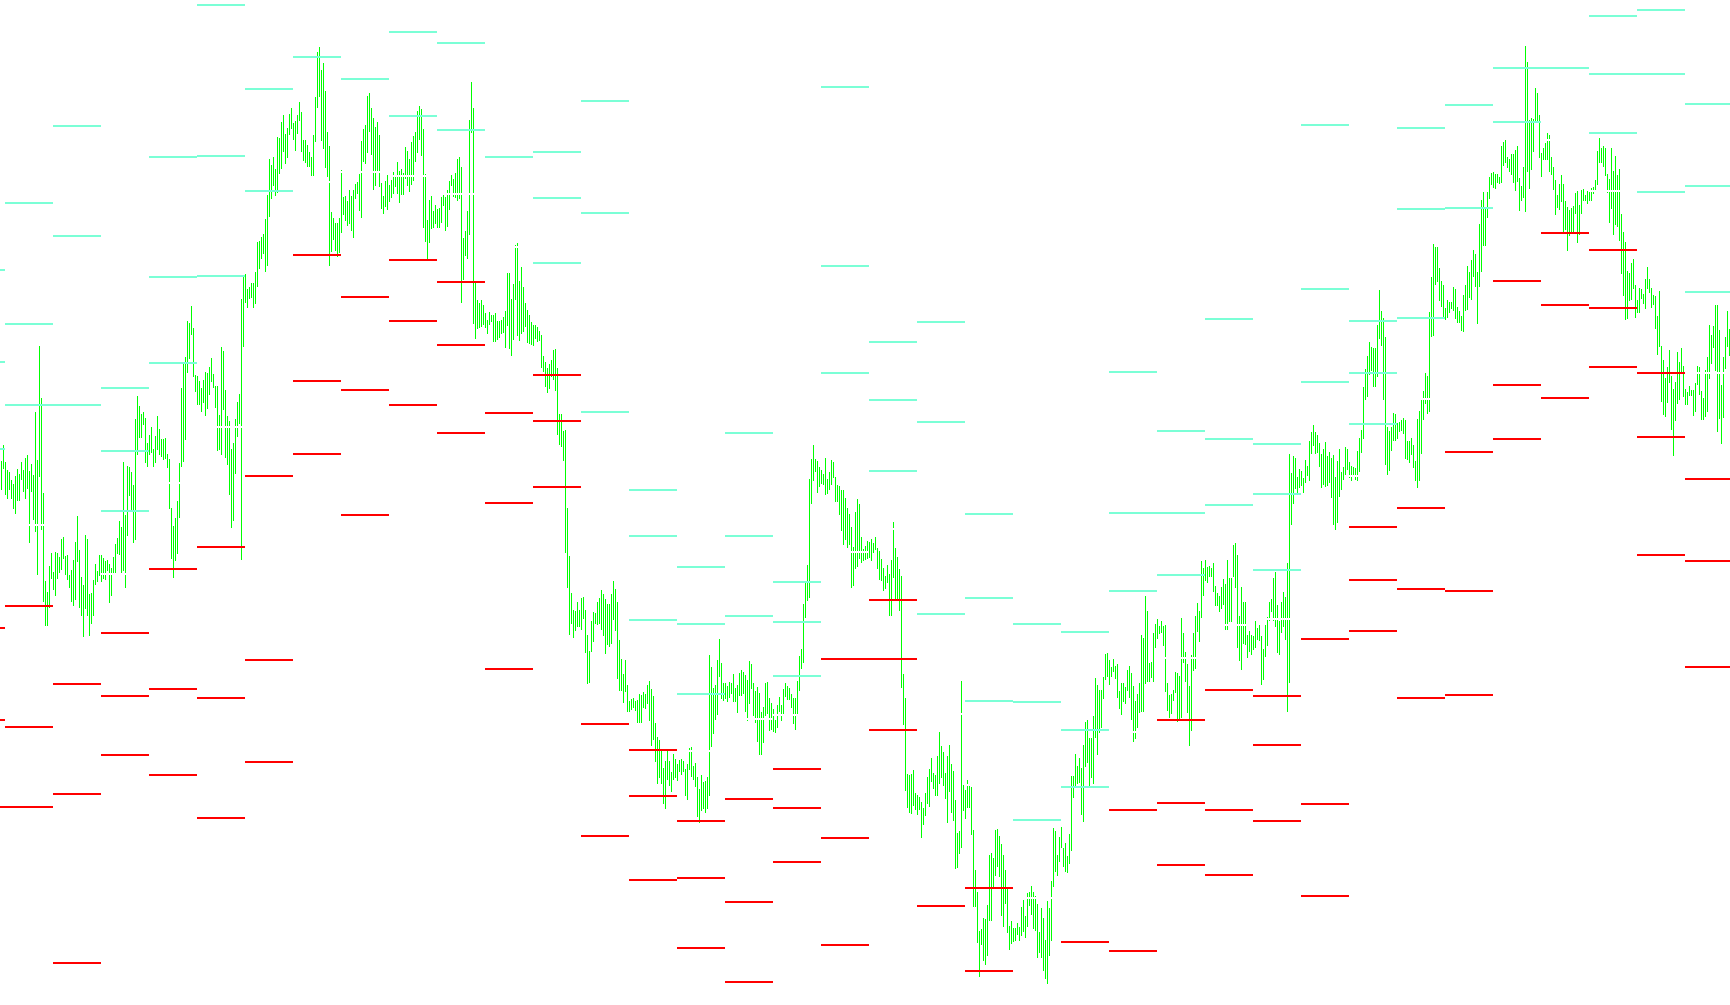
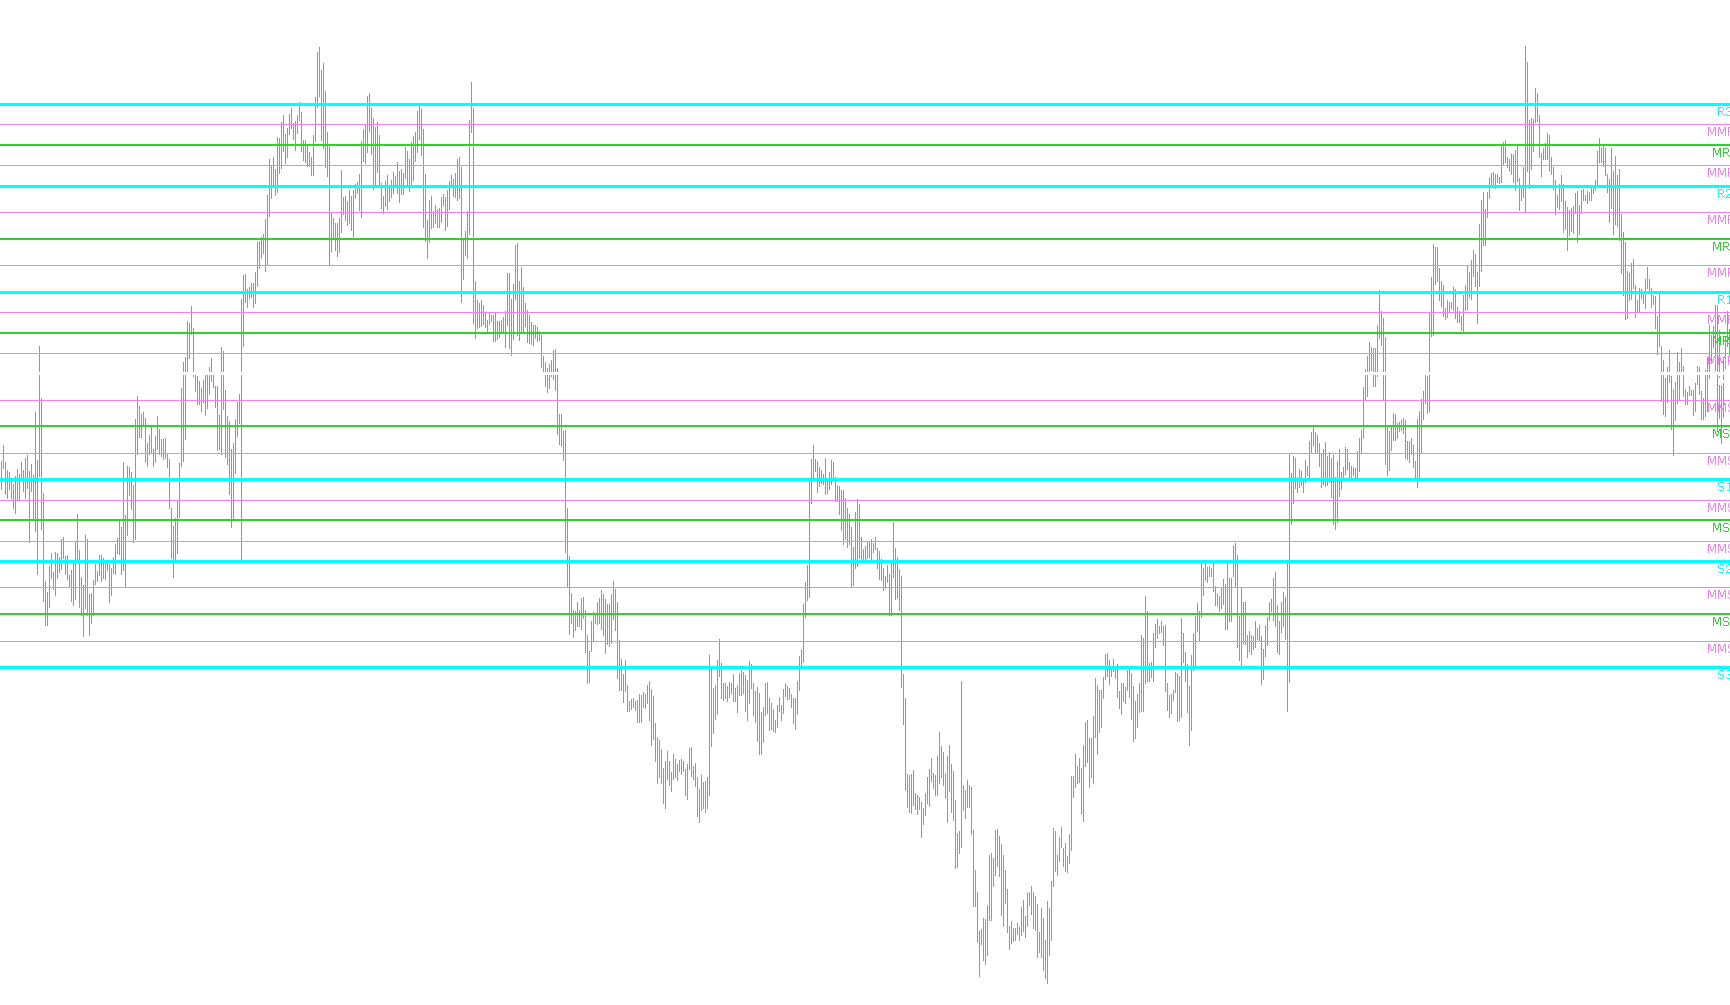
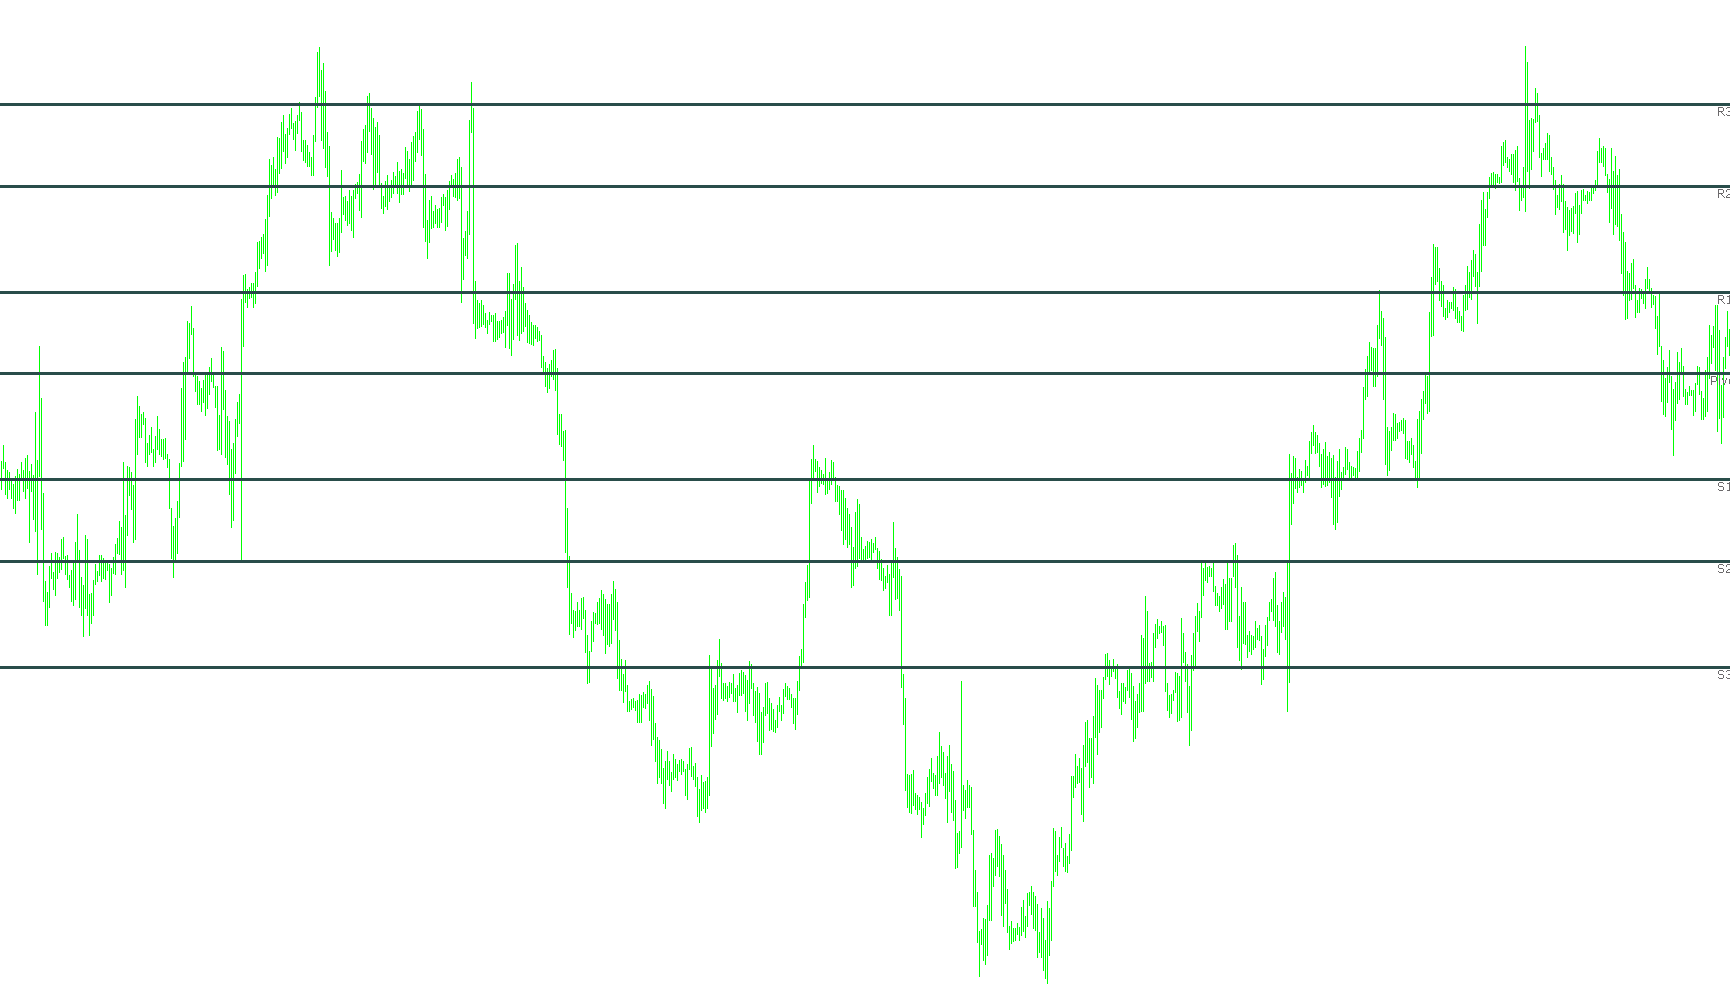
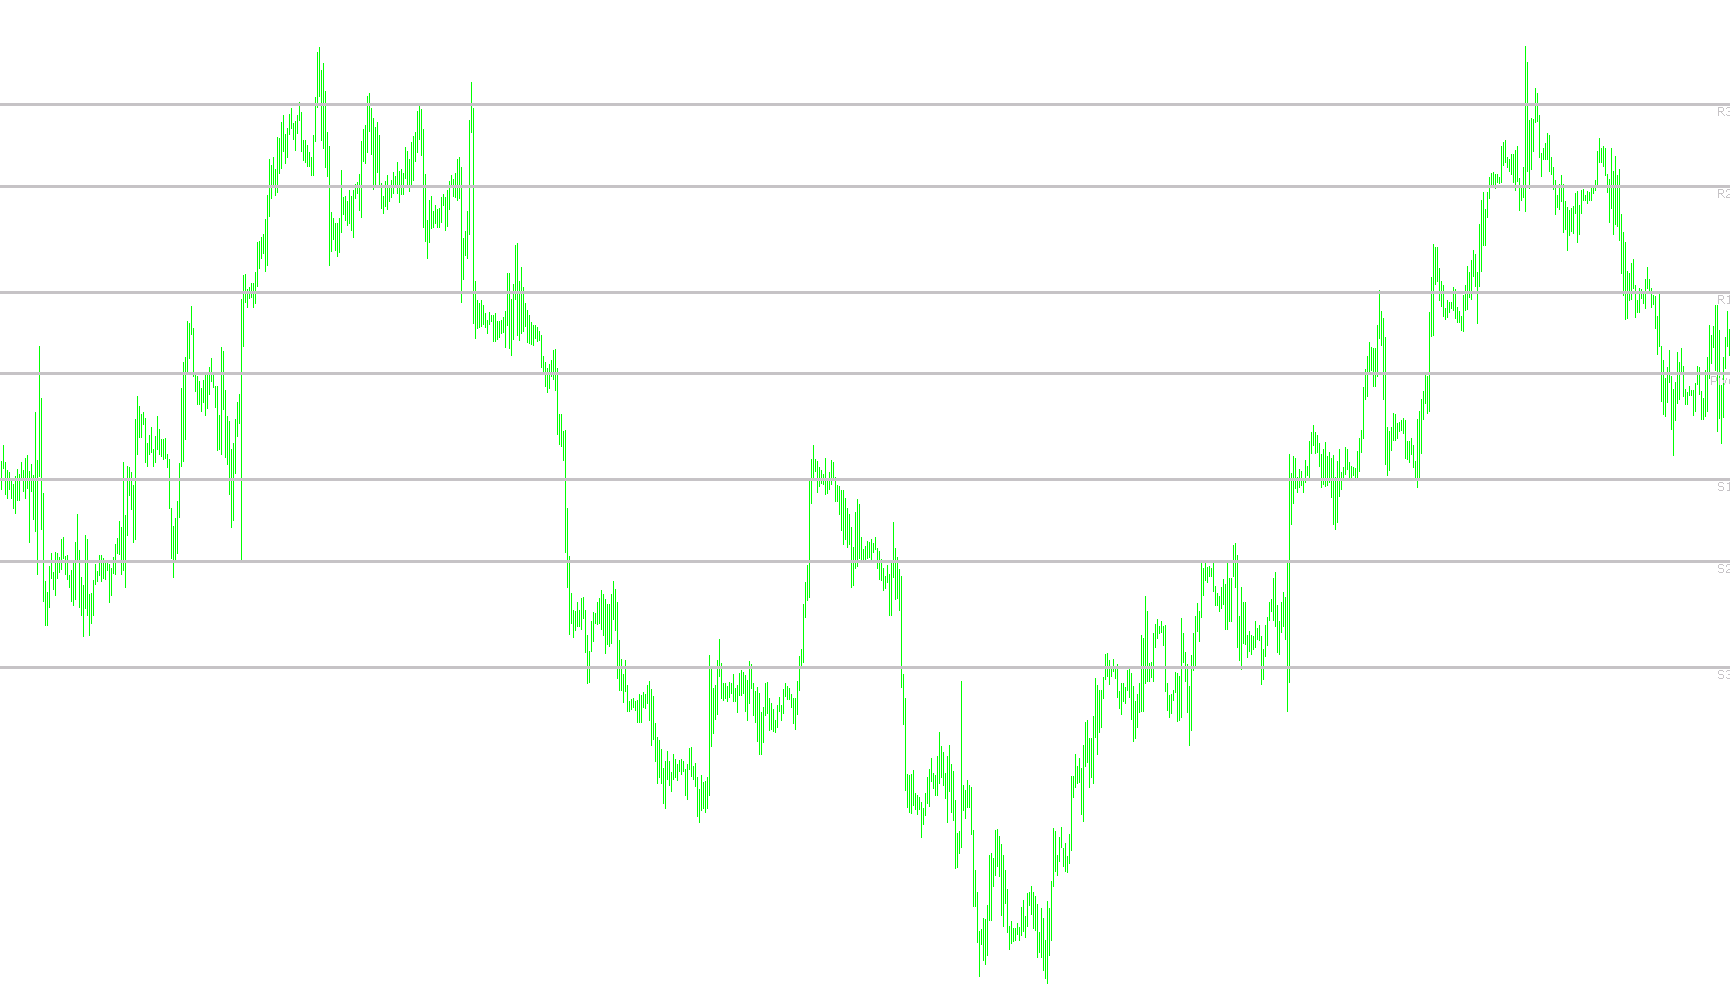
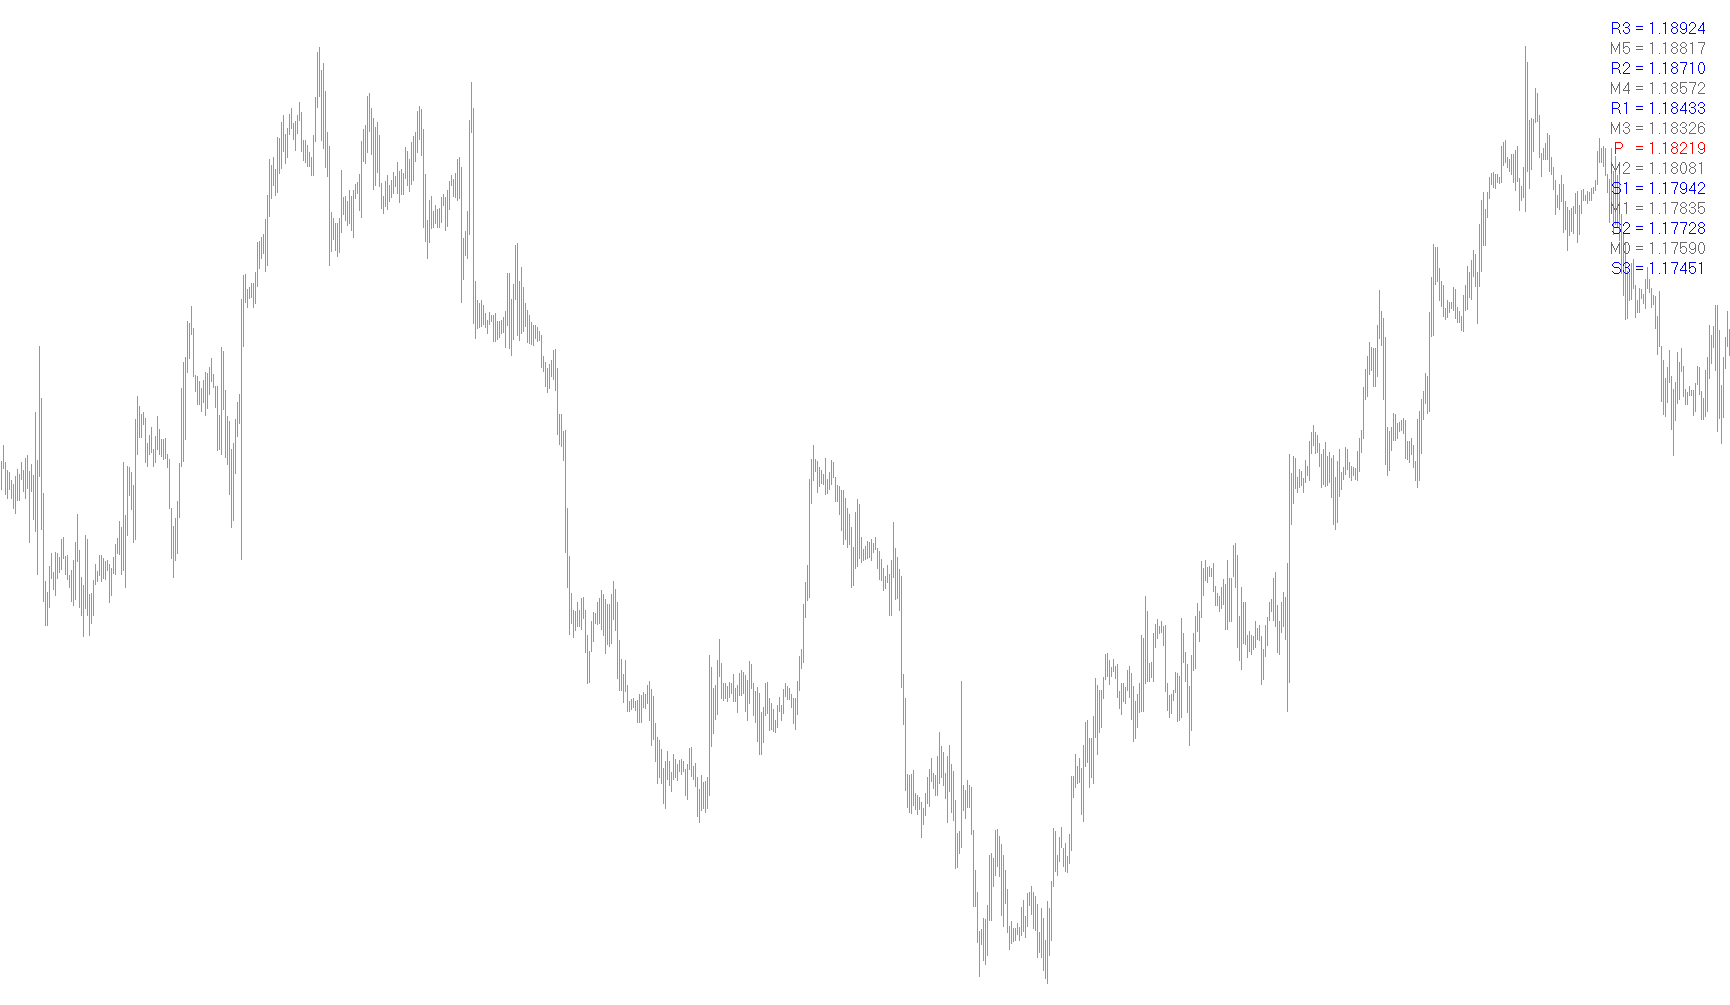
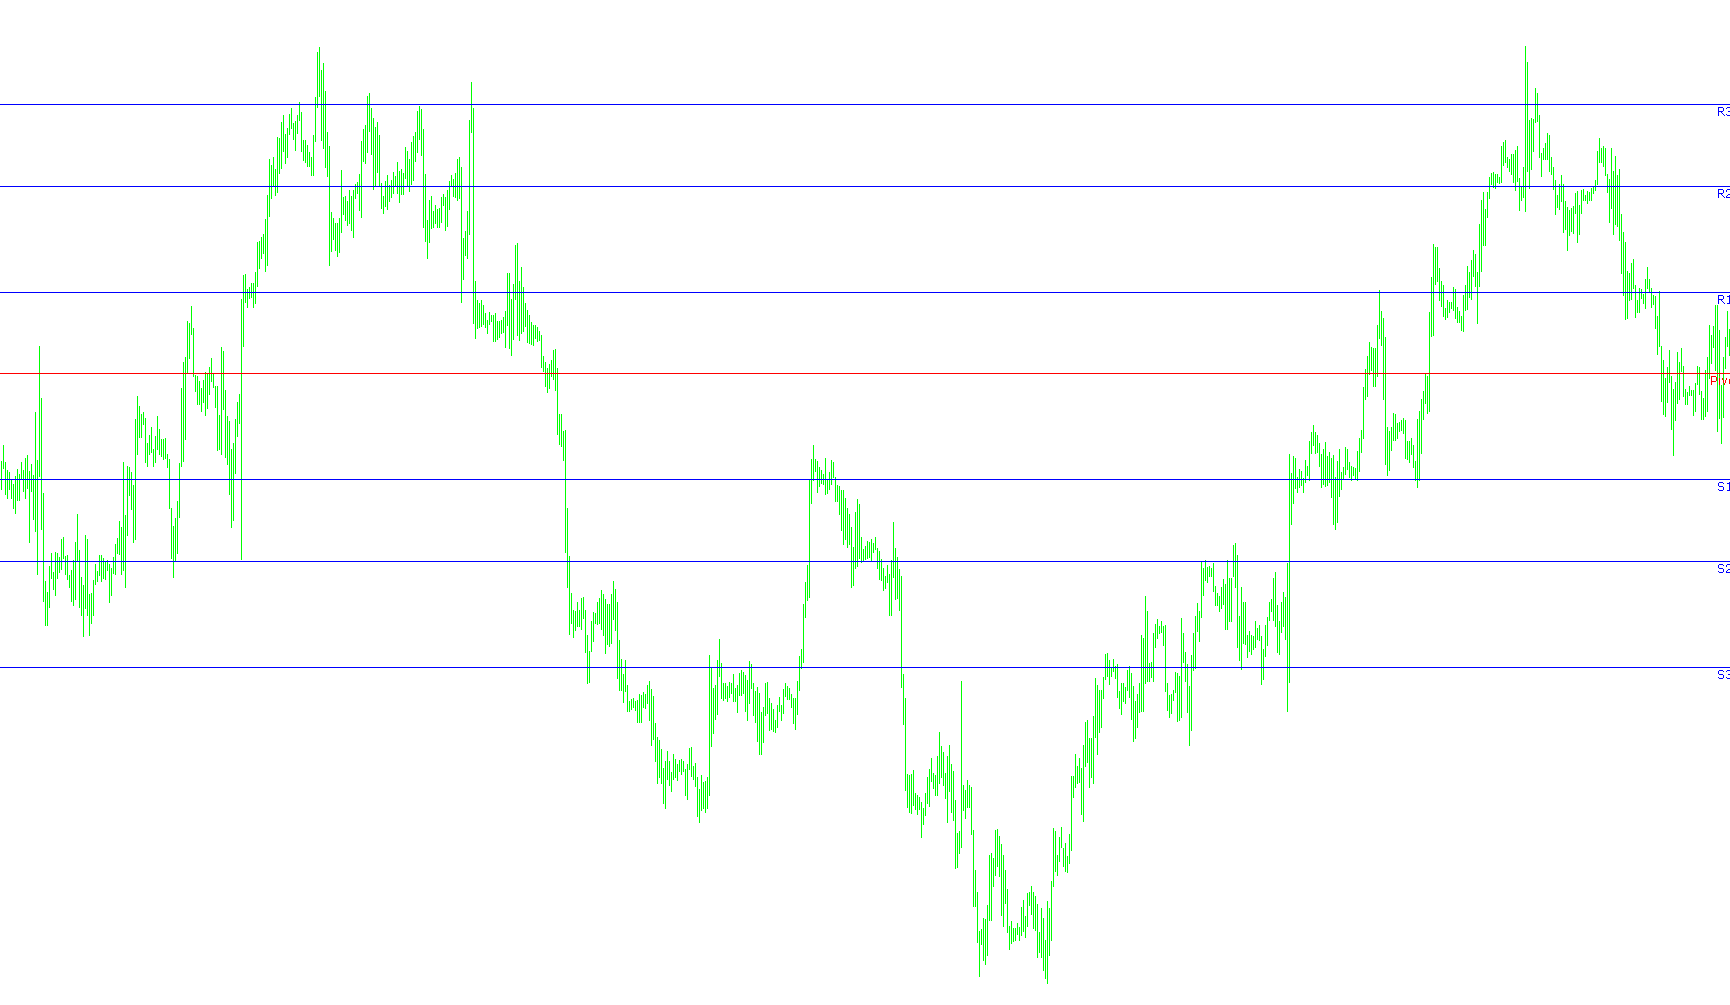
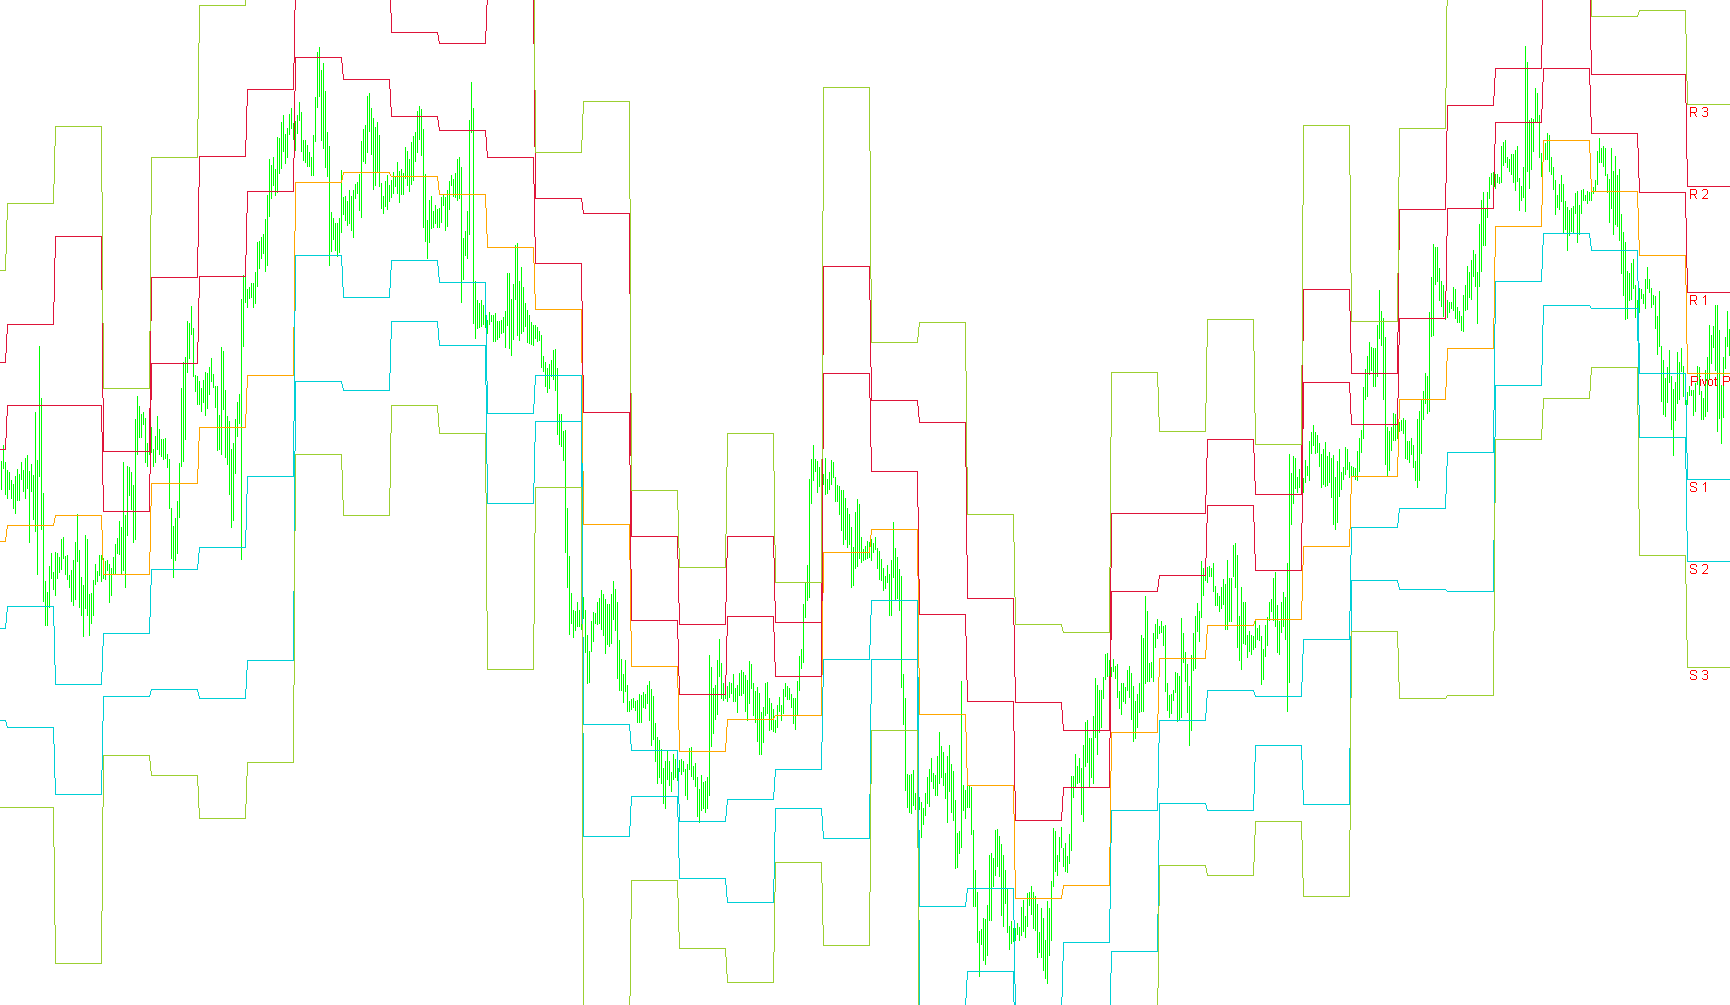
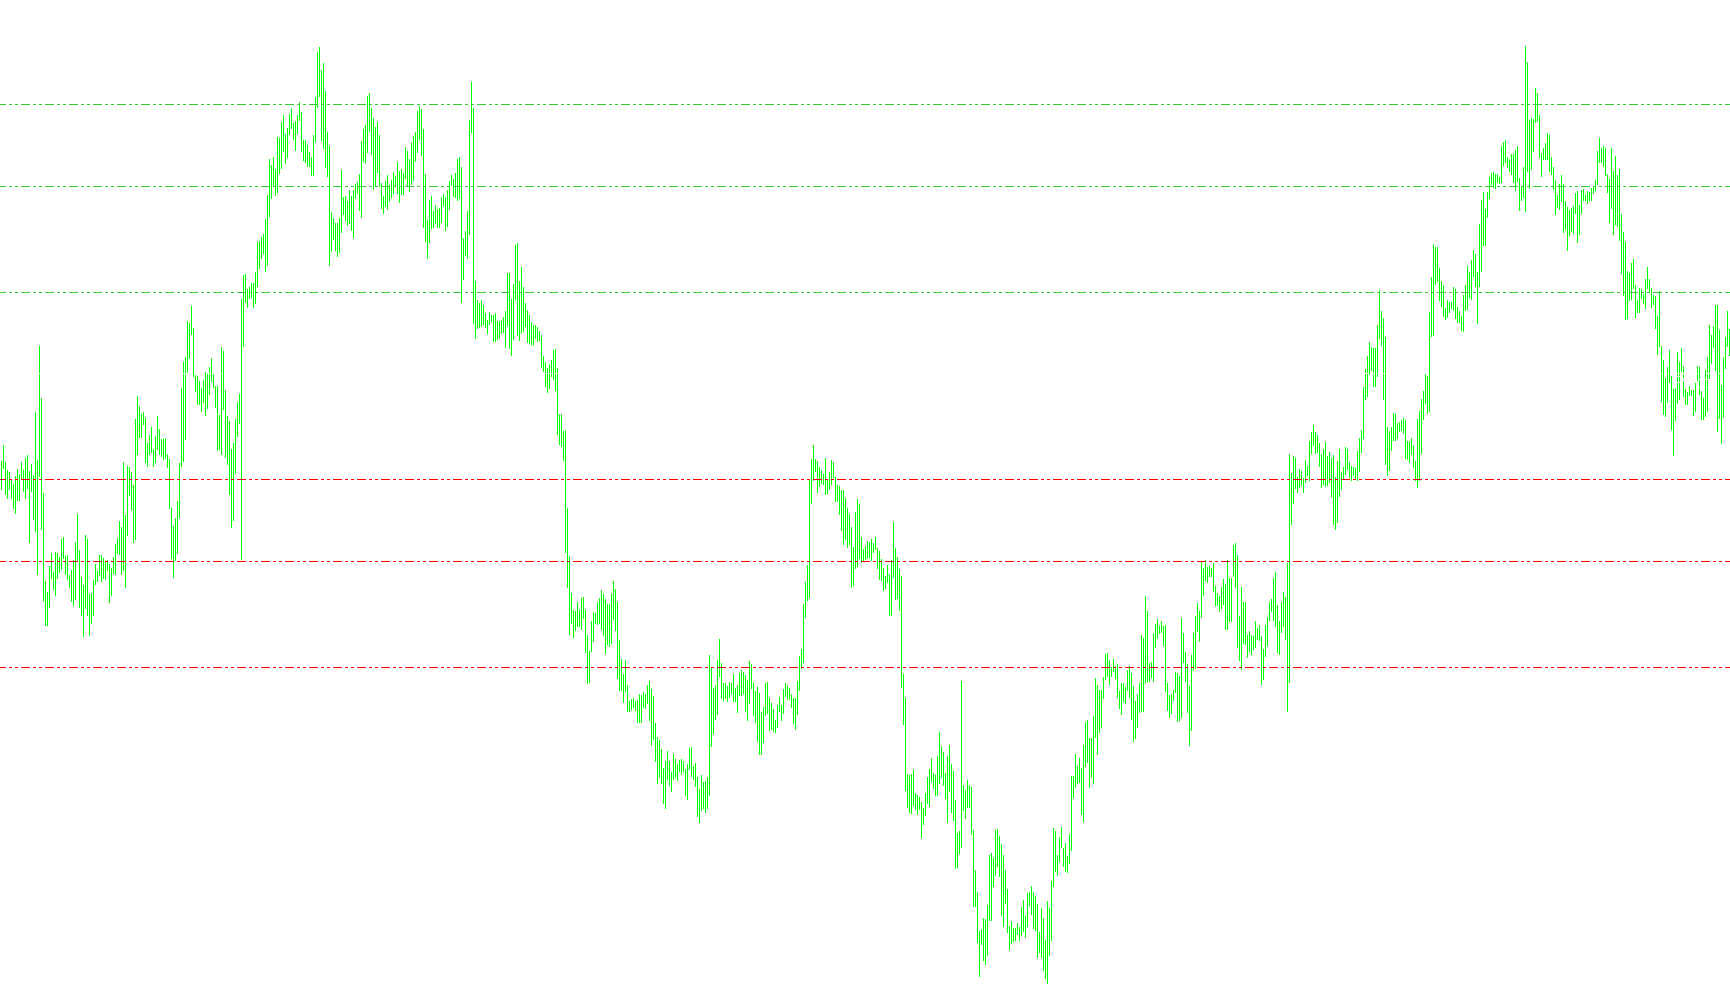
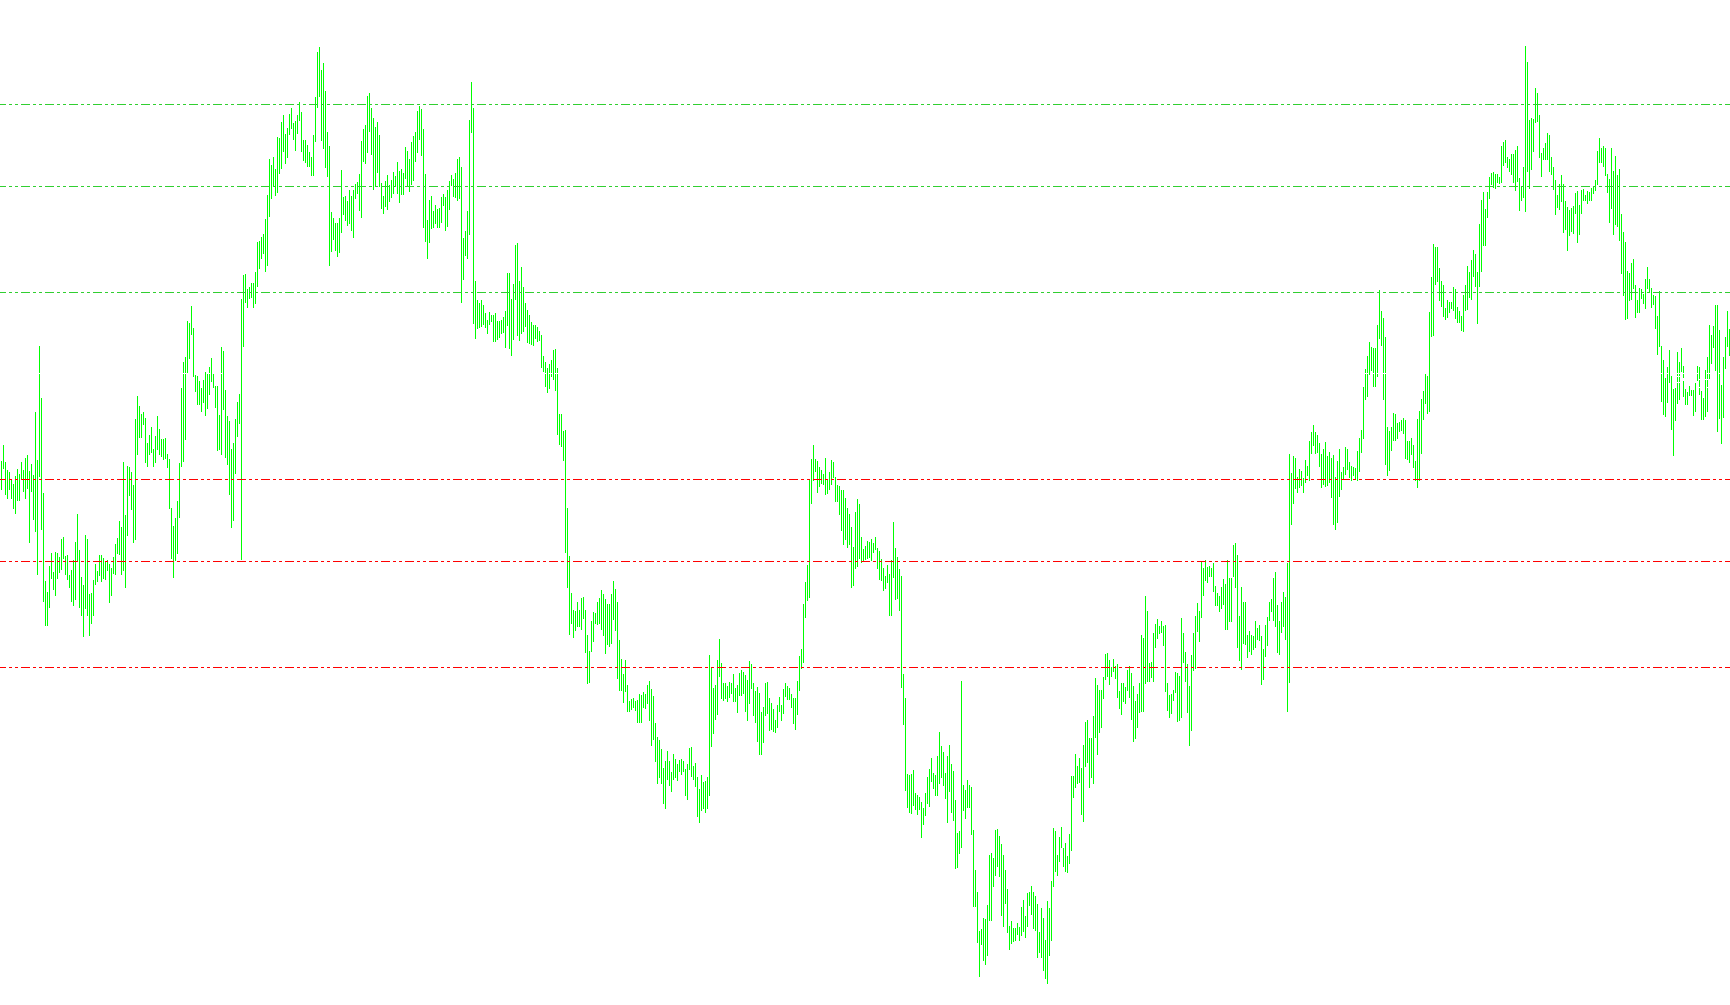
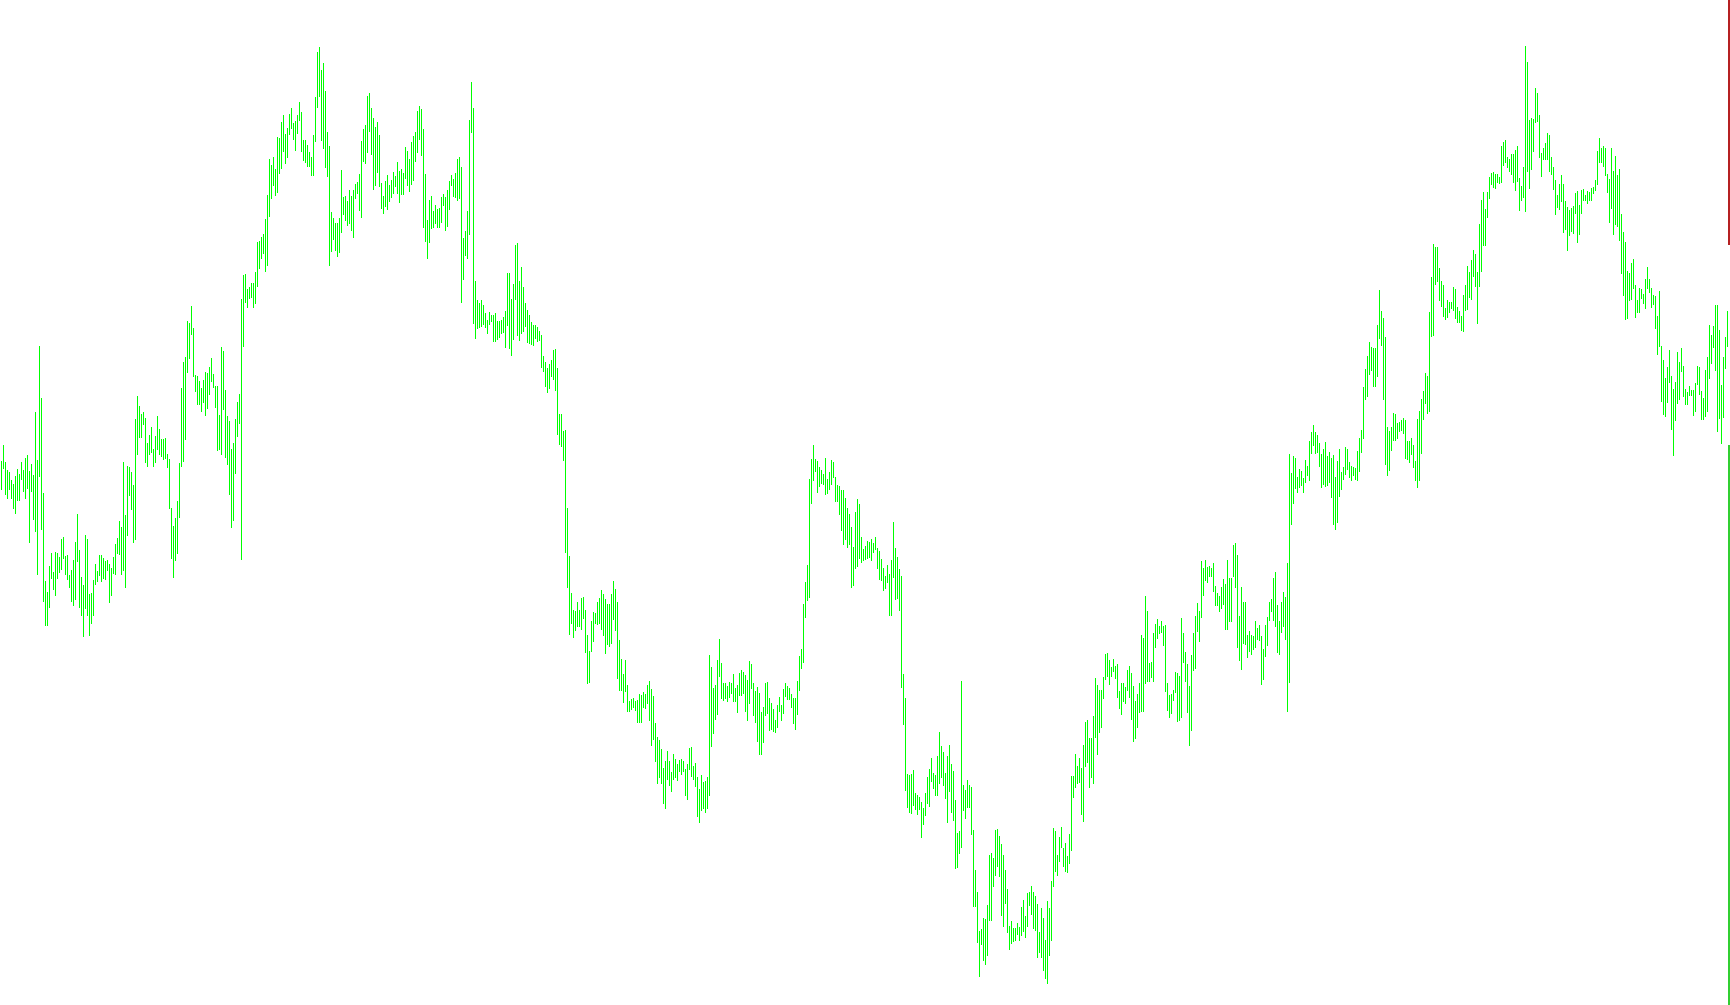
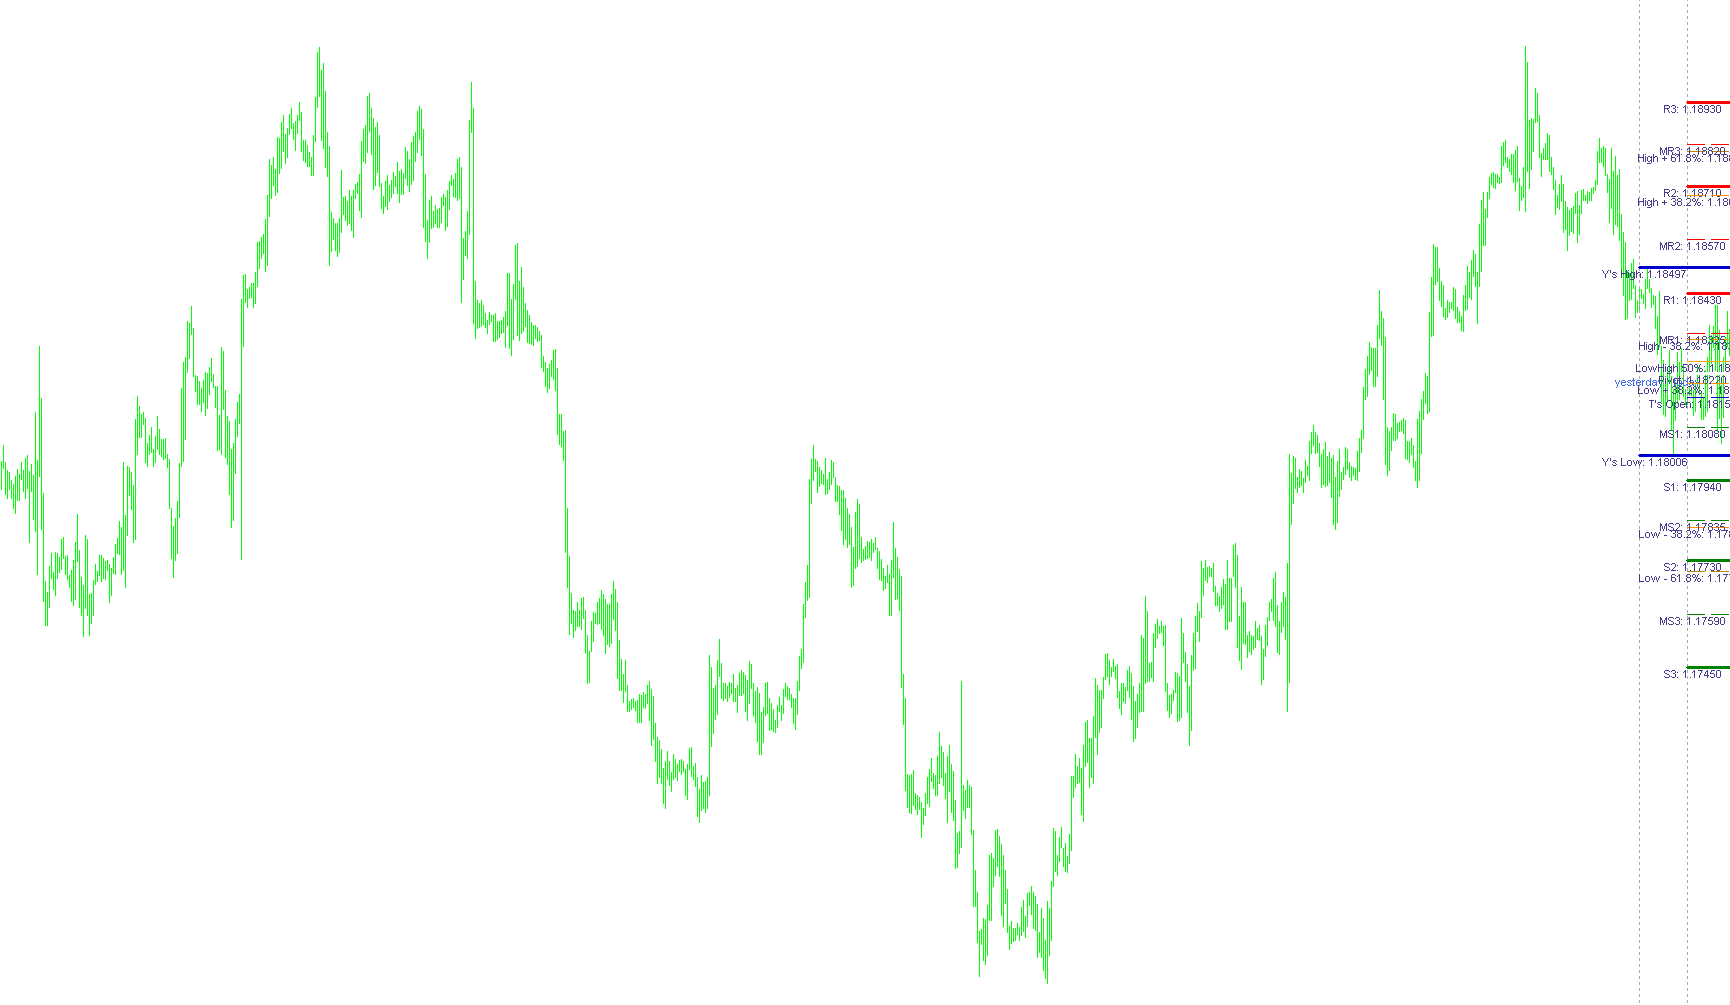
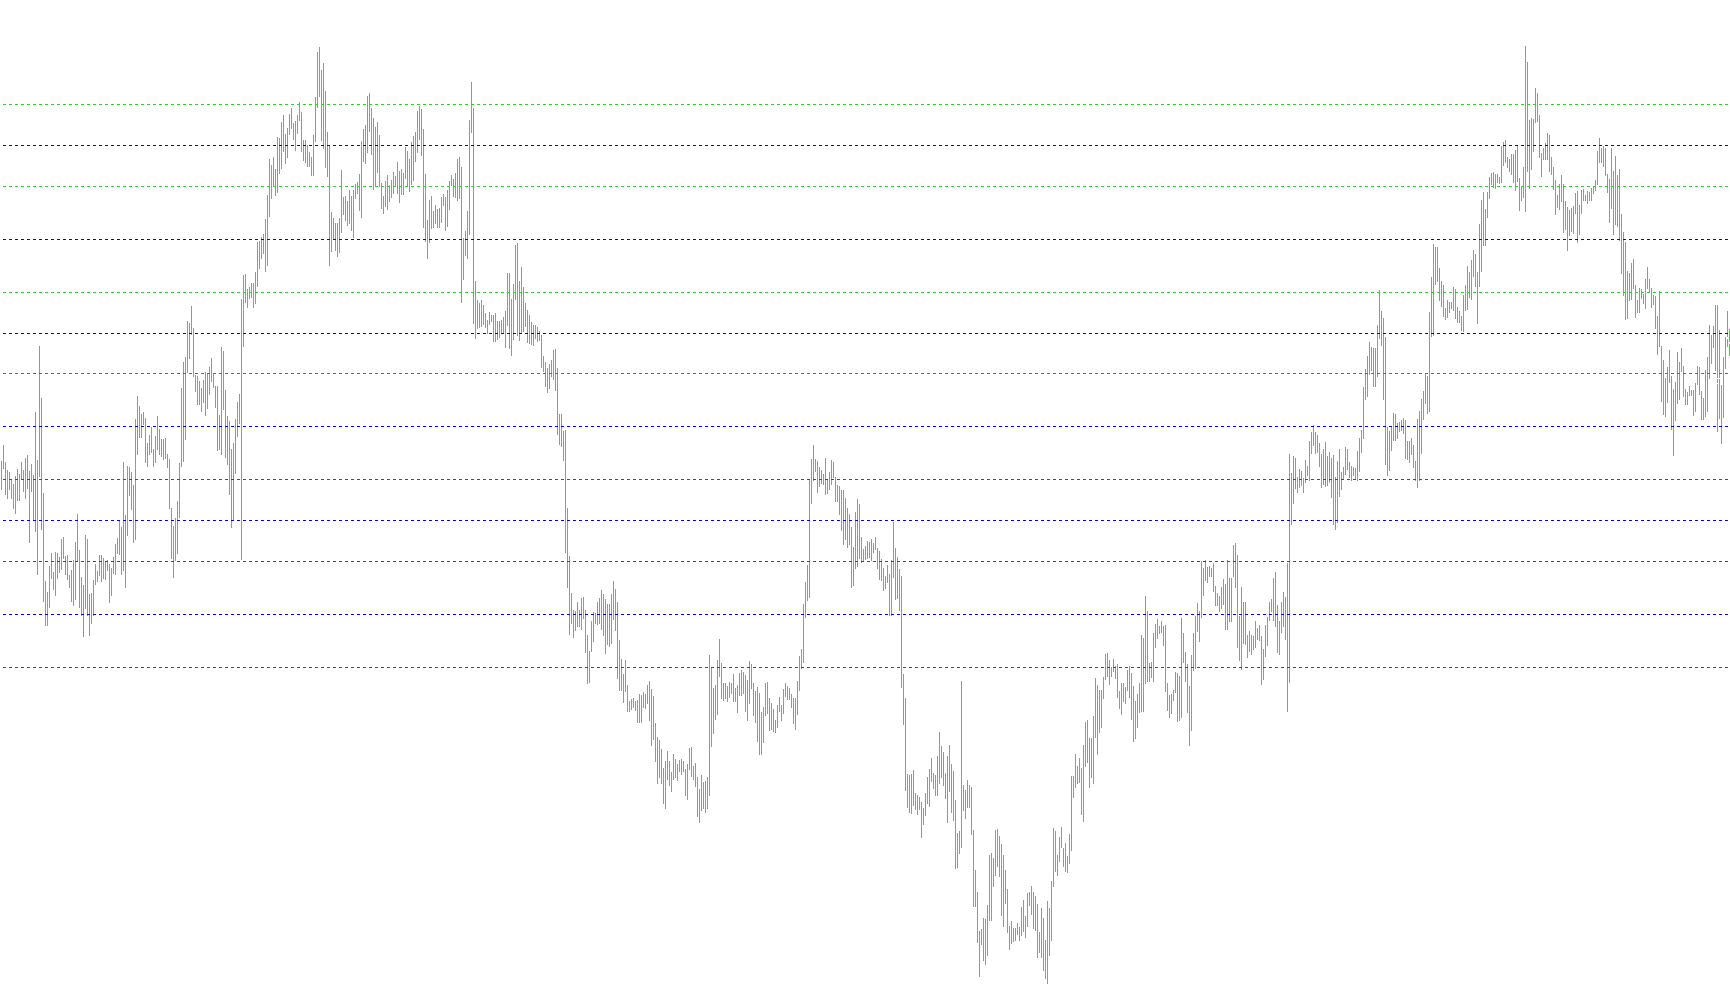
This indicator calculates and plots daily floor-to-ceiling price levels by deriving standard pivot, support, and resistance boundaries from the previous day's high, low, and closing prices.
Pivot Range
Indicator

Pivot Range

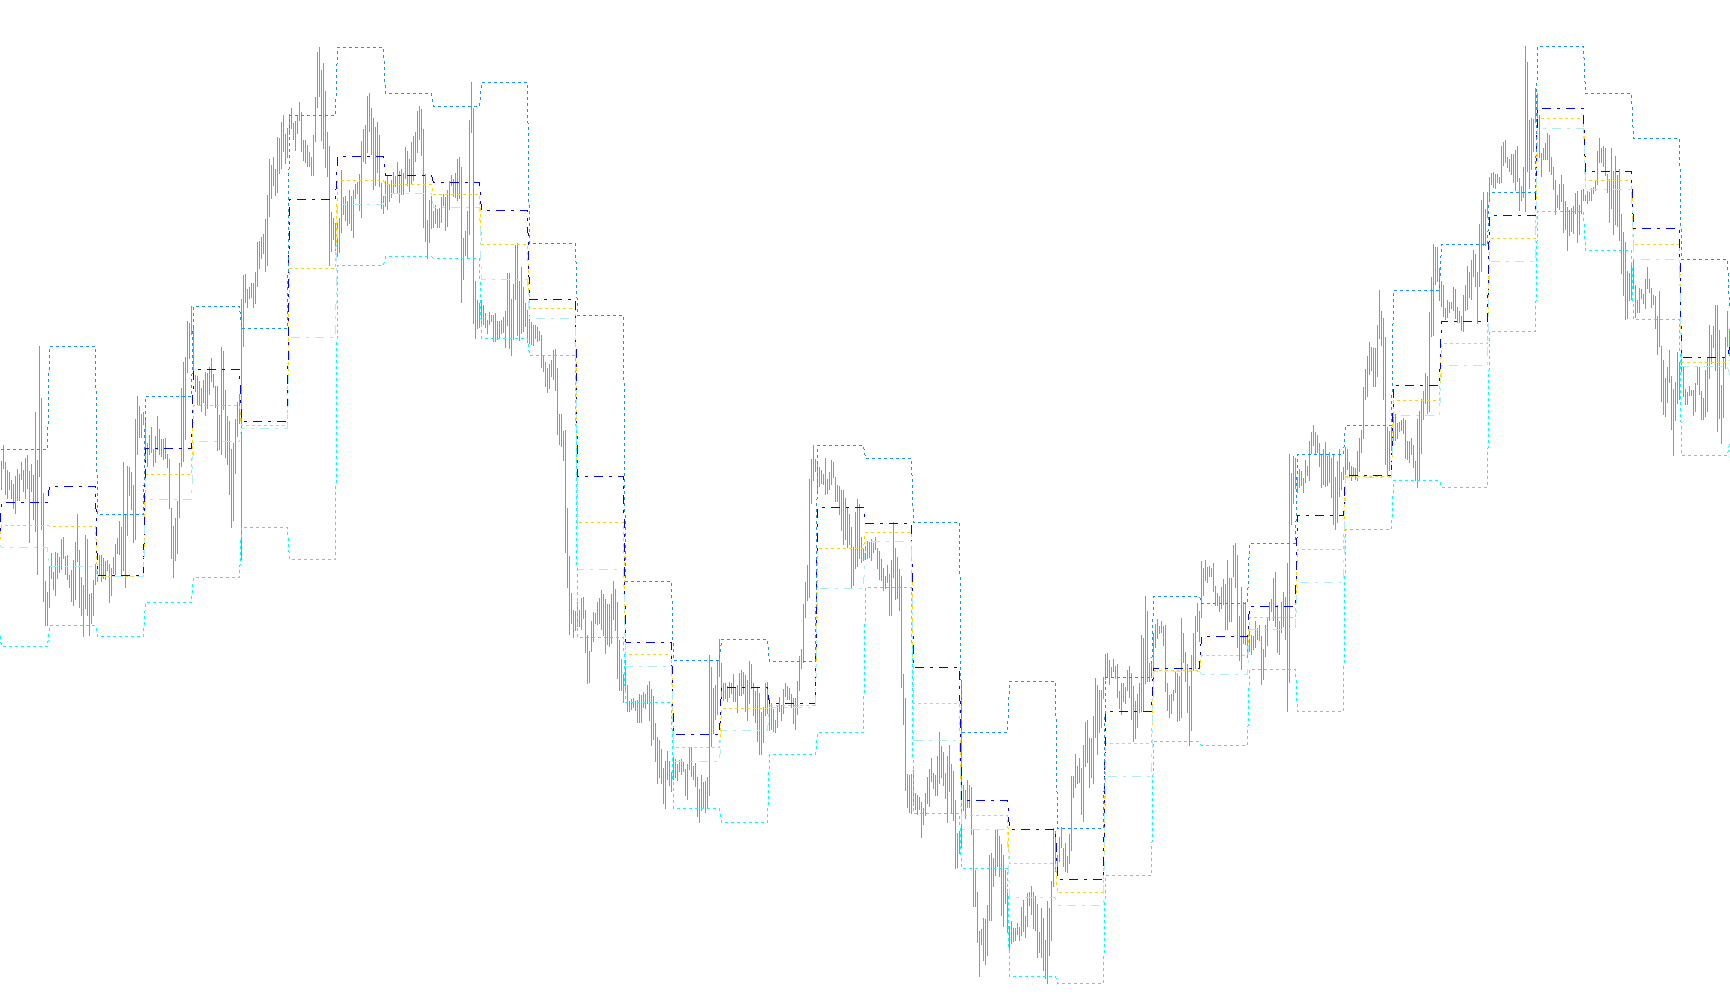
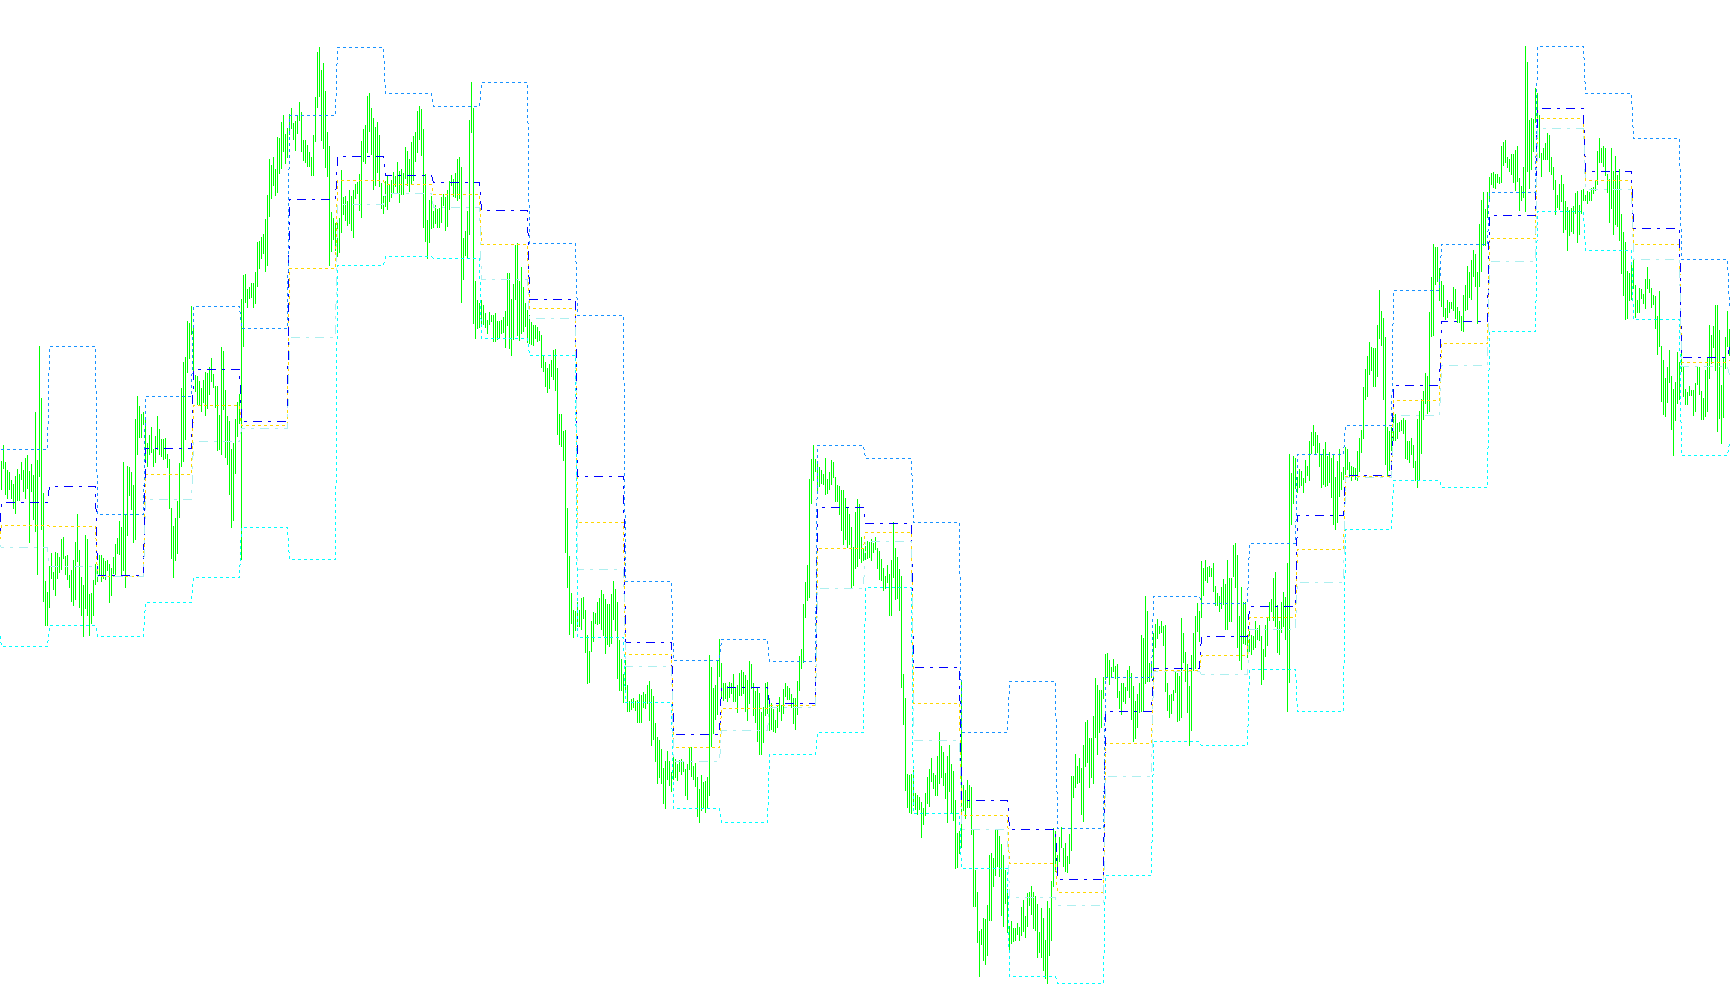
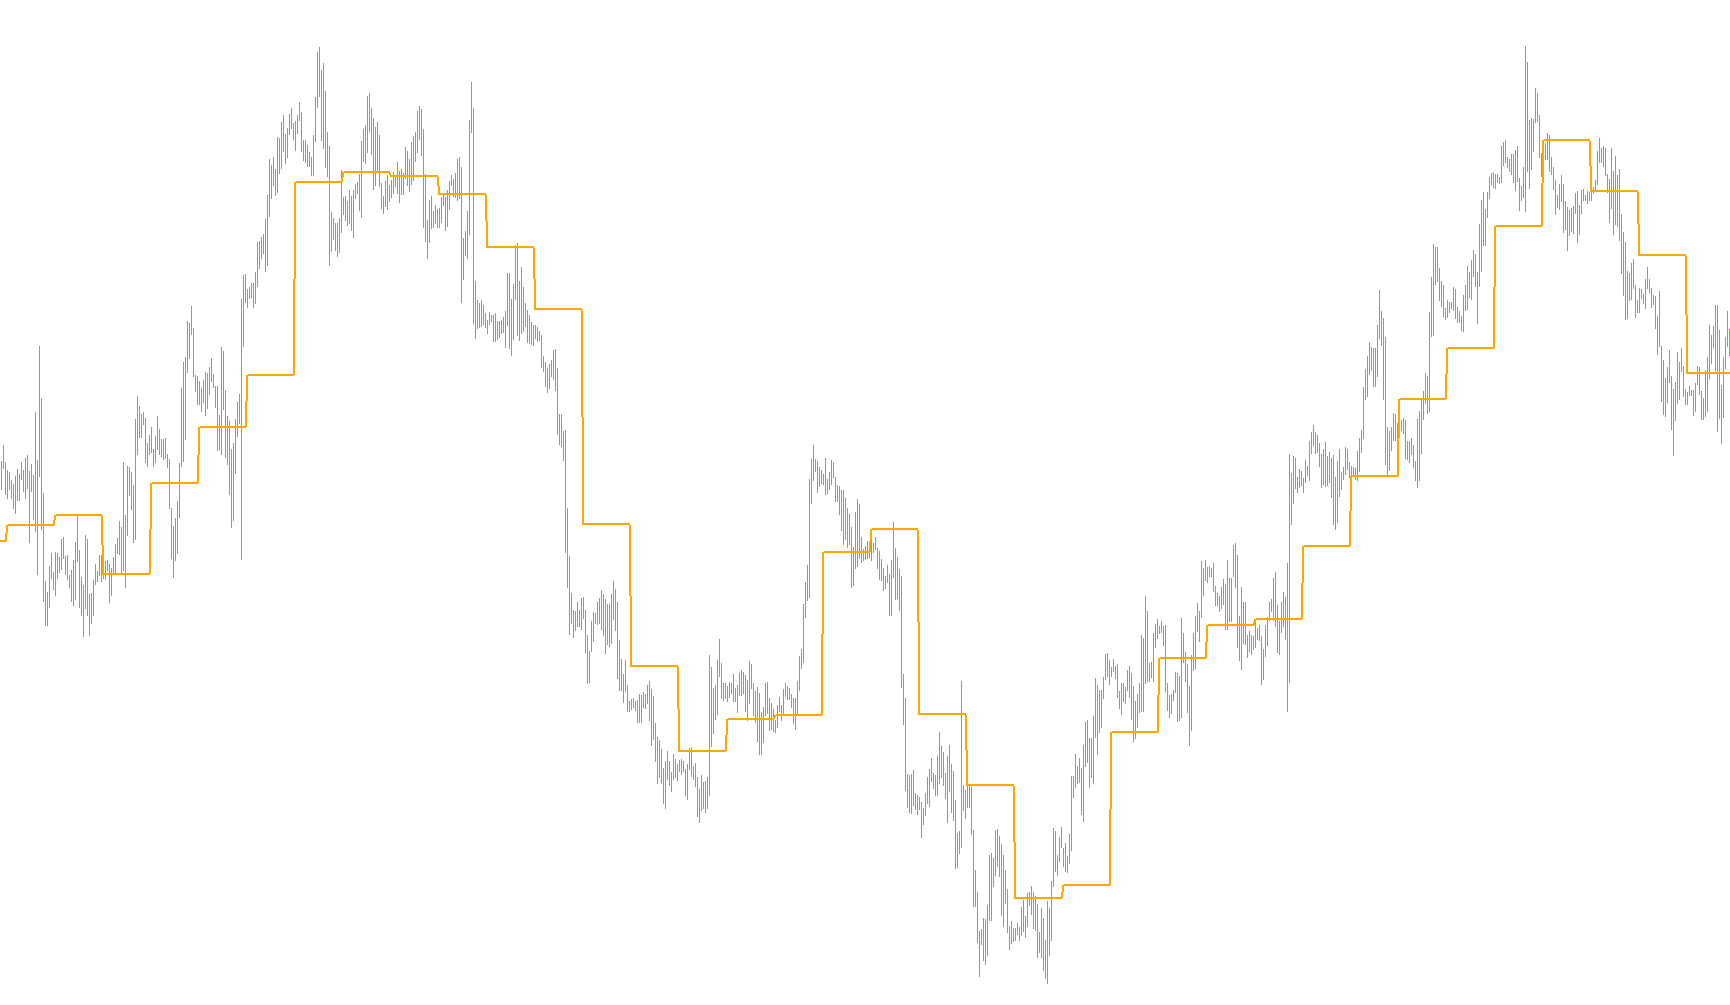
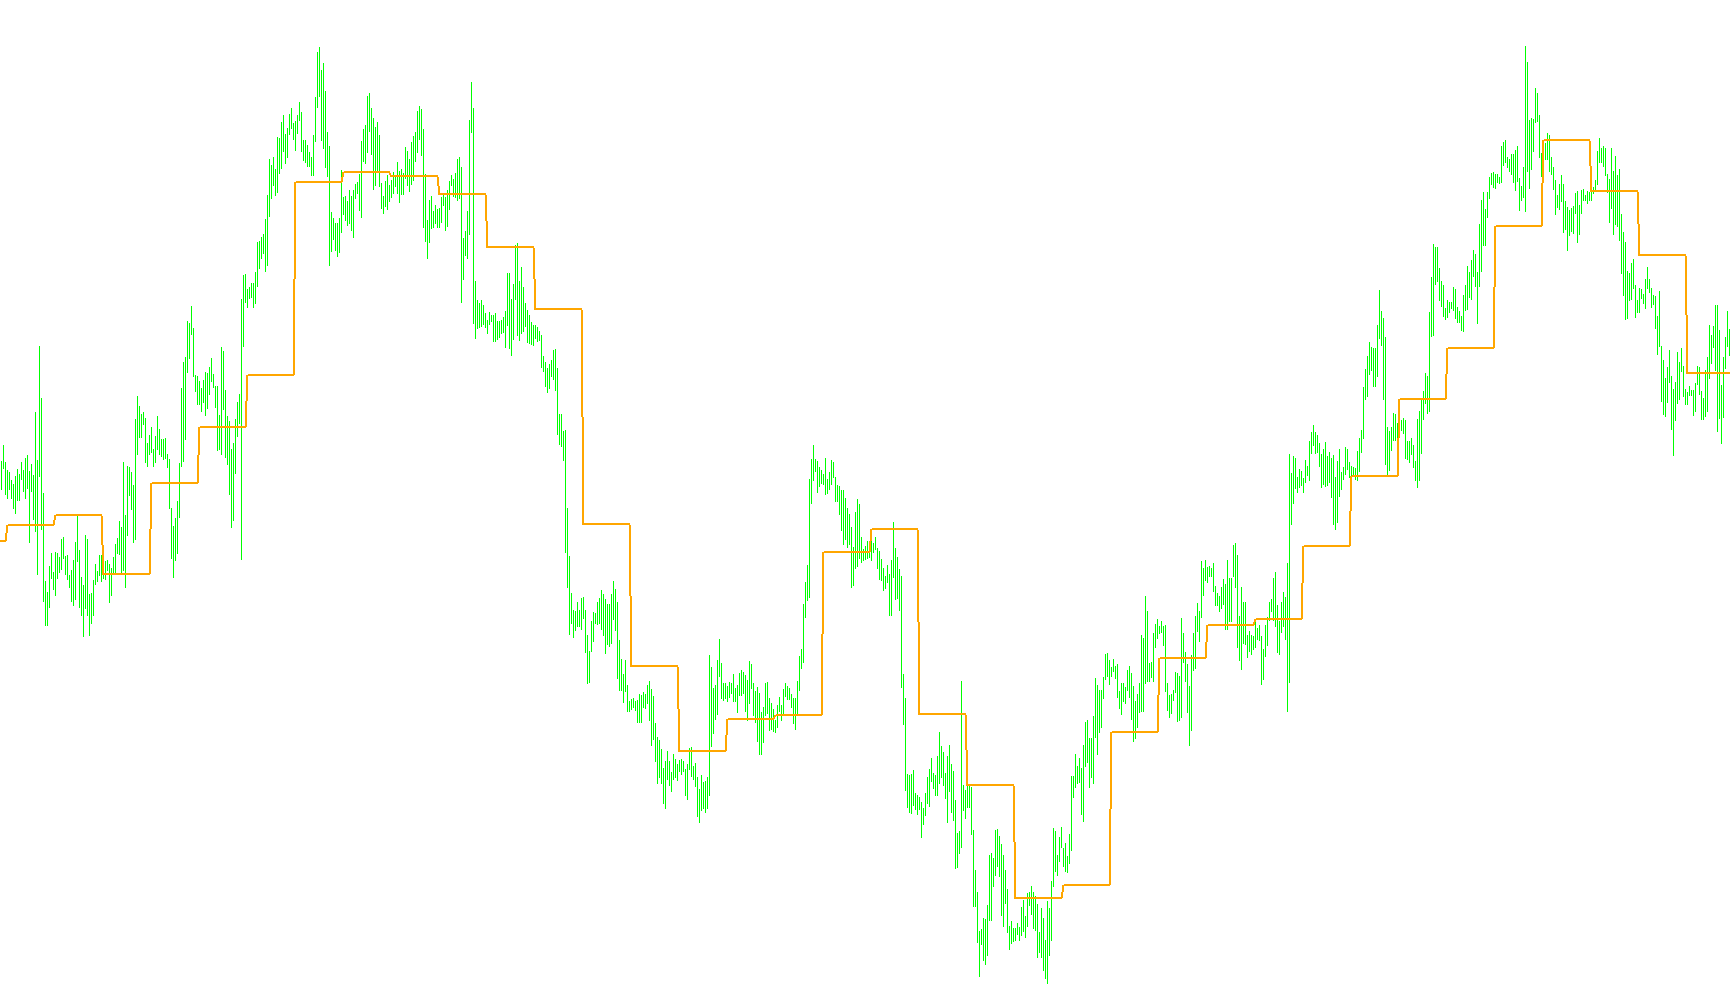
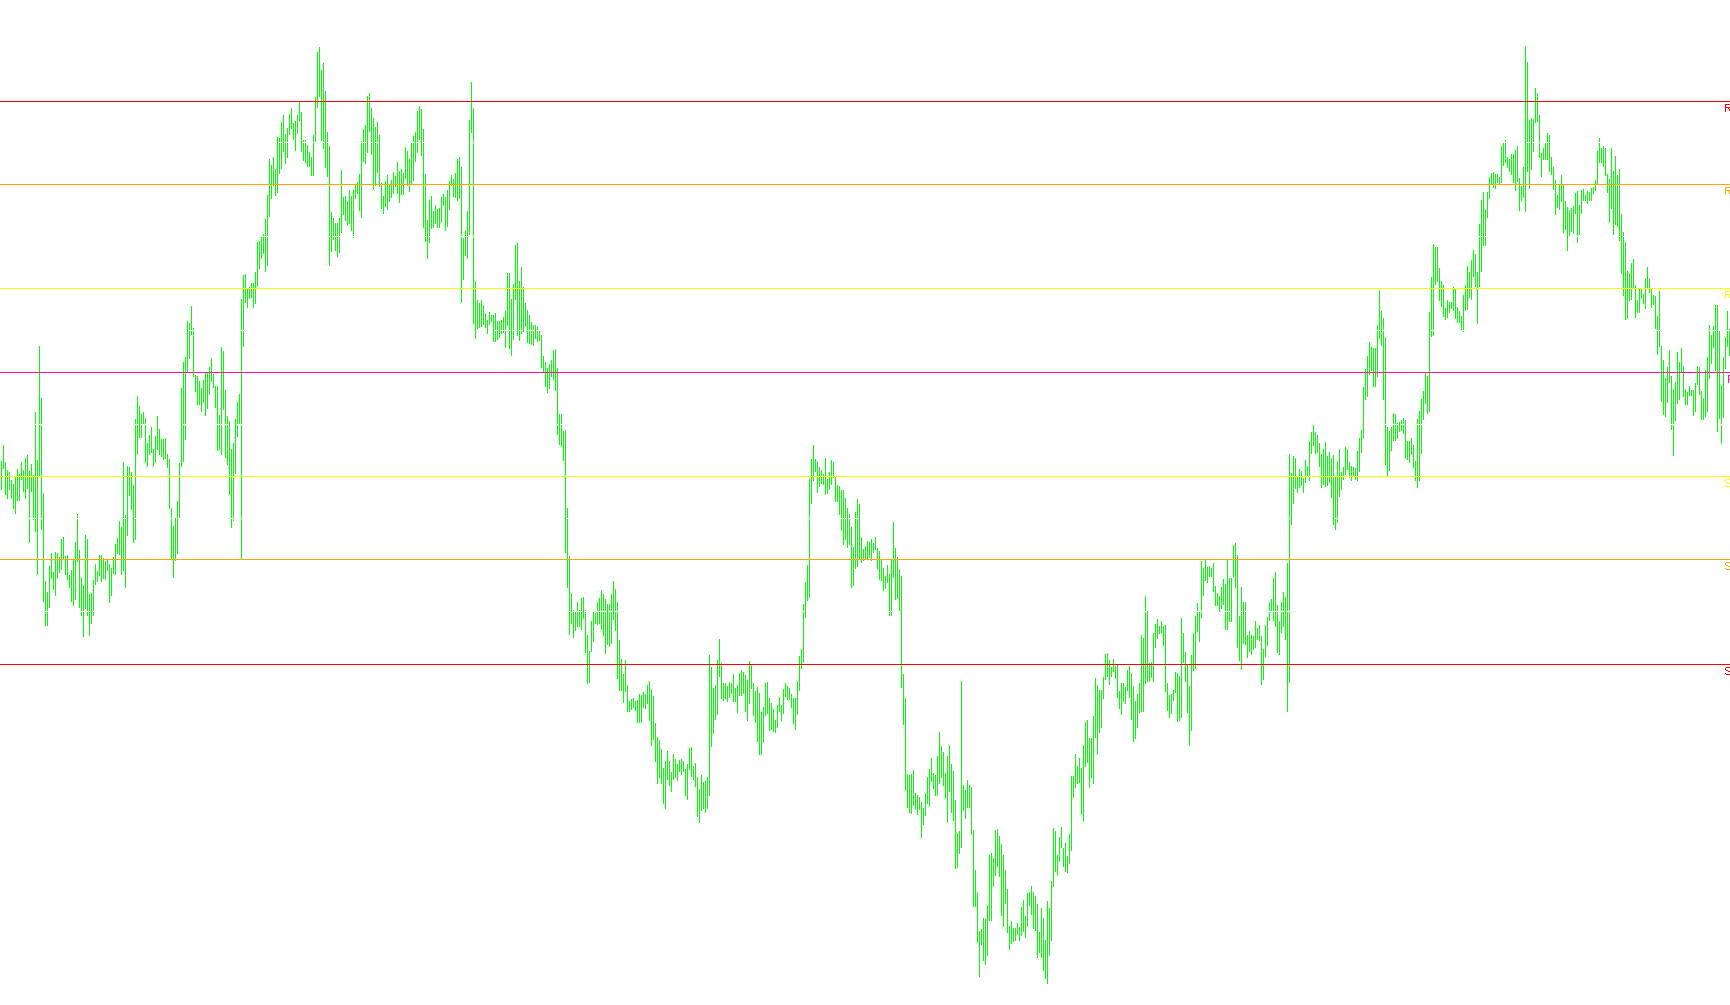
Identifies specific price ranges and calculated equilibrium points based on customizable time windows alongside historical highs, lows, and moving averages.

Pivot Range_v1
Indicator

Pivot Range_v1

This indicator calculates customized pivot points based on high, low, and close prices within a specific time window while mapping previous session extremes and optional moving averages.

Pivot SR-mod
Indicator

Pivot SR-mod

This indicator calculates daily pivot points, support levels, and resistance zones by deriving price equilibrium from the previous period's high, low, and closing values.

Pivot SR
Indicator

Pivot SR

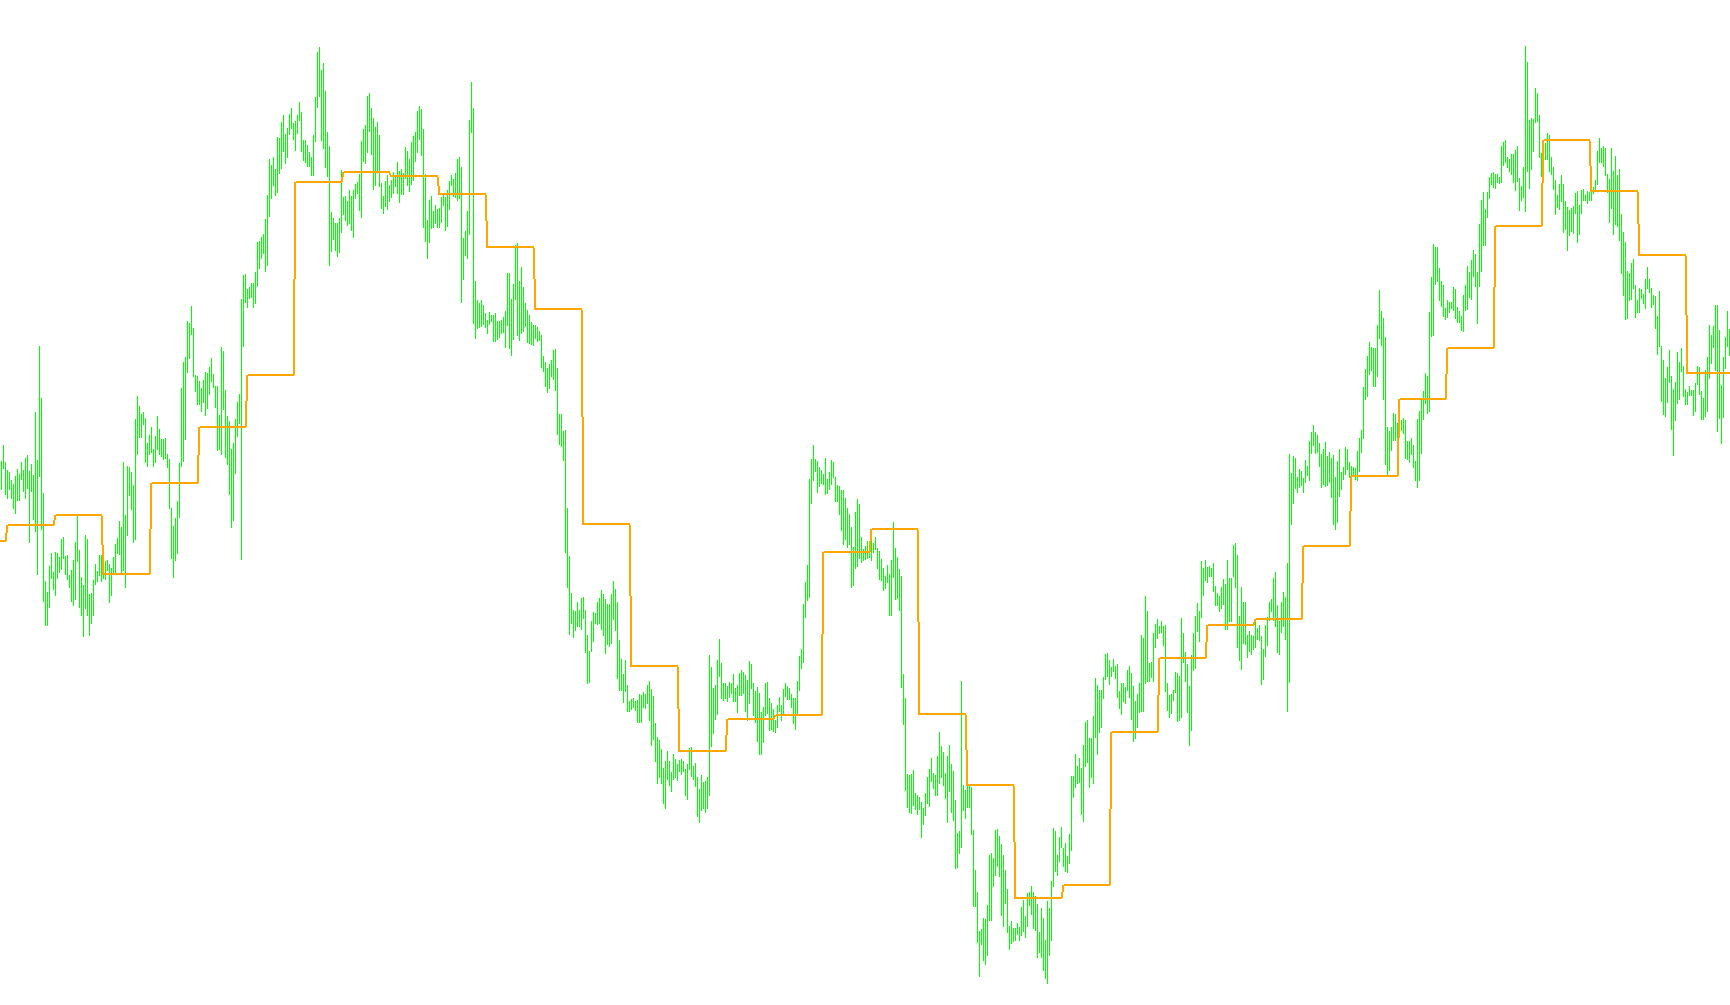
This indicator dynamically calculates central price equilibrium by averaging the previous day's high, low, and closing prices to identify key rotational support levels.

Pivot SR_v1
Indicator

Pivot SR_v1

This indicator calculates the central price equilibrium by averaging the previous day's high, low, and closing prices to identify structural rotation points.

Pivot Support Resistance Auto
Indicator

Pivot Support Resistance Auto

This indicator projects daily horizontal support and resistance levels by synthesizing standard pivot point calculations with Golden Ratio coefficients derived from previous session volatility.

Pivot with Mid Levels
Indicator

Pivot with Mid Levels

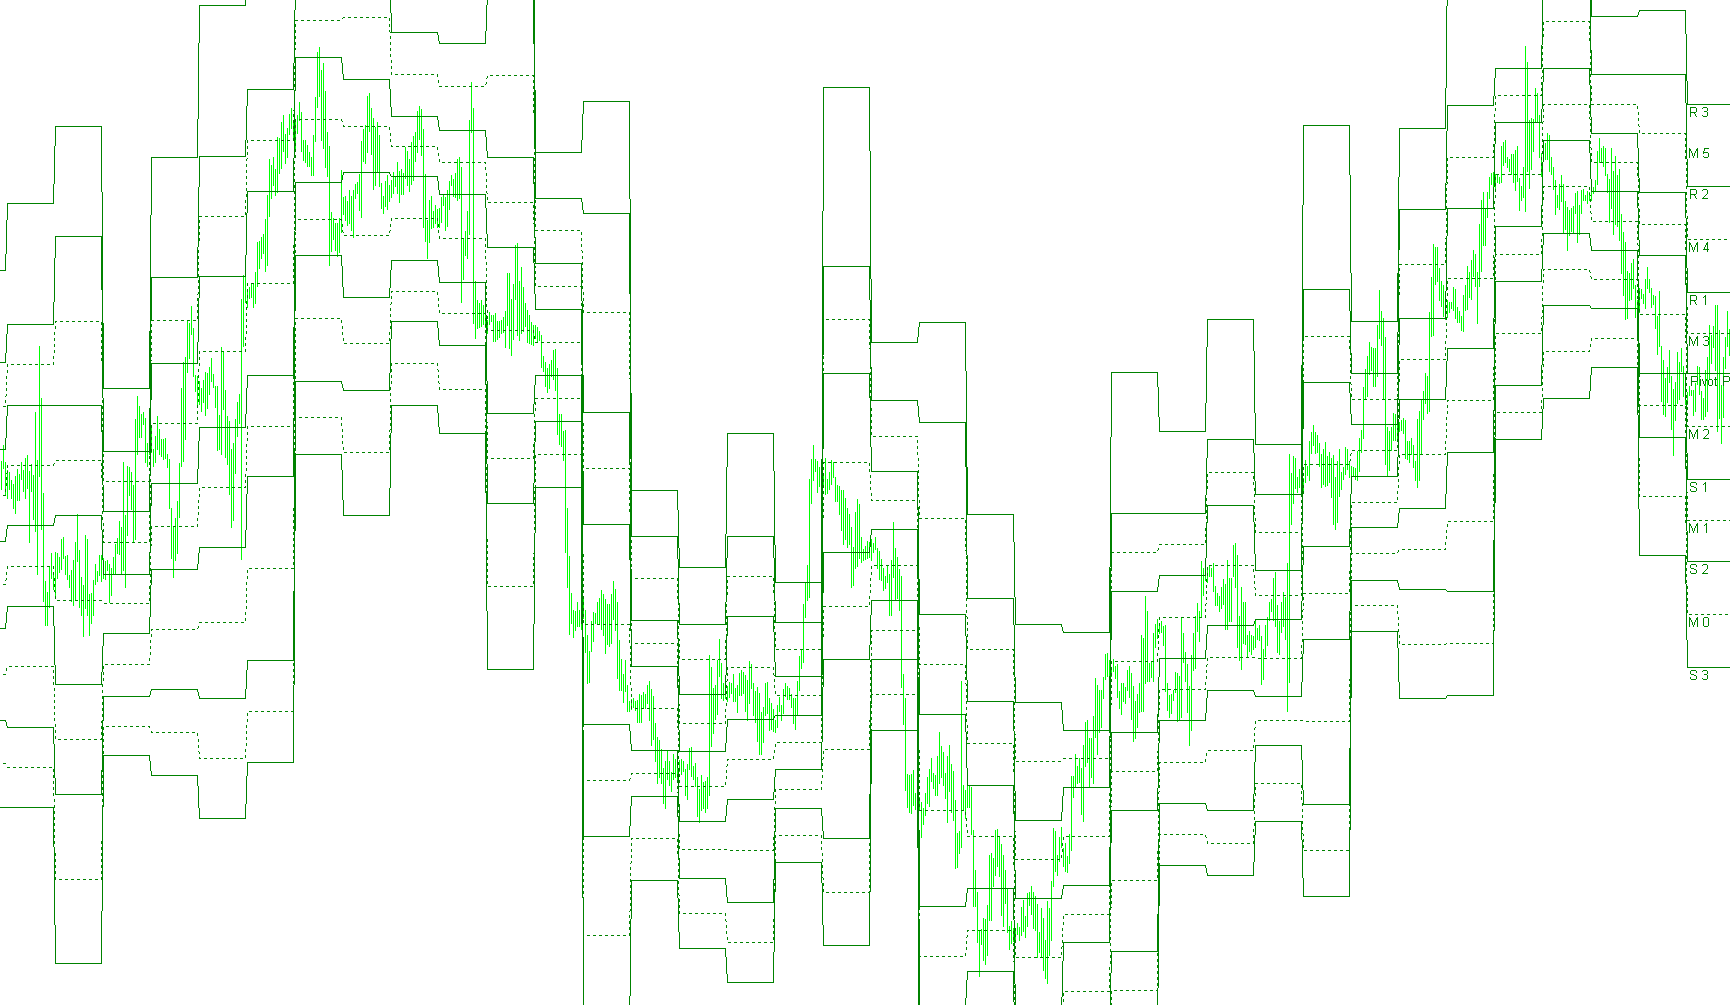
This indicator calculates daily pivot points and extends them with intermediate midpoint levels to identify granular price equilibrium zones.

Pivot(23JUL05)
Indicator

Pivot(23JUL05)

This indicator calculates and plots daily floor and ceiling levels by deriving support and resistance coordinates from the previous period's price extremes.

Pivot(23JUL05)_v1
Indicator

Pivot(23JUL05)_v1

This indicator dynamically projects daily price equilibrium levels and three tiers of support/resistance boundaries based on the previous session's volatility range.

Pivot-2
Indicator

Pivot-2

This indicator calculates daily floor price levels by identifying primary pivot points and projecting three tiers of support and resistance based on previous session high, low, and closing price dynamics.

Pivot-2_v1
Indicator

Pivot-2_v1

This indicator calculates and plots daily pivot points, support levels, and resistance zones using a recursive high-low-close formula to identify key price equilibrium shifts.

Pivot-2_v2
Indicator

Pivot-2_v2

This indicator automatically calculates and plots daily pivot points, support levels, and resistance zones by synthesizing the previous period's price extremes with the current opening equilibrium.

Pivot-Calculator
Indicator

Pivot-Calculator

This indicator calculates and plots a comprehensive grid of Standard, Midpoint, and Mid-Mid pivot levels based on historical daily price action to identify high-probability support and resistance zones.

Pivot-CalculatorM
Indicator

Pivot-CalculatorM

This indicator automatically calculates and projects standard daily pivot points, including three levels of support and resistance, by analyzing historical price ranges and handling weekend market gaps.

Pivot-Calculator_001
Indicator

Pivot-Calculator_001

This indicator automatically calculates and maps high-precision standard, intermediate, and multi-level support/resistance zones derived from historical daily price action.

Pivot-Calculator_002
Indicator

Pivot-Calculator_002

This indicator automates the calculation and visual plotting of standard daily pivot points, along with primary and secondary support and resistance levels, by analyzing historical high, low, and closing prices.

Pivot-Calculator_004
Indicator

Pivot-Calculator_004

This indicator automatically calculates and plots daily pivot points, primary support levels (S1-S3), and resistance levels (R1-R3) based on previous session price action and high-low volatility.

Pivot-point-vTEXT
Indicator

Pivot-point-vTEXT

This indicator mathematically derives daily pivot points and intermediary M-levels to visualize liquidity zones and structural price shifts based on historical high, low, and closing data.

Pivot-point
Indicator

Pivot-point

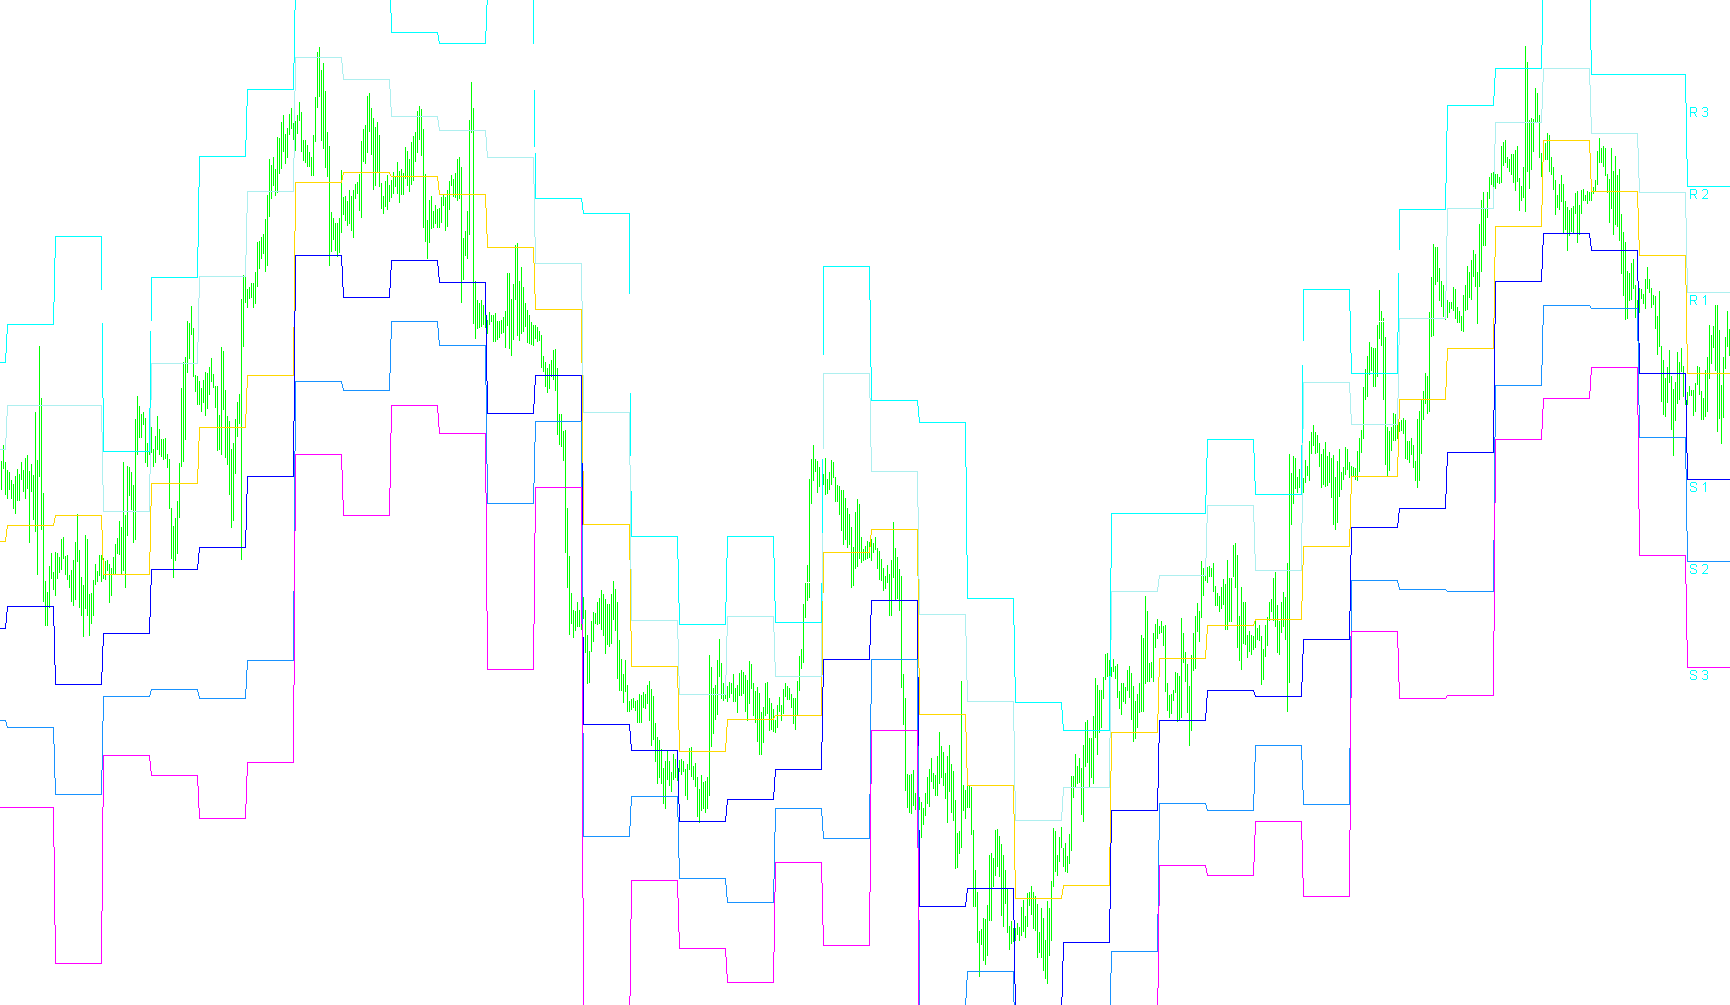
This indicator automatically calculates and plots daily floor pivots, resistance levels (R1-R3), and support levels (S1-S3) based on historical price action ranges.

Pivot
Indicator

Pivot

This indicator dynamically calculates and plots the central pivot point based on the previous period's high, low, and closing prices to identify significant structural balance levels.

Pivot1
Indicator

Pivot1

This indicator calculates and plots standard pivot point levels, support, and resistance lines by utilizing the previous period's high, low, and closing prices to establish structural equilibrium.

Pivot1_v1
Indicator

Pivot1_v1

Calculates daily floor price levels and overhead resistance zones by synthesizing the previous period's high, low, and closing prices.

Pivot1_v2
Indicator

Pivot1_v2

This indicator calculates and plots multi-level horizontal support and resistance zones based on the previous day's price action extremes to identify potential reversal points.

PivotCustomTime
Indicator

PivotCustomTime

This indicator dynamically plots standard pivots, Camarilla levels, and midpoint boundaries by synthesizing historical price ranges with real-time volatility metrics.

PivotCustomTime_v1
Indicator

PivotCustomTime_v1

This indicator dynamically projects Standard, Fibonacci-based, Midpoint, and Camarilla price levels by calculating historical range volatility.

PivotCustomTime____
Indicator

PivotCustomTime____

This indicator projects dynamic support and resistance levels by calculating standard pivot points, Camarilla range boundaries, and intermediate midpoint zones based on historical price action.

PivotCustom_4TimeFrames
Indicator

PivotCustom_4TimeFrames

This indicator dynamically calculates and projects comprehensive pivot levels, including standard support/resistance points and intermediate midpoints, across 4-hour, daily, weekly, and monthly timeframes.

PivotCustom_4TimeFrames2
Indicator

PivotCustom_4TimeFrames2

This indicator automatically projects and renders synchronized pivot levels, including support and resistance zones, across 4-hour, daily, weekly, and monthly timeframes with optional midpoint subdivision.

PivotCustom_4TimeFrames_v1
Indicator

PivotCustom_4TimeFrames_v1

This indicator dynamically calculates and renders comprehensive pivot levels, including support, resistance, and granular midpoints across 4-hour, daily, weekly, and monthly horizons.

PivotDaily
Indicator

PivotDaily

This indicator dynamically calculates and plots multi-level support and resistance zones based on the previous day's price extremes and closing values.

PivotDaily_v1
Indicator

PivotDaily_v1

Calculates and projects historical price equilibrium points, support levels, and resistance boundaries based on the previous day's high, low, and closing prices.

PivotDyna
Indicator

PivotDyna

This indicator calculates daily support and resistance levels by averaging the session's high, low, and weighted closing prices to identify structural pivot points.

PivotLinesINTERBANKv2
Indicator

PivotLinesINTERBANKv2

This indicator dynamically projects standard pivot points, Camarilla levels, and range-based volatility boundaries by synthesizing historical daily price data into real-time horizontal support and resistance zones.

PivotLinesINTERBANKv2_v1
Indicator

PivotLinesINTERBANKv2_v1

This indicator projects high-frequency trading levels by synthesizing daily price action into standard pivots, Camarilla range boundaries, and dynamic volatility spreads.

Indicator

PivotPoints - MT04 - Indicator

Indicator

PivotPoints - MT04 - Indicator_v1

Indicator

PivotPoints MT04

Indicator

PivotPoints MT04a

PivotPointsWeekly_S&M v1
Indicator

PivotPointsWeekly_S&M v1

This indicator dynamically projects weekly price equilibrium levels by calculating central pivots, multi-stage resistance tiers, and support boundaries based on the preceding week's high, low, and closing data.

PivotPointsWeekly_SaM
Indicator

PivotPointsWeekly_SaM

This indicator dynamically calculates and plots weekly pivot points, along with three distinct support and resistance levels based on the previous week's high, low, and closing price data.

Pivots (SDX-TzPivots) 3
Indicator

Pivots (SDX-TzPivots) 3

This indicator synchronizes multi-session pivot points, Fibonacci retracements, and Camarilla levels by dynamically calculating price boundaries based on specific destination time zones.

Pivots By MoStAsHaR15
Indicator

Pivots By MoStAsHaR15

This indicator dynamically projects daily pivot points, multi-tier resistance/support levels, and intermediate midpoints based on previous session price action.

Pivots By MoStAsHaR15_v1
Indicator

Pivots By MoStAsHaR15_v1

This indicator projects key price action boundaries by calculating daily pivot points, multi-layered resistance/support zones, and intermediate midpoint levels based on historical volatility.

PIVOTS cja
Indicator

PIVOTS cja

This indicator calculates and visualizes standard daily pivot levels alongside a specialized mid-point transition series to identify granular support and resistance zones.

Pivots Custom
Indicator

Pivots Custom

This indicator projects comprehensive structural price levels by synthesizing standard pivot points, Camarilla range boundaries, and intermediate midpoint zones based on historical high, low, and closing data.

Pivots Custom_v1
Indicator

Pivots Custom_v1

This indicator dynamically projects traditional and Camarilla range levels along with intermediate midpoint zones to identify key liquidity boundaries and structural rotation points.

Pivots Daily_001
Indicator

Pivots Daily_001

This indicator dynamically maps daily price action by projecting standard pivot points, high-frequency Camarilla levels, and incremental midpoints to identify structural equilibrium zones.

Pivots Daily_v1
Indicator

Pivots Daily_v1

This indicator projects high-precision structural boundaries by synthesizing standard daily pivot levels, Camarilla breakdown values, and intermediate midpoint clusters based on historical price extremes.

Pivots Daily_v2
Indicator

Pivots Daily_v2

This indicator dynamically projects daily pivot points, Camarilla levels, and intermediate midpoints by synthesizing previous session volatility with current price action.