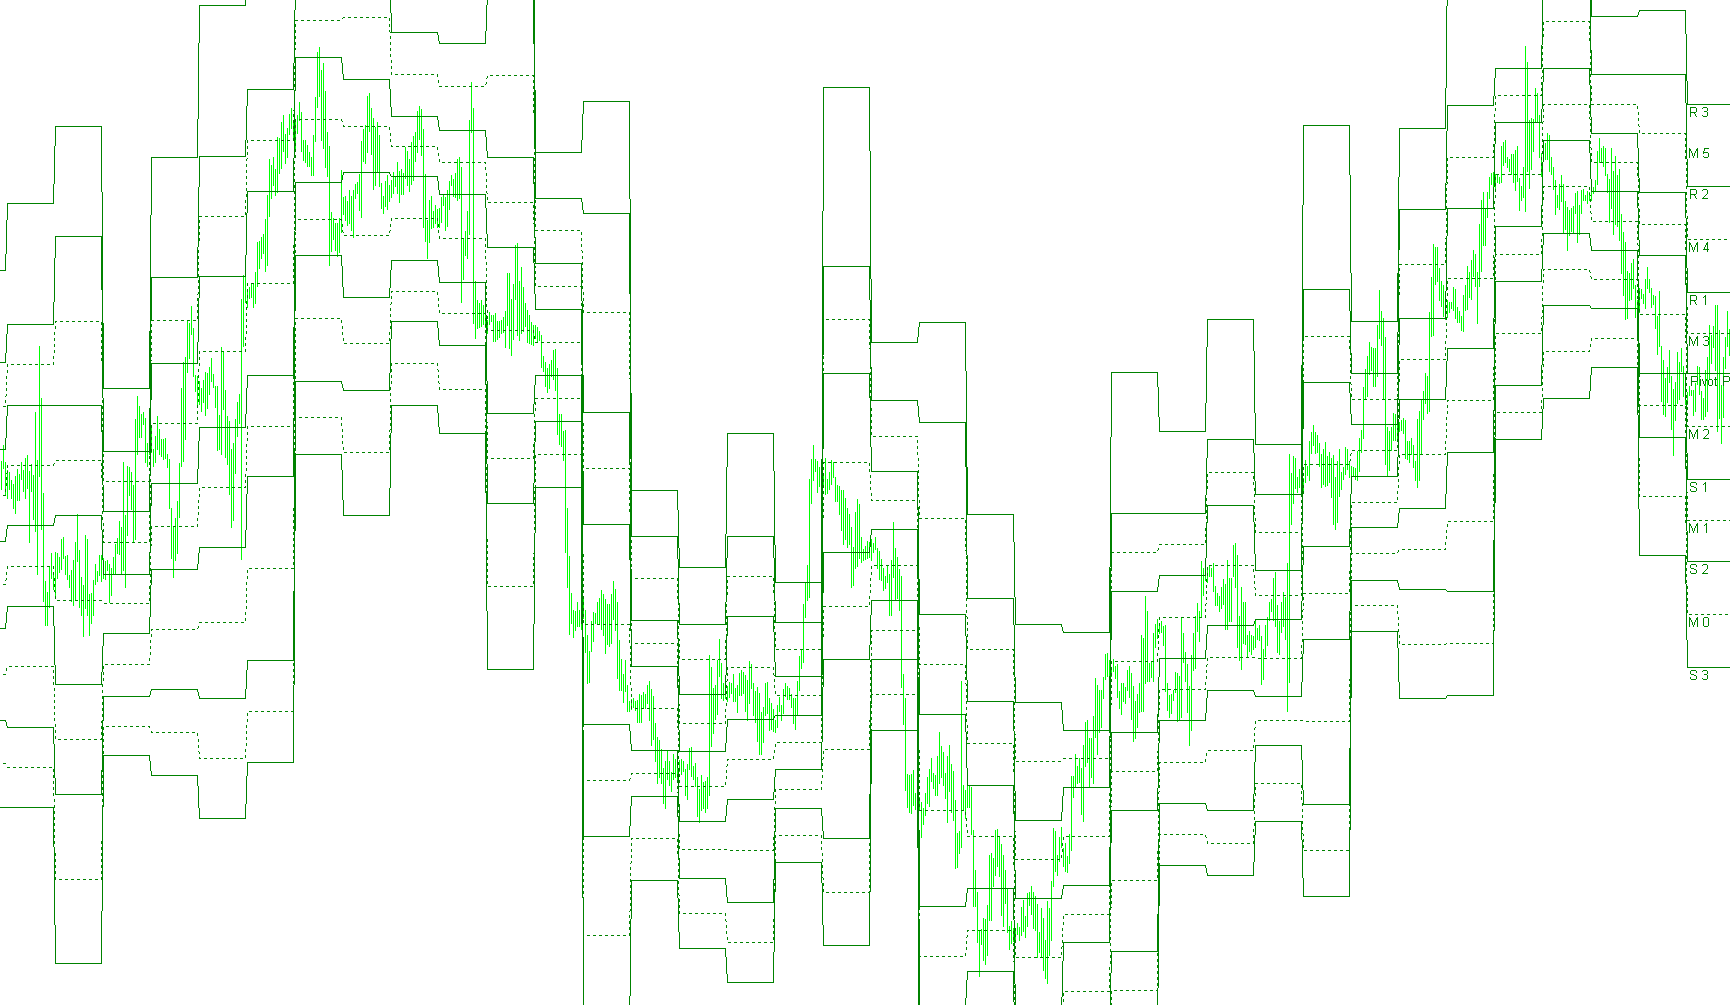
This tool is designed for MetaTrader 4 to help traders identify key structural levels on a price chart. It automatically calculates and displays "Pivot Points" and their corresponding Support and Resistance levels, along with additional mid-point markers, providing a visual map of where price action might encounter friction or reversal points.
Core Logic and Functionality
The script operates based on the following logic:
1. Data Identification The tool identifies the high and low prices reached during a specific period (such as a trading day). It tracks these extremes to establish the boundaries of previous price movement, ensuring that the most significant price peaks and valleys are used as the foundation for its calculations.
2. Pivot Point Calculation At each transition between days, the script calculates a central "Pivot Point." This is determined by taking the average of the previous period's high, low, and closing prices. This serves as the primary "anchor" or equilibrium price for the current session.
3. Support and Resistance Levels (S1–S3 and R1–R3) From that central Pivot Point, the script mathematically projects three levels of support (downside) and resistance (upside):
- Primary Levels (S1/R1): These are the immediate boundaries based on the previous period's range.
- Secondary Levels (S2/R2): These expand further out, representing broader price targets or zones of significant interest.
- Tertiary Levels (S3/R3): These represent extreme price extensions, often used to identify overextended markets where a major trend might be exhausted.
4. Mid-Level Markers (M0–M5) To provide more granular detail between the main support and resistance lines, the script calculates six "Mid Levels." These are derived by finding the halfway points between the various calculated pivots, supports, and resistances. These markers help traders identify smaller "stepping stones" within the larger price structure.
Visual Presentation
The script handles all the heavy lifting by:
- Dynamic Rendering: It automatically draws and updates lines on the chart so they stay synchronized with the price action.
- Automated Labeling: Every calculated level is clearly labeled (e.g., "S 1", "R 2", "M 3") in a clean format, allowing for immediate identification of price zones without manual calculation.
- Compatibility: It includes a safety check to ensure it only runs on specific timeframes, maintaining chart clarity and calculation accuracy.
Summary for the User
Essentially, this script takes the historical data of yesterday's trading and "projects" it onto today's chart. Instead of you having to do complex math to figure out where price might stall or bounce, the tool draws a comprehensive grid of levels, showing you exactly where the market's "floor," "ceiling," and "middle grounds" are expected to be.
//+------------------------------------------------------------------+
//|                                       Pivots with Mid Levels.mq4 |
//|                                                              Rob |
//|                                        http://www.metaquotes.net |
//+------------------------------------------------------------------+
#property copyright "Rob"
#property link      "http://www.metaquotes.net"

#property indicator_chart_window

#property indicator_buffers 12
#property indicator_color1 Green
#property indicator_color2 Green
#property indicator_color3 Green
#property indicator_color4 Green
#property indicator_color5 Green
#property indicator_color6 Green
#property indicator_color7 Green
#property indicator_color8 Green
#property indicator_color9 Green
#property indicator_color10 Green
#property indicator_color11 Green
#property indicator_color11 Green
#property indicator_color12 Green

//---- input parameters

//---- buffers
double PBuffer[];
double S1Buffer[];
double R1Buffer[];
double S2Buffer[];
double R2Buffer[];
double S3Buffer[];
double R3Buffer[];
double M0Buffer[];
double M1Buffer[];
double M2Buffer[];
double M3Buffer[];
double M4Buffer[];
double M5Buffer[];

string Pivot="Pivot Point",Sup1="S 1", Res1="R 1";
string Sup2="S 2", Res2="R 2", Sup3="S 3", Res3="R 3";
int fontsize=10;
double P,S1,R1,S2,R2,S3,R3;
double LastHigh,LastLow,x;
string Med0="M 0",Med1="M 1",Med2="M 2",Med3="M 3",Med4="M 4",Med5="M 5";
double M0,M1,M2,M3,M4,M5;


//+------------------------------------------------------------------+
//| Custor indicator deinitialization function                       |
//+------------------------------------------------------------------+
int deinit()
  {
   ObjectDelete("Pivot");
   ObjectDelete("Sup1");
   ObjectDelete("Res1");
   ObjectDelete("Sup2");
   ObjectDelete("Res2");
   ObjectDelete("Sup3");
   ObjectDelete("Res3");
   ObjectDelete("Med0");
   ObjectDelete("Med1");
   ObjectDelete("Med2");
   ObjectDelete("Med3");
   ObjectDelete("Med4");
   ObjectDelete("Med5");
   return(0);
  }
//+------------------------------------------------------------------+
//| Custom indicator initialization function                         |
//+------------------------------------------------------------------+
int init()
  {
   string short_name;


//---- indicator line
   SetIndexStyle(0,DRAW_LINE,0,1,Green);
   SetIndexStyle(1,DRAW_LINE,0,1,Green);
   SetIndexStyle(2,DRAW_LINE,0,1,Green);
   SetIndexStyle(3,DRAW_LINE,0,1,Green);
   SetIndexStyle(4,DRAW_LINE,0,1,Green);
   SetIndexStyle(5,DRAW_LINE,0,1,Green);
   SetIndexStyle(6,DRAW_LINE,0,1,Green);
   SetIndexStyle(7,DRAW_LINE,STYLE_DOT,1,Green);
   SetIndexStyle(8,DRAW_LINE,STYLE_DOT,1,Green);
   SetIndexStyle(9,DRAW_LINE,STYLE_DOT,1,Green);
   SetIndexStyle(10,DRAW_LINE,STYLE_DOT,1,Green);
   SetIndexStyle(11,DRAW_LINE,STYLE_DOT,1,Green);
   SetIndexStyle(12,DRAW_LINE,STYLE_DOT,1,Green);

   SetIndexBuffer(0,PBuffer);
   SetIndexBuffer(1,S1Buffer);
   SetIndexBuffer(2,R1Buffer);
   SetIndexBuffer(3,S2Buffer);
   SetIndexBuffer(4,R2Buffer);
   SetIndexBuffer(5,S3Buffer);
   SetIndexBuffer(6,R3Buffer);
   SetIndexBuffer(7,M0Buffer);
   SetIndexBuffer(8,M1Buffer);
   SetIndexBuffer(9,M2Buffer);
   SetIndexBuffer(10,M3Buffer);
   SetIndexBuffer(11,M4Buffer);
   SetIndexBuffer(12,M5Buffer);

//---- name for DataWindow and indicator subwindow label
   short_name="Pivot Points";
   IndicatorShortName(short_name);
   SetIndexLabel(0,short_name);

//----
   SetIndexDrawBegin(0,1);
//----


//----
   return(0);
  }

//+------------------------------------------------------------------+
//| Custom indicator iteration function                              |
//+------------------------------------------------------------------+
int start()

  {
   int    counted_bars=IndicatorCounted();

   int limit, i;
//---- indicator calculation
if (counted_bars==0)
{
   x=Period();
   if (x>240) return(-1);
   ObjectCreate("Pivot", OBJ_TEXT, 0, 0,0);
   ObjectSetText("Pivot", "                 Pivot Point",fontsize,"Arial",Green);
   ObjectCreate("Sup1", OBJ_TEXT, 0, 0, 0);
   ObjectSetText("Sup1", "      S 1",fontsize,"Arial",Green);
   ObjectCreate("Res1", OBJ_TEXT, 0, 0, 0);
   ObjectSetText("Res1", "      R 1",fontsize,"Arial",Green);
   ObjectCreate("Sup2", OBJ_TEXT, 0, 0, 0);
   ObjectSetText("Sup2", "      S 2",fontsize,"Arial",Green);
   ObjectCreate("Res2", OBJ_TEXT, 0, 0, 0);
   ObjectSetText("Res2", "      R 2",fontsize,"Arial",Green);
   ObjectCreate("Sup3", OBJ_TEXT, 0, 0, 0);
   ObjectSetText("Sup3", "      S 3",fontsize,"Arial",Green);
   ObjectCreate("Res3", OBJ_TEXT, 0, 0, 0);
   ObjectSetText("Res3", "      R 3",fontsize,"Arial",Green);
   ObjectCreate("Med0", OBJ_TEXT, 0, 0,0);
   ObjectSetText("Med0", "      M 0",fontsize,"Arial",Green);
   ObjectCreate("Med1", OBJ_TEXT, 0, 0, 0);
   ObjectSetText("Med1", "      M 1",fontsize,"Arial",Green);
   ObjectCreate("Med2", OBJ_TEXT, 0, 0, 0);
   ObjectSetText("Med2", "      M 2",fontsize,"Arial",Green);
   ObjectCreate("Med3", OBJ_TEXT, 0, 0, 0);
   ObjectSetText("Med3", "      M 3",fontsize,"Arial",Green);
   ObjectCreate("Med4", OBJ_TEXT, 0, 0, 0);
   ObjectSetText("Med4", "      M 4",fontsize,"Arial",Green);
   ObjectCreate("Med5", OBJ_TEXT, 0, 0, 0);
   ObjectSetText("Med5", "      M 5",fontsize,"Arial",Green);
}
   if(counted_bars<0) return(-1);
//---- last counted bar will be recounted
//   if(counted_bars>0) counted_bars--;
   limit=(Bars-counted_bars)-1;


for (i=limit; i>=0;i--)
{

if (High[i+1]>LastHigh) LastHigh=High[i+1];
if (Low[i+1]<LastLow) LastLow=Low[i+1];

if (TimeDay(Time[i])!=TimeDay(Time[i+1]))
   {
   P=(LastHigh+LastLow+Close[i+1])/3;
   R1 = (2*P)-LastLow;
   S1 = (2*P)-LastHigh;
   R2 = P+(LastHigh - LastLow);
   S2 = P-(LastHigh - LastLow);
   R3 = (2*P)+(LastHigh-(2*LastLow));
   S3 = (2*P)-((2* LastHigh)-LastLow);
   M5 = (R2 + R3) / 2 ;
   M4 = (R2 + R1) / 2 ;
   M3 = (P + R1) / 2  ;
   M2 = (P + S1) / 2  ;
   M1 = (S2 + S1) / 2 ;
   M0 = (S2 + S3) /2  ;

   LastLow=Open[i]; LastHigh=Open[i];

   ObjectMove("Pivot", 0, Time[i],P);
   ObjectMove("Sup1", 0, Time[i],S1);
   ObjectMove("Res1", 0, Time[i],R1);
   ObjectMove("Sup2", 0, Time[i],S2);
   ObjectMove("Res2", 0, Time[i],R2);
   ObjectMove("Sup3", 0, Time[i],S3);
   ObjectMove("Res3", 0, Time[i],R3);
   ObjectMove("Med0", 0, Time[i],M0);
   ObjectMove("Med1", 0, Time[i],M1);
   ObjectMove("Med2", 0, Time[i],M2);
   ObjectMove("Med3", 0, Time[i],M3);
   ObjectMove("Med4", 0, Time[i],M4);
   ObjectMove("Med5", 0, Time[i],M5);
   }

    PBuffer[i]=P;
    S1Buffer[i]=S1;
    R1Buffer[i]=R1;
    S2Buffer[i]=S2;
    R2Buffer[i]=R2;
    S3Buffer[i]=S3;
    R3Buffer[i]=R3;
    M0Buffer[i]=M0;
    M1Buffer[i]=M1;
    M2Buffer[i]=M2;
    M3Buffer[i]=M3;
    M4Buffer[i]=M4;
    M5Buffer[i]=M5;
   }

//----
   return(0);
  }
//+------------------------------------------------------------------+
Comments