Pivot Range_v1
Download script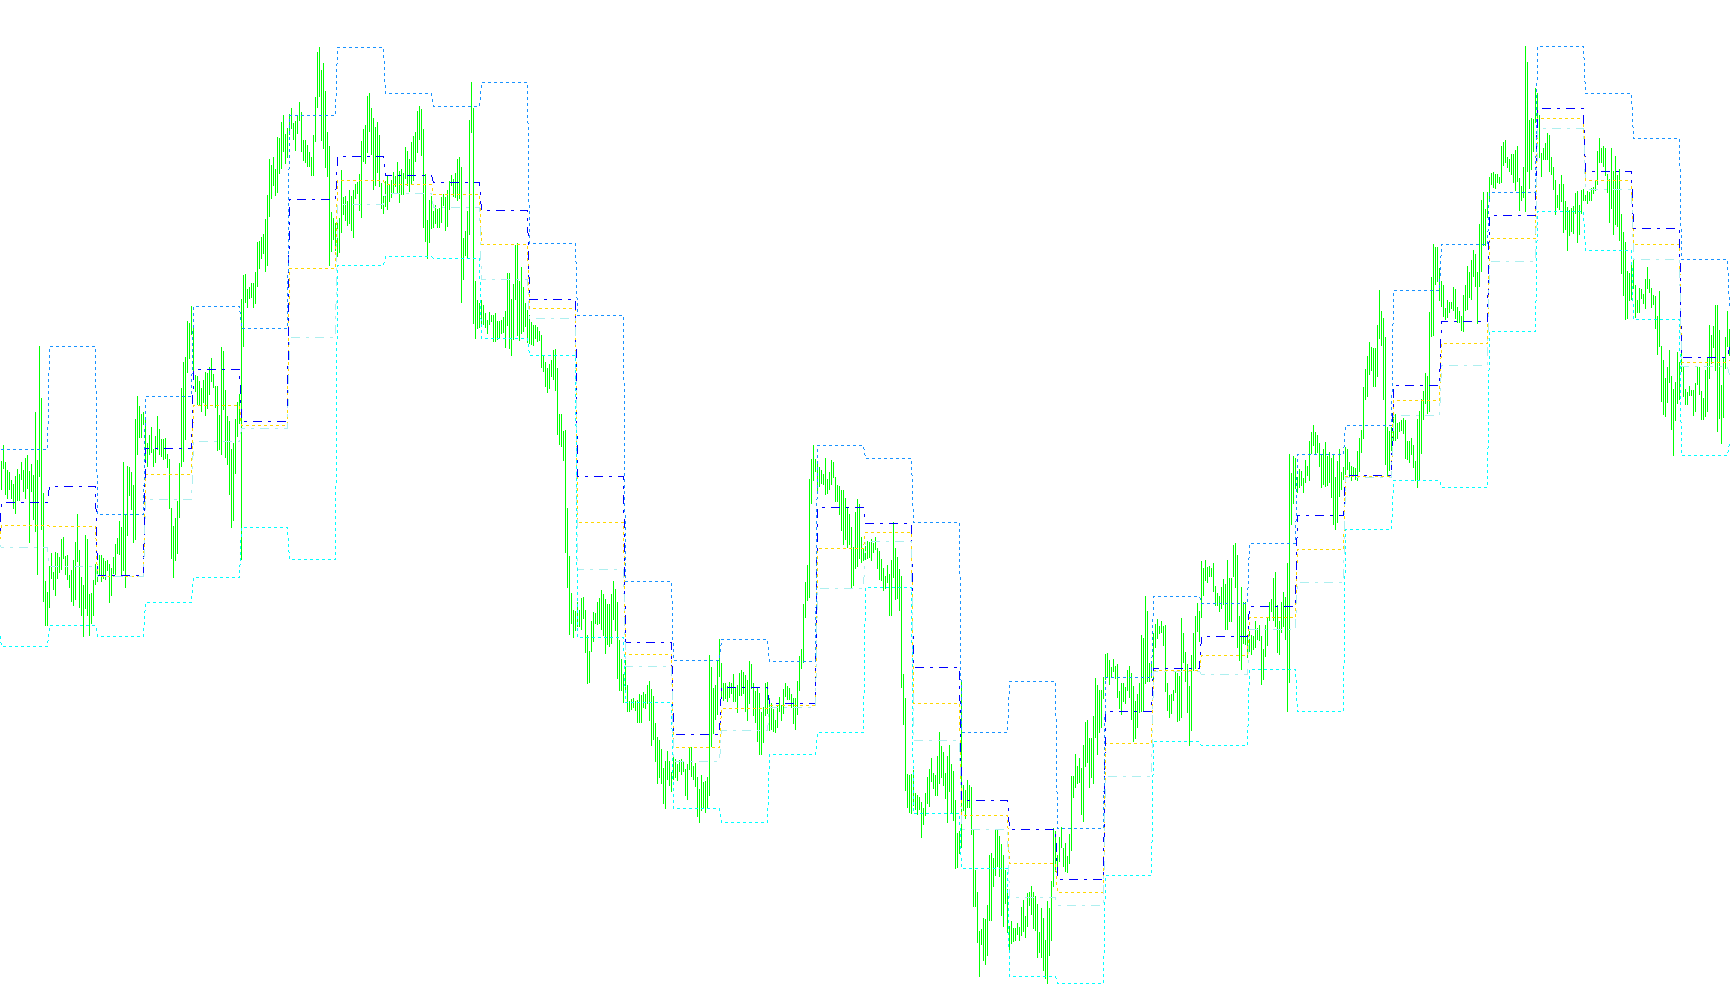
This tool is designed to provide traders with a visual roadmap of significant price levels on a trading chart. By analyzing specific timeframes, it automatically identifies key "Pivot Points" and historical boundaries, helping you see where the market might encounter resistance or support.
Core Functionality
The script focuses on three primary types of data visualization:
1. Custom Pivot Range Analysis The tool allows you to define a specific start and end time (for example, a specific trading session). Once that timeframe is identified, the logic calculates:
- Pivot Point: The central "equilibrium" price of that specific period.
- Pivot Top & Bottom: A calculated range based on the volatility of that period, showing the upper and lower boundaries of price movement.
2. Historical Highs and Lows The script identifies and displays the highest and lowest prices reached during the defined pivot range. This provides a clear visual of the "trading zone" for that session, allowing you to see exactly where the price moved most aggressively.
3. Moving Averages of Pivots For users who prefer trend analysis, the script can calculate moving averages based on the Pivot Points themselves (rather than just standard price). It can track these averages over 14, 30, and 50 periods, helping to smooth out the central pivot data into a clearer trend line.
How it Works on Your Chart
Instead of you having to manually calculate these numbers, the script scans the history of the chart:
- It looks for your specified start/end times.
- It captures the High, Low, and Close prices during those windows.
- It automatically plots these levels as lines on your screen.
User Customization
The tool is designed to be flexible based on your visual preferences:
- Toggle Features: You can turn off the display of the Pivot Point, the Historical Highs/Lows, or the Moving Averages depending on what information you find most useful for your strategy.
- Visual Clarity: Each data point (Pivots, Ranges, and Moving Averages) is assigned a distinct color and line style so they remain easy to read even when all features are active at once.
/*-----------------------------+
|			       |
| Shared by www.Aptrafx.com    |
|			       |
+------------------------------*/

/**
* ACD_2.mq4
* Pivot Range and Previous High/Low
**/

#property indicator_chart_window
#property indicator_buffers 8
#property indicator_color1 Magenta
#property indicator_color2 DarkSlateGray
#property indicator_color3 DarkSlateGray
#property indicator_color4 Blue
#property indicator_color5 Red
#property indicator_color6 Red
#property indicator_color7 Blue
#property indicator_color8 Orchid

//Input Params
extern string PivotRangeStart = "21:00";
extern string PivotRangeEnd = "21:00";
extern bool DisplayPivotPoint = true;
extern bool DisplayPreviousHighLow = true;
extern bool DisplayMAs = false;

double Buffer1[];
double Buffer2[];
double Buffer3[];
double Buffer4[];
double Buffer5[];
double Buffer6[];
double Buffer7[];
double Buffer8[];

double pivots[50];

double pivotRangeHigh;
double pivotRangeLow;
double pivotRangeClose;
double pivotPoint;
double pivotDiff;

double pivotTop=0;
double pivotBottom=0;

double pivot14MA;
double pivot30MA;
double pivot50MA;

int openBar;

int init()
{
   SetIndexStyle(0,DRAW_LINE, STYLE_DOT, 1);
   SetIndexBuffer(0,Buffer1);
   SetIndexLabel(0,"Pivot Point");

   SetIndexStyle(1,DRAW_LINE, STYLE_DASHDOT, 1);
   SetIndexBuffer(1,Buffer2);
   SetIndexLabel(1,"Pivot Range Top");

   SetIndexStyle(2,DRAW_LINE, STYLE_DASHDOT, 1);
   SetIndexBuffer(2,Buffer3);
   SetIndexLabel(2,"Pivot Range Bottom");

   SetIndexStyle(3,DRAW_LINE, STYLE_DOT, 1);
   SetIndexBuffer(3,Buffer4);
   SetIndexLabel(3,"Previous Day High");

   SetIndexStyle(4,DRAW_LINE, STYLE_DOT, 1);
   SetIndexBuffer(4,Buffer5);
   SetIndexLabel(4,"Previous Day Low");

   SetIndexStyle(5,DRAW_LINE);
   SetIndexBuffer(5,Buffer6);
   SetIndexLabel(5,"14 MA");

   SetIndexStyle(6,DRAW_LINE);
   SetIndexBuffer(6,Buffer7);
   SetIndexLabel(6,"30 MA");

   SetIndexStyle(7,DRAW_LINE);
   SetIndexBuffer(7,Buffer8);
   SetIndexLabel(7,"50 MA");

   return(0);
}

int deinit()
{
   return(0);
}

int start()
{
   string barTime="", lastBarTime="";
   string barDay="", lastBarDay="";
   int closeBar;

   for(int i=Bars; i>=0; i--)
   {
      barTime = TimeToStr(Time[i], TIME_MINUTES);
      lastBarTime = TimeToStr(Time[i+1], TIME_MINUTES);
      barDay = TimeToStr(Time[i],TIME_DATE);
      lastBarDay = TimeToStr(Time[i+1],TIME_DATE);

      //need to handle if pivotrangestart/end is 00:00
      if ((PivotRangeEnd == "00:00" && barTime>=PivotRangeEnd && barDay>lastBarDay) || (barTime>=PivotRangeEnd && lastBarTime<PivotRangeEnd))
      {
         closeBar = i + 1;

         if (openBar>0)
         {
            calculatePivotRangeValues(openBar, closeBar);
         }
      }

      if ((PivotRangeStart == "00:00" && barTime>=PivotRangeStart && barDay>lastBarDay) || (barTime>=PivotRangeStart && lastBarTime<PivotRangeStart))
      {
          openBar = i;
      }

      if (openBar>0)
      {
          drawIndicators(i);
      }
   }
   return(0);
}

void calculatePivotRangeValues(int openBar, int closeBar)
{
   pivotRangeHigh = High[Highest(NULL, 0, MODE_HIGH, (openBar - closeBar + 1), closeBar)];
   pivotRangeLow = Low[Lowest(NULL, 0, MODE_LOW, (openBar - closeBar + 1), closeBar)];
   pivotRangeClose = Close[closeBar];
   pivotPoint = (pivotRangeHigh + pivotRangeLow + pivotRangeClose)/3;
   pivotDiff = MathAbs(((pivotRangeHigh + pivotRangeLow)/2) - pivotPoint);
   pivotTop = pivotPoint + pivotDiff;
   pivotBottom = pivotPoint - pivotDiff;

   if (DisplayMAs) calcPivotMA();
}

void calcPivotMA()
{
   //create temp array
   double pivs[50];

   //load new pivot
   ArrayCopy(pivs,pivots,1,0,49);
   pivs[0] = pivotPoint;
   ArrayCopy(pivots, pivs, 0, 0, WHOLE_ARRAY);

   //calcMA
   double pivSum = 0;
   int count = ArraySize(pivots);
   if (count>=14)
   {
      for (int p=0; p<count; p++)
      {
         pivSum+=pivots[p];

         if (p==13)
         {
            pivot14MA = pivSum/14;
         }

         if (p==29)
         {pivot30MA = pivSum/30;}

         if (p==49)
         {pivot50MA = pivSum/50;}
      }
   }
}

void drawIndicators(int curBar)
{
   if (DisplayPivotPoint) Buffer1[curBar]=pivotPoint;

   Buffer2[curBar]=pivotTop;
   Buffer3[curBar]=pivotBottom;

   if (DisplayPreviousHighLow)
   {
      Buffer4[curBar]=pivotRangeHigh;
      Buffer5[curBar]=pivotRangeLow;
   }

   if (DisplayMAs)
   {
      Buffer6[curBar]=pivot14MA;
      Buffer7[curBar]=pivot30MA;
      Buffer8[curBar]=pivot50MA;
   }


}
Comments