Pivot Range
Download script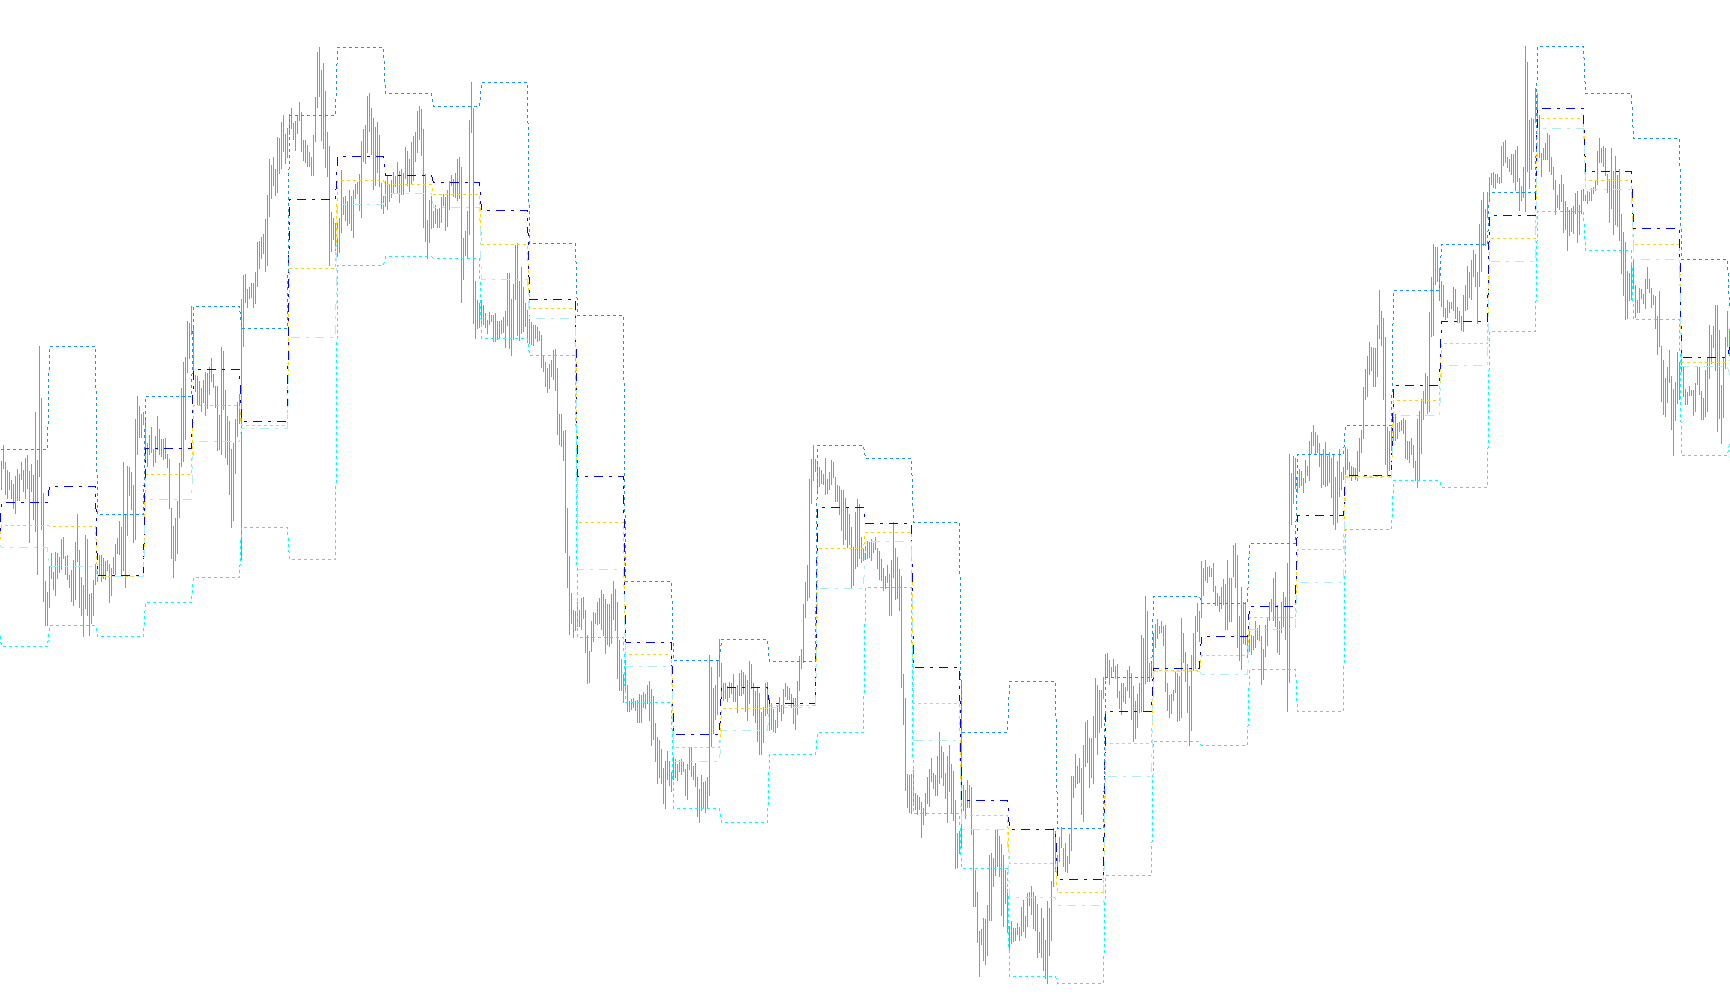
This script is designed to provide traders with a visual roadmap of key price levels by automatically identifying specific "Pivot Points" and significant historical boundaries on a trading chart. Rather than just looking at current prices, it analyzes a defined window of time to help users identify where support and resistance might occur.
Core Functionality
1. Custom Time Range Analysis The tool focuses on a user-defined time window (for example, a specific hour during the trading day). It scans this period to capture three critical pieces of data:
- The highest price reached.
- The lowest price reached.
- The closing price at the end of that window.
2. Pivot Point Calculation Once the script identifies the high, low, and close for your chosen time range, it performs a mathematical calculation to determine a "Pivot Point." This point serves as a central equilibrium level. From there, it calculates two additional boundaries:
- Pivot Top: An upper boundary based on the distance between the midpoint of the range and the calculated pivot.
- Pivot Bottom: A lower boundary mirroring that distance below the pivot.
By displaying these three levels (Point, Top, and Bottom), the script helps you visualize a "trading zone" rather than just a single line.
3. Historical Reference Levels In addition to the dynamic pivot points, the script can highlight the high and low prices of the previous day. This allows traders to see how current price action relates to the most recent major price milestones, providing context on whether the market is breaking out or pulling back into previous ranges.
4. Moving Averages (Optional) The tool includes an optional feature to calculate and display Moving Averages specifically based on the Pivot Points rather than standard price candles. This smooths out the pivot data, helping to identify the long-term trend of these key levels over 14, 30, and 50 periods respectively.
Visual Summary
When active on a chart, the script provides a clean, multi-layered overlay:
- Dynamic Pivot Zones: Shows where the current market "center" is located.
- Previous Day Boundaries: Marks the "floor" and "ceiling" of yesterday's action.
- Trend Lines: Optional smooth lines that show how these pivot levels have shifted over time.
Essentially, this script automates the heavy lifting of manual level drawing, allowing you to see exactly where the market is balanced based on specific historical windows.
/**
* ACD_2.mq4
* Pivot Range and Previous High/Low
**/

#property indicator_chart_window
#property indicator_buffers 8
#property indicator_color1 Magenta
#property indicator_color2 DarkSlateGray
#property indicator_color3 DarkSlateGray
#property indicator_color4 Blue
#property indicator_color5 Red
#property indicator_color6 Red
#property indicator_color7 Blue
#property indicator_color8 Orchid

//Input Params
extern string PivotRangeStart = "21:00";
extern string PivotRangeEnd = "21:00";
extern bool DisplayPivotPoint = true;
extern bool DisplayPreviousHighLow = true;
extern bool DisplayMAs = false;

double Buffer1[];
double Buffer2[];
double Buffer3[];
double Buffer4[];
double Buffer5[];
double Buffer6[];
double Buffer7[];
double Buffer8[];

double pivots[50];

double pivotRangeHigh;
double pivotRangeLow;
double pivotRangeClose;
double pivotPoint;
double pivotDiff;

double pivotTop=0;
double pivotBottom=0;

double pivot14MA;
double pivot30MA;
double pivot50MA;

int openBar;

int init()
{
   SetIndexStyle(0,DRAW_LINE, STYLE_DOT, 1);
   SetIndexBuffer(0,Buffer1);
   SetIndexLabel(0,"Pivot Point");

   SetIndexStyle(1,DRAW_LINE, STYLE_DASHDOT, 1);
   SetIndexBuffer(1,Buffer2);
   SetIndexLabel(1,"Pivot Range Top");

   SetIndexStyle(2,DRAW_LINE, STYLE_DASHDOT, 1);
   SetIndexBuffer(2,Buffer3);
   SetIndexLabel(2,"Pivot Range Bottom");

   SetIndexStyle(3,DRAW_LINE, STYLE_DOT, 1);
   SetIndexBuffer(3,Buffer4);
   SetIndexLabel(3,"Previous Day High");

   SetIndexStyle(4,DRAW_LINE, STYLE_DOT, 1);
   SetIndexBuffer(4,Buffer5);
   SetIndexLabel(4,"Previous Day Low");

   SetIndexStyle(5,DRAW_LINE);
   SetIndexBuffer(5,Buffer6);
   SetIndexLabel(5,"14 MA");

   SetIndexStyle(6,DRAW_LINE);
   SetIndexBuffer(6,Buffer7);
   SetIndexLabel(6,"30 MA");

   SetIndexStyle(7,DRAW_LINE);
   SetIndexBuffer(7,Buffer8);
   SetIndexLabel(7,"50 MA");

   return(0);
}

int deinit()
{
   return(0);
}

int start()
{
   string barTime="", lastBarTime="";
   string barDay="", lastBarDay="";
   int closeBar;

   for(int i=Bars; i>=0; i--)
   {
      barTime = TimeToStr(Time[i], TIME_MINUTES);
      lastBarTime = TimeToStr(Time[i+1], TIME_MINUTES);
      barDay = TimeToStr(Time[i],TIME_DATE);
      lastBarDay = TimeToStr(Time[i+1],TIME_DATE);

      //need to handle if pivotrangestart/end is 00:00
      if ((PivotRangeEnd == "00:00" && barTime>=PivotRangeEnd && barDay>lastBarDay) || (barTime>=PivotRangeEnd && lastBarTime<PivotRangeEnd))
      {
         closeBar = i + 1;

         if (openBar>0)
         {
            calculatePivotRangeValues(openBar, closeBar);
         }
      }

      if ((PivotRangeStart == "00:00" && barTime>=PivotRangeStart && barDay>lastBarDay) || (barTime>=PivotRangeStart && lastBarTime<PivotRangeStart))
      {
          openBar = i;
      }

      if (openBar>0)
      {
          drawIndicators(i);
      }
   }
   return(0);
}

void calculatePivotRangeValues(int openBar, int closeBar)
{
   pivotRangeHigh = High[Highest(NULL, 0, MODE_HIGH, (openBar - closeBar + 1), closeBar)];
   pivotRangeLow = Low[Lowest(NULL, 0, MODE_LOW, (openBar - closeBar + 1), closeBar)];
   pivotRangeClose = Close[closeBar];
   pivotPoint = (pivotRangeHigh + pivotRangeLow + pivotRangeClose)/3;
   pivotDiff = MathAbs(((pivotRangeHigh + pivotRangeLow)/2) - pivotPoint);
   pivotTop = pivotPoint + pivotDiff;
   pivotBottom = pivotPoint - pivotDiff;

   if (DisplayMAs) calcPivotMA();
}

void calcPivotMA()
{
   //create temp array
   double pivs[50];

   //load new pivot
   ArrayCopy(pivs,pivots,1,0,49);
   pivs[0] = pivotPoint;
   ArrayCopy(pivots, pivs, 0, 0, WHOLE_ARRAY);

   //calcMA
   double pivSum = 0;
   int count = ArraySize(pivots);
   if (count>=14)
   {
      for (int p=0; p<count; p++)
      {
         pivSum+=pivots[p];

         if (p==13)
         {
            pivot14MA = pivSum/14;
         }

         if (p==29)
         {pivot30MA = pivSum/30;}

         if (p==49)
         {pivot50MA = pivSum/50;}
      }
   }
}

void drawIndicators(int curBar)
{
   if (DisplayPivotPoint) Buffer1[curBar]=pivotPoint;

   Buffer2[curBar]=pivotTop;
   Buffer3[curBar]=pivotBottom;

   if (DisplayPreviousHighLow)
   {
      Buffer4[curBar]=pivotRangeHigh;
      Buffer5[curBar]=pivotRangeLow;
   }

   if (DisplayMAs)
   {
      Buffer6[curBar]=pivot14MA;
      Buffer7[curBar]=pivot30MA;
      Buffer8[curBar]=pivot50MA;
   }


}
Comments